| Param | Original file | Final file |
|---|---|---|
| Filename | modeM0/AS1G06_076T01_9000001038_07524cztM0_level2.evt | modeM0/AS1G06_076T01_9000001038_07524cztM0_level2_quad_clean.evt |
| Size (bytes) | 451,356,480 | 78,920,640 |
| Size | 430.4 MB | 75.3 MB |
| Events in quadrant A | 3,165,958 | 492,823 |
| Events in quadrant B | 3,200,668 | 501,576 |
| Events in quadrant C | 3,080,240 | 484,864 |
| Events in quadrant D | 3,787,627 | 464,090 |
| Mode M9 | |||
|---|---|---|---|
| Quadrant | BADHDUFLAG | Total packets | Discarded packets |
| A | 0 | 13 | 0 |
| B | 0 | 13 | 0 |
| C | 0 | 13 | 0 |
| D | 0 | 14 | 0 |
| Mode M0 | |||
|---|---|---|---|
| Quadrant | BADHDUFLAG | Total packets | Discarded packets |
| A | 0 | 13534 | 3 |
| B | 0 | 13564 | 2 |
| C | 0 | 13437 | 2 |
| D | 0 | 15427 | 2 |
| Mode SS | |||
|---|---|---|---|
| Quadrant | BADHDUFLAG | Total packets | Discarded packets |
| A | 0 | 130 | 0 |
| B | 0 | 130 | 0 |
| C | 0 | 130 | 0 |
| D | 0 | 130 | 0 |
| Quadrant | Total seconds | Saturated seconds | Saturation percentage |
|---|---|---|---|
| A | 6399 | 74 | 1.156431% |
| B | 6399 | 73 | 1.140803% |
| C | 6399 | 56 | 0.875137% |
| D | 6399 | 122 | 1.906548% |
Noise dominated data is calculated using 1-second bins in cleaned event files. If a bin has >2000 counts, and if more than 50% of those come from <1% of pixels, then it is considered to be noise-dominated and hence unusable.
| Quadrant | # 1 sec bins | Bins with >0 counts | Bins with >2000 counts | High rate bins dominated by noise | Noise dominated (total time) | Noise dominated (detector-on time) | Marked lightcurve |
|---|---|---|---|---|---|---|---|
| A | 7579 | 6399 | 3 | 3 | 0.04% | 0.05% | 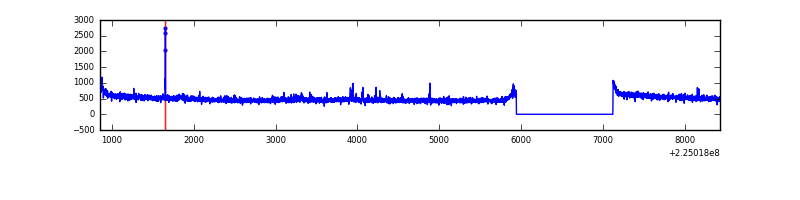 |
| B | 7579 | 6399 | 1 | 1 | 0.01% | 0.02% | 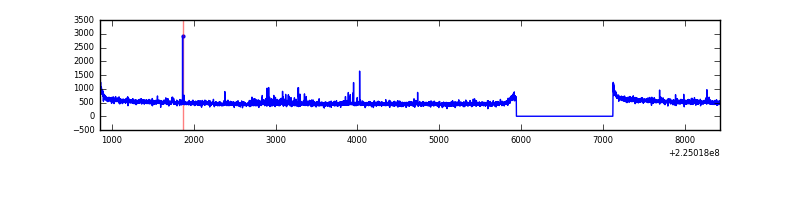 |
| C | 7579 | 6400 | 0 | 0 | 0.00% | 0.00% | 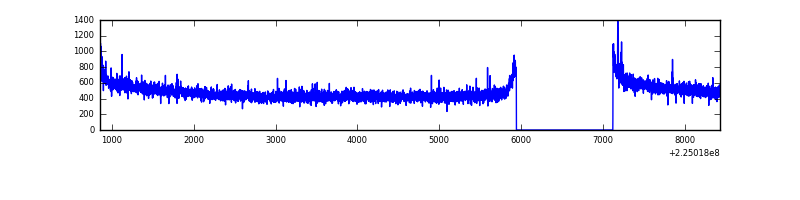 |
| D | 7579 | 6399 | 42 | 42 | 0.55% | 0.66% | 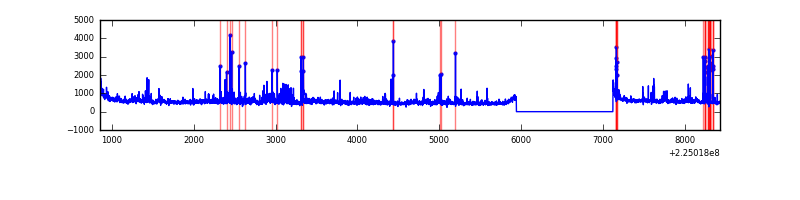 |
Top three noisy pixels from each quadrant. If the there are fewer than three noisy pixels in the level2.evt file, extra rows are filled as -1
| Pixel properties | Quadrant properties | ||||||
|---|---|---|---|---|---|---|---|
| Quadrant | DetID | PixID | Counts | Sigma | Mean | Median | Sigma |
| A | 13 | 251 | 45905 | 279.82 | 804 | 786 | 161.2 |
| A | 13 | 14 | 15677 | 92.35 | 804 | 786 | 161.2 |
| A | 13 | 248 | 8391 | 47.16 | 804 | 786 | 161.2 |
| B | 0 | 214 | 56386 | 366.71 | 806 | 786 | 151.6 |
| B | 12 | 111 | 14976 | 93.59 | 806 | 786 | 151.6 |
| B | 0 | 219 | 13362 | 82.95 | 806 | 786 | 151.6 |
| C | 8 | 229 | 18910 | 100.76 | 782 | 786 | 179.9 |
| C | 13 | 61 | 6019 | 29.09 | 782 | 786 | 179.9 |
| C | 9 | 68 | 5998 | 28.98 | 782 | 786 | 179.9 |
| D | 12 | 221 | 324303 | 1716.04 | 779 | 755 | 188.5 |
| D | 2 | 152 | 198730 | 1050.03 | 779 | 755 | 188.5 |
| D | 2 | 14 | 109646 | 577.54 | 779 | 755 | 188.5 |
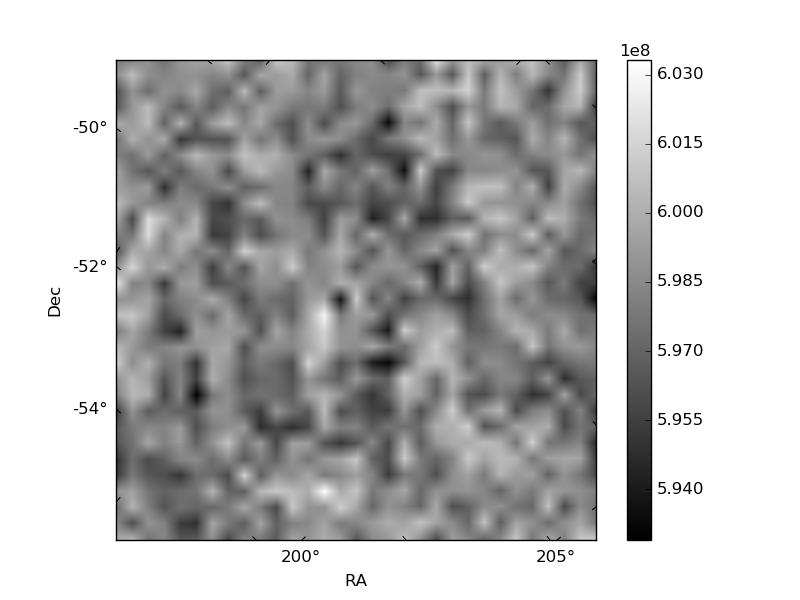
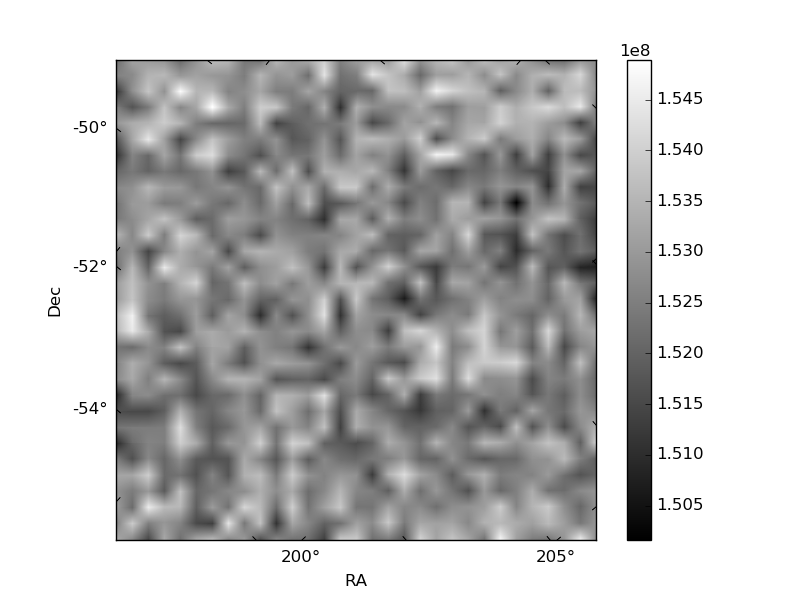
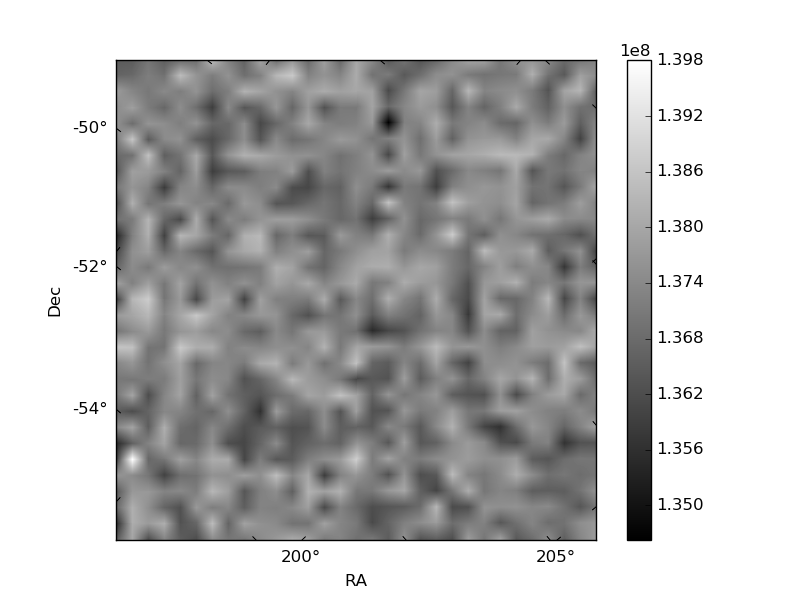
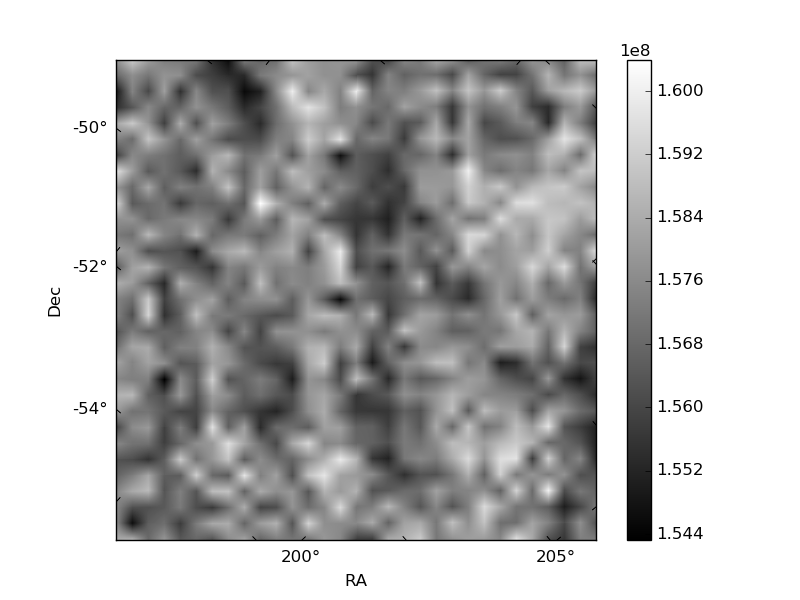
Histogram calculated using DETX and DETY for each event in the final _common_clean file
| Quadrant A | 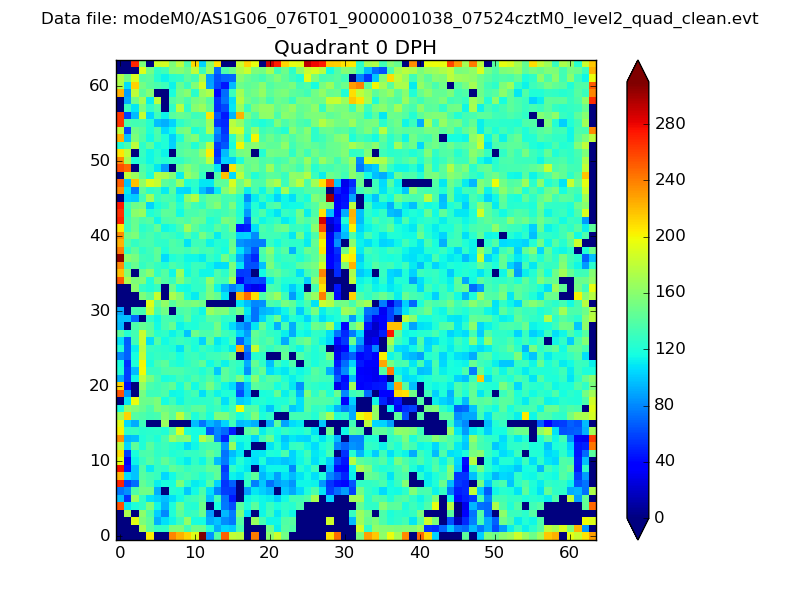 |
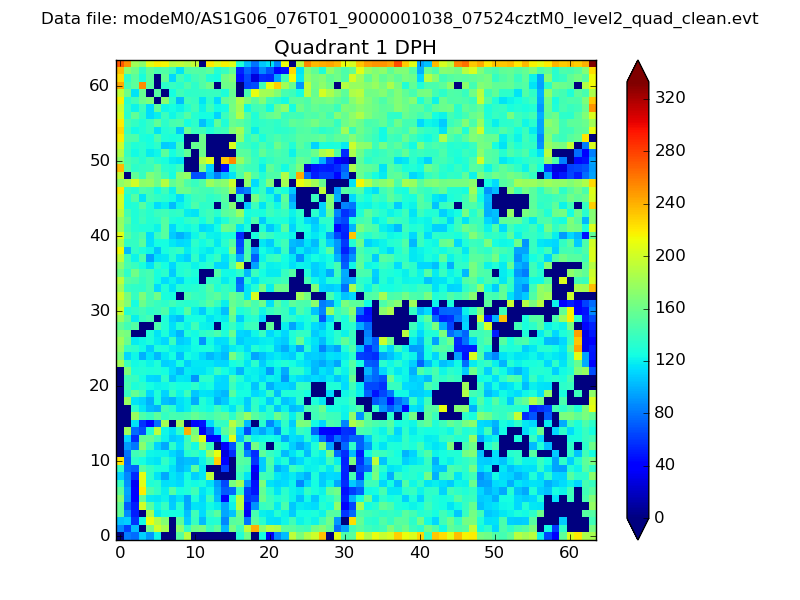 |
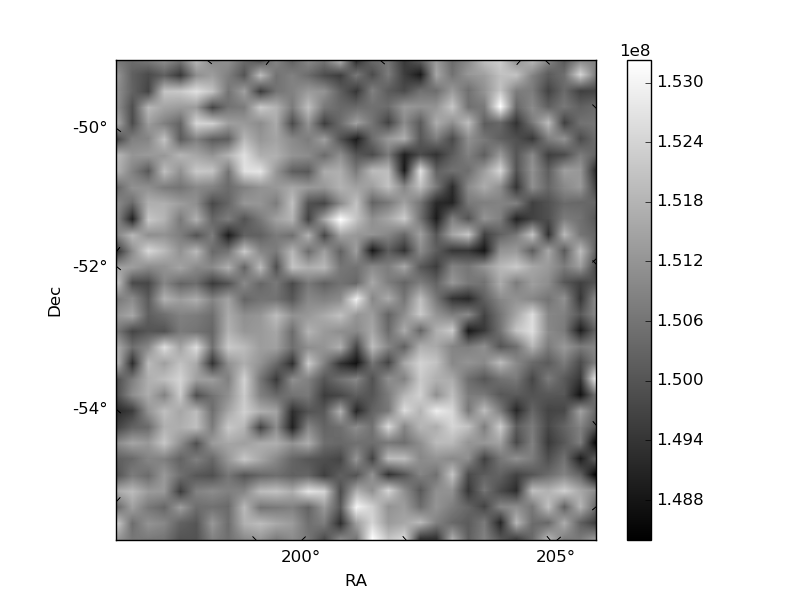
Quadrant B |
|---|---|---|---|
| Quadrant D | 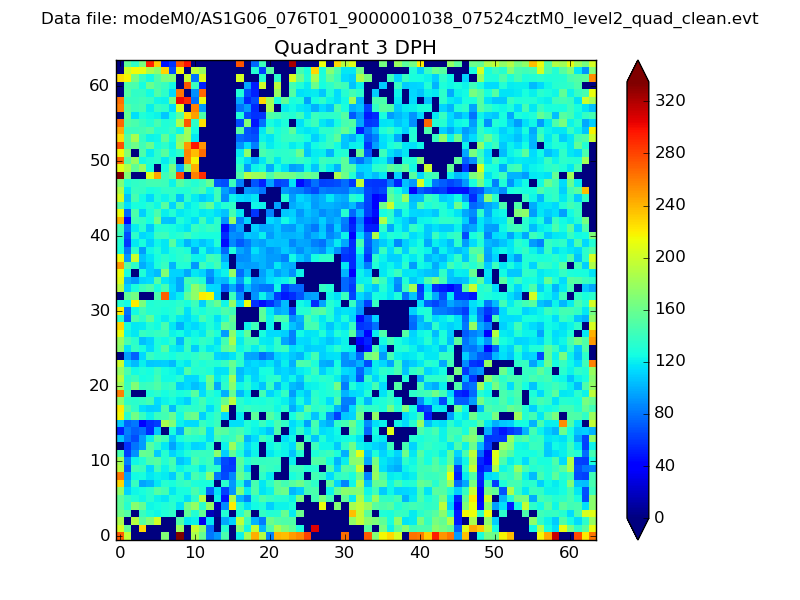 |
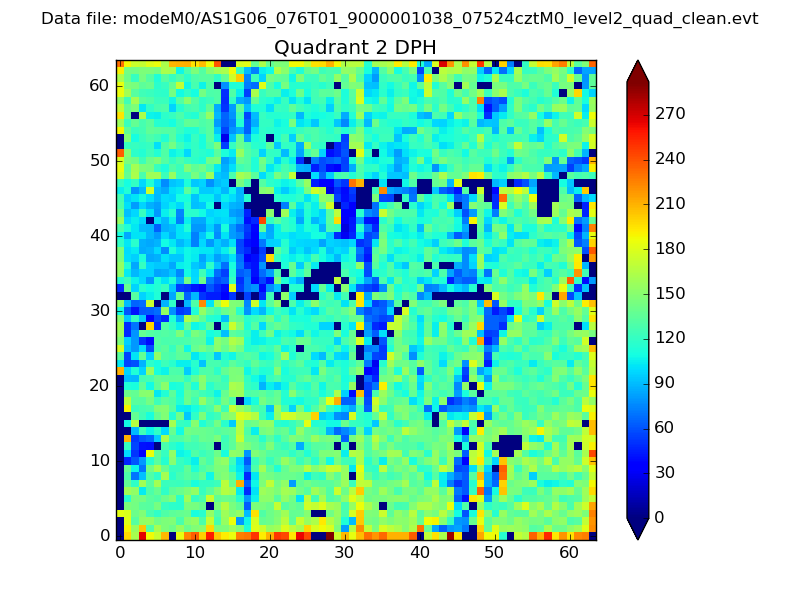 |
Quadrant C |
| Plot type | Count rate plots | Images |
|---|---|---|
| Comparison with Poisson distribution Blue bars denote a histogram of data divided into 1 sec bins. Red curve is a Poisson curve with rate = median count rate of data. |
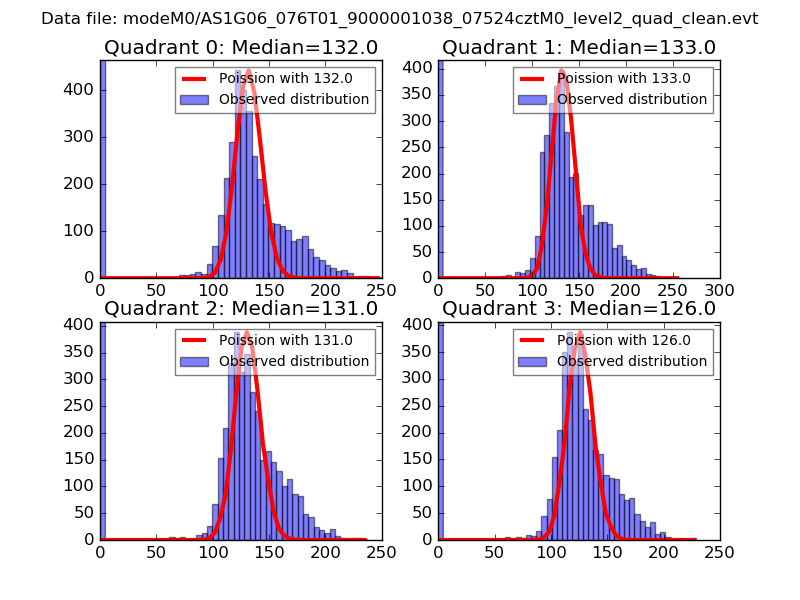 |
 |
| Quadrant-wise count rates Data is divided into 100 sec bins |
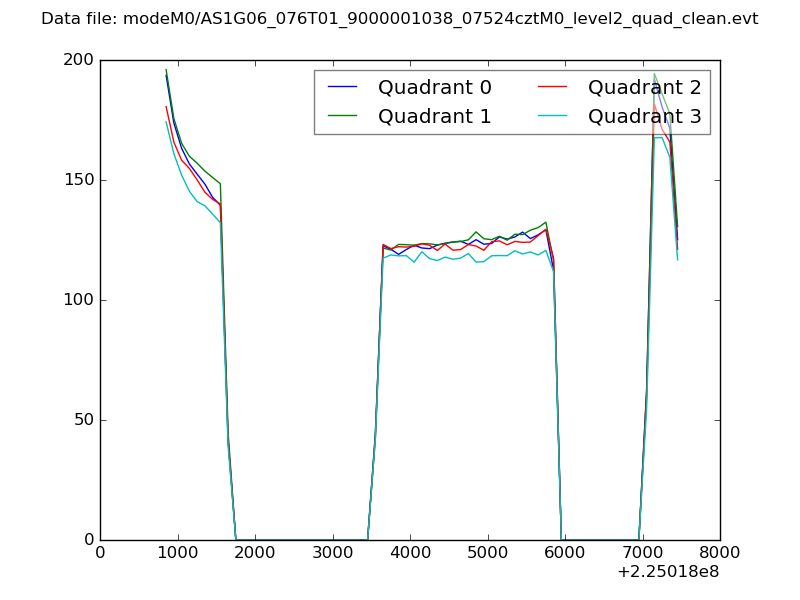 |
|
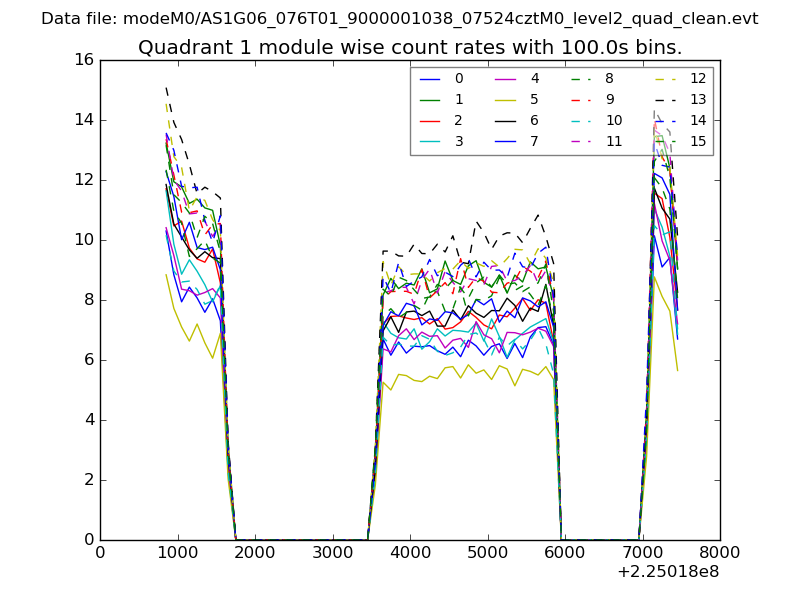
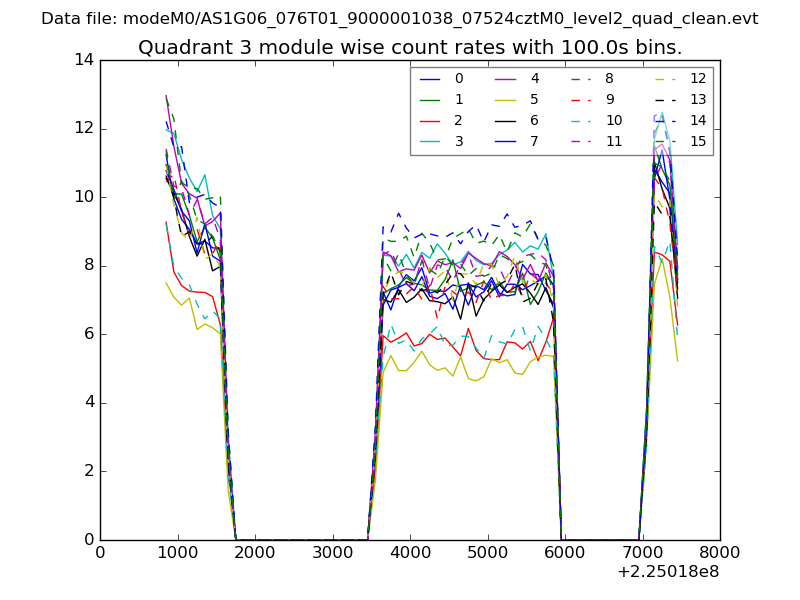
| Module-wise count rates for Quadrant A Data is divided into 100 sec bins |
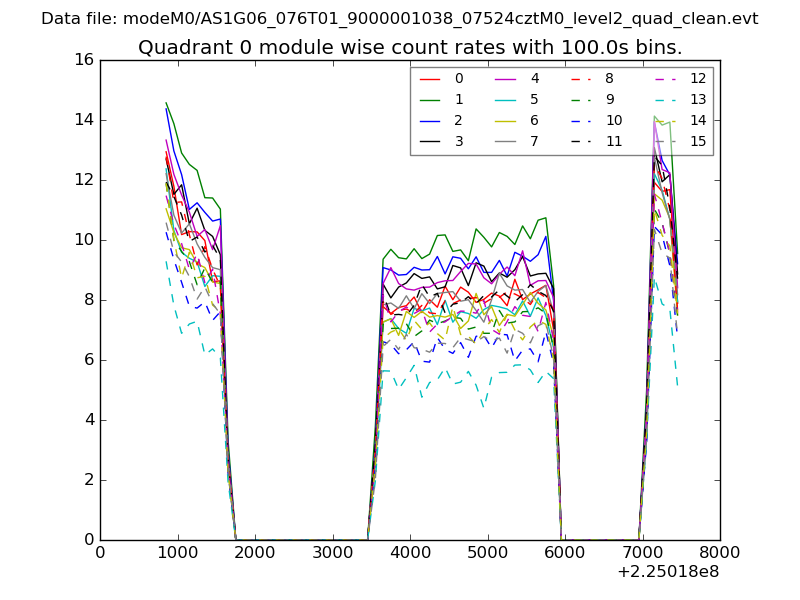 |
 |
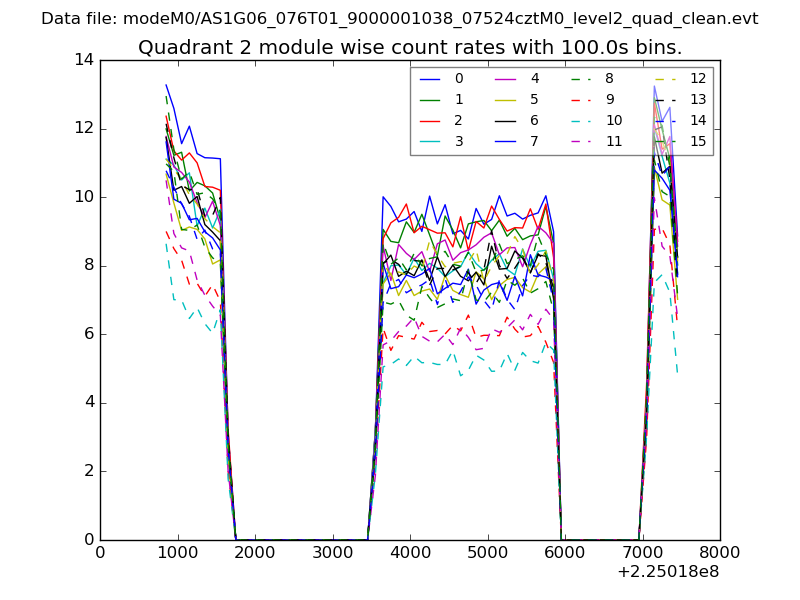
| Module-wise count rates for Quadrant B Data is divided into 100 sec bins |
 |
 |
| Module-wise count rates for Quadrant C Data is divided into 100 sec bins |
 |
 |
| Module-wise count rates for Quadrant D Data is divided into 100 sec bins |
 |
 |
| Parameter | Plot |
|---|---|
| CZT HV Monitor | 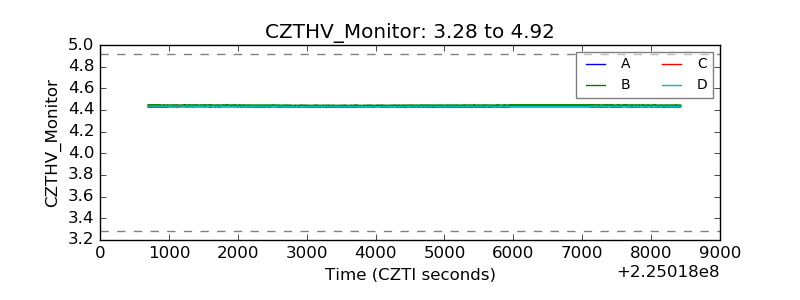 |
| D_VDD | 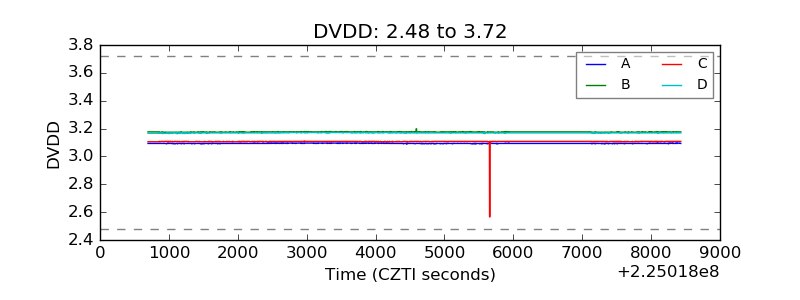 |
| Temperature 1 | 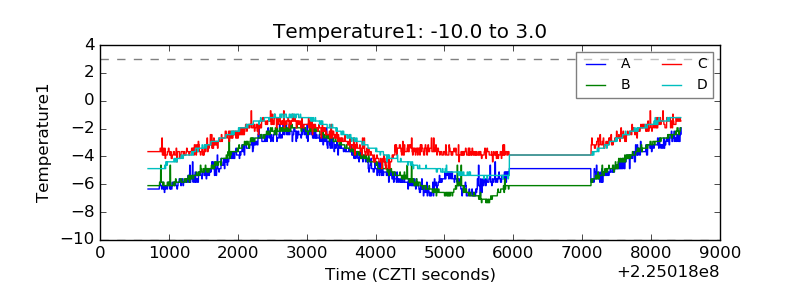 |
| Veto HV Monitor | 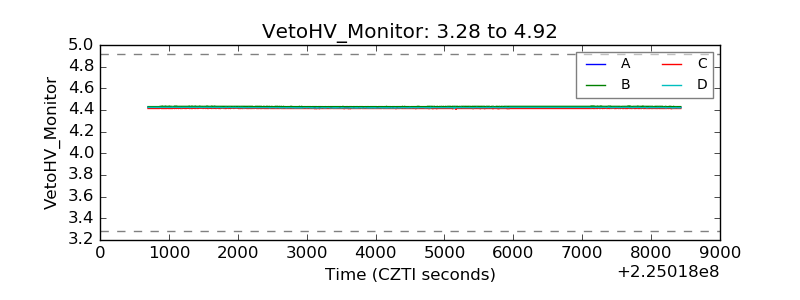 |
| Veto LLD | 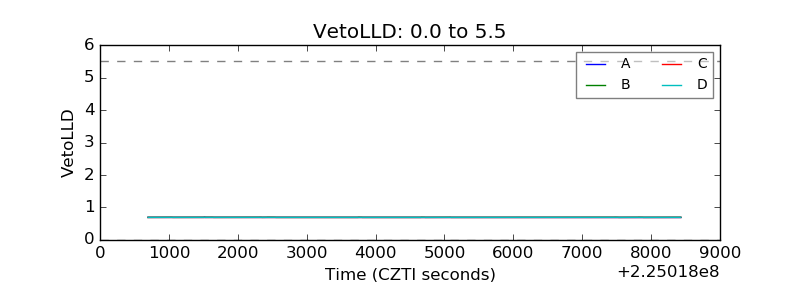 |
| Alpha Counter | 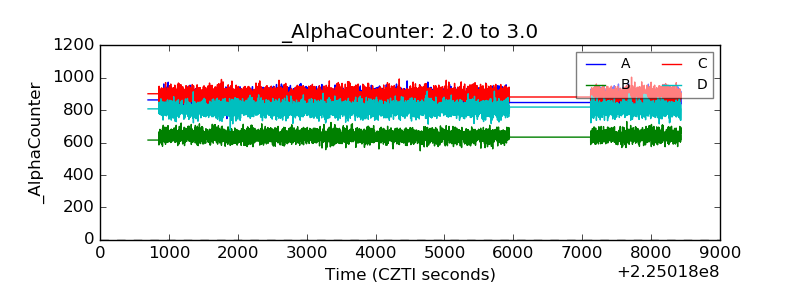 |
| _CPM_Rate | 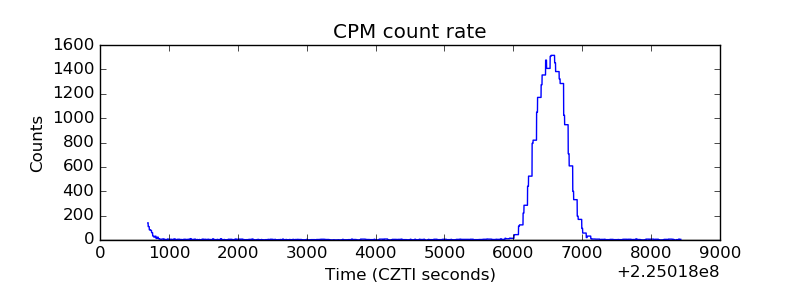 |
| CZT Counter | 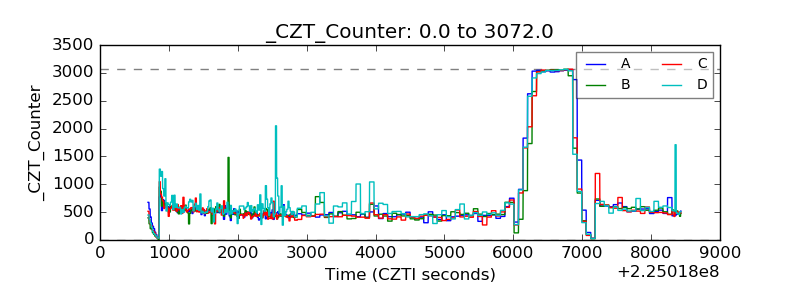 |
| +2.5 Volts monitor |  |
| +5 Volts monitor |  |
| _ROLL_ROT | 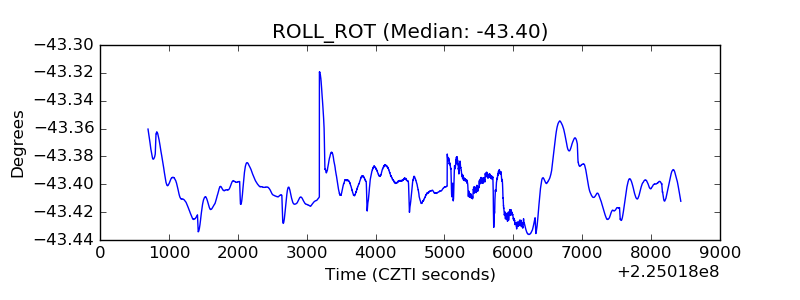 |
| _Roll_DEC | 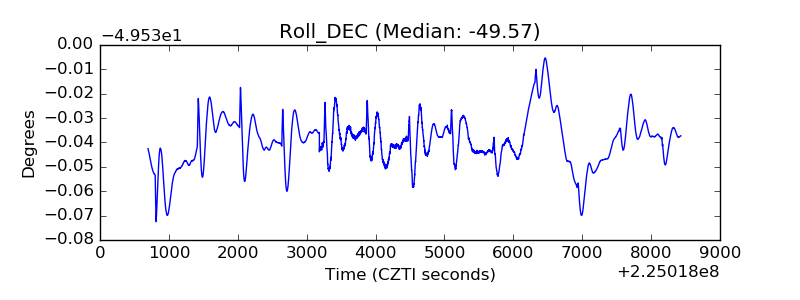 |
| _Roll_RA | 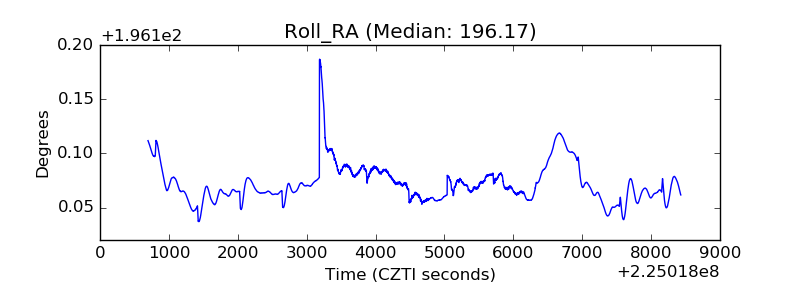 |
| Veto Counter | 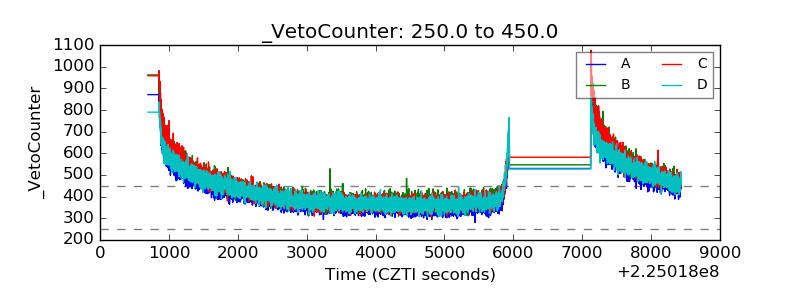 |