| Param | Original file | Final file |
|---|---|---|
| Filename | modeM0/AS1G06_076T01_9000001038_07525cztM0_level2.evt | modeM0/AS1G06_076T01_9000001038_07525cztM0_level2_quad_clean.evt |
| Size (bytes) | 494,369,280 | 70,128,000 |
| Size | 471.5 MB | 66.9 MB |
| Events in quadrant A | 3,377,688 | 421,585 |
| Events in quadrant B | 3,437,635 | 427,000 |
| Events in quadrant C | 3,572,367 | 410,142 |
| Events in quadrant D | 4,127,383 | 395,523 |
| Mode M9 | |||
|---|---|---|---|
| Quadrant | BADHDUFLAG | Total packets | Discarded packets |
| A | 0 | 12 | 0 |
| B | 0 | 12 | 0 |
| C | 0 | 12 | 0 |
| D | 0 | 12 | 0 |
| Mode M0 | |||
|---|---|---|---|
| Quadrant | BADHDUFLAG | Total packets | Discarded packets |
| A | 0 | 14375 | 3 |
| B | 0 | 14456 | 2 |
| C | 0 | 15016 | 2 |
| D | 0 | 16685 | 2 |
| Mode SS | |||
|---|---|---|---|
| Quadrant | BADHDUFLAG | Total packets | Discarded packets |
| A | 0 | 136 | 0 |
| B | 0 | 136 | 0 |
| C | 0 | 136 | 0 |
| D | 0 | 136 | 0 |
| Quadrant | Total seconds | Saturated seconds | Saturation percentage |
|---|---|---|---|
| A | 6731 | 119 | 1.767939% |
| B | 6731 | 128 | 1.901649% |
| C | 6731 | 126 | 1.871936% |
| D | 6732 | 208 | 3.089721% |
Noise dominated data is calculated using 1-second bins in cleaned event files. If a bin has >2000 counts, and if more than 50% of those come from <1% of pixels, then it is considered to be noise-dominated and hence unusable.
| Quadrant | # 1 sec bins | Bins with >0 counts | Bins with >2000 counts | High rate bins dominated by noise | Noise dominated (total time) | Noise dominated (detector-on time) | Marked lightcurve |
|---|---|---|---|---|---|---|---|
| A | 7941 | 6731 | 0 | 0 | 0.00% | 0.00% | 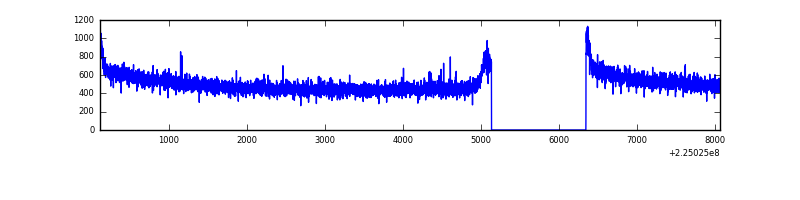 |
| B | 7941 | 6731 | 0 | 0 | 0.00% | 0.00% | 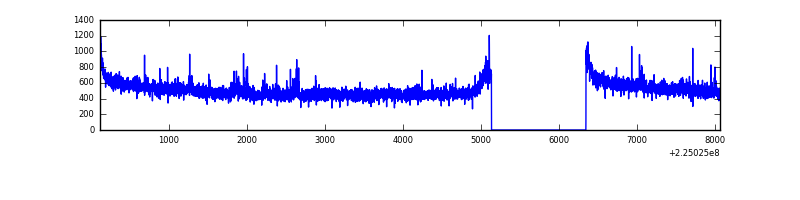 |
| C | 7941 | 6731 | 14 | 14 | 0.18% | 0.21% | 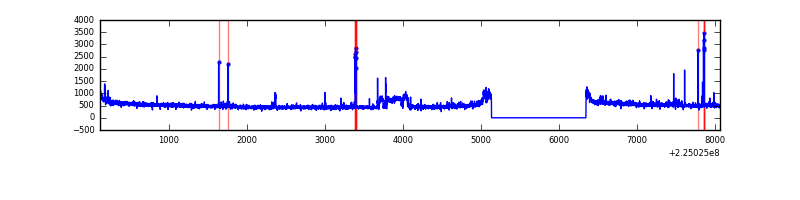 |
| D | 7942 | 6732 | 80 | 80 | 1.01% | 1.19% | 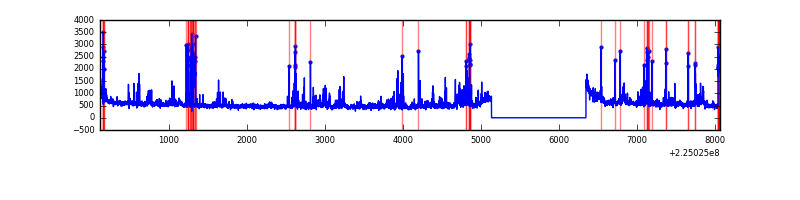 |
Top three noisy pixels from each quadrant. If the there are fewer than three noisy pixels in the level2.evt file, extra rows are filled as -1
| Pixel properties | Quadrant properties | ||||||
|---|---|---|---|---|---|---|---|
| Quadrant | DetID | PixID | Counts | Sigma | Mean | Median | Sigma |
| A | 13 | 14 | 14220 | 76.55 | 874 | 856 | 174.6 |
| A | 0 | 226 | 8403 | 43.23 | 874 | 856 | 174.6 |
| A | 12 | 194 | 7653 | 38.94 | 874 | 856 | 174.6 |
| B | 0 | 214 | 26794 | 159.1 | 874 | 854 | 163.0 |
| B | 12 | 111 | 15824 | 91.82 | 874 | 854 | 163.0 |
| B | 0 | 213 | 15436 | 89.44 | 874 | 854 | 163.0 |
| C | 9 | 68 | 199291 | 1034.31 | 839 | 845 | 191.9 |
| C | 8 | 229 | 54099 | 277.56 | 839 | 845 | 191.9 |
| C | 1 | 16 | 35812 | 182.25 | 839 | 845 | 191.9 |
| D | 2 | 152 | 288256 | 1416.27 | 840 | 813 | 203.0 |
| D | 12 | 221 | 195114 | 957.35 | 840 | 813 | 203.0 |
| D | 2 | 14 | 114135 | 558.35 | 840 | 813 | 203.0 |
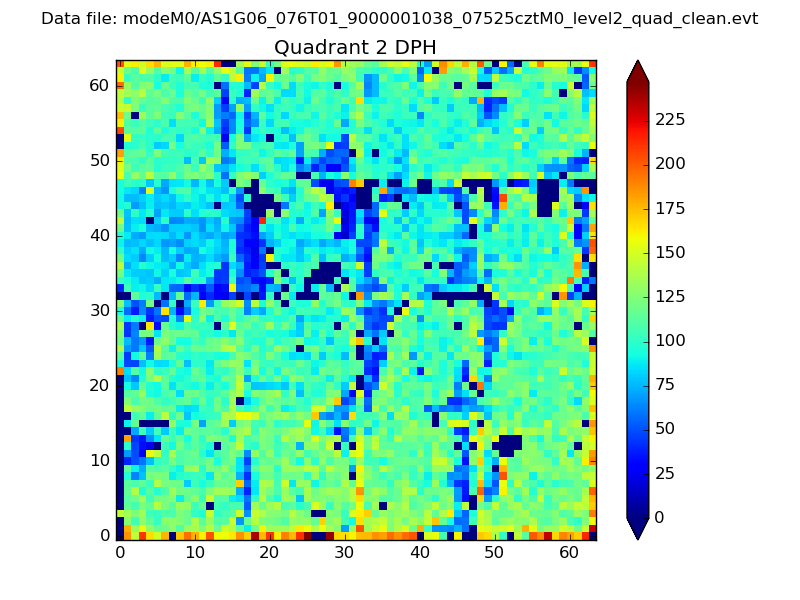
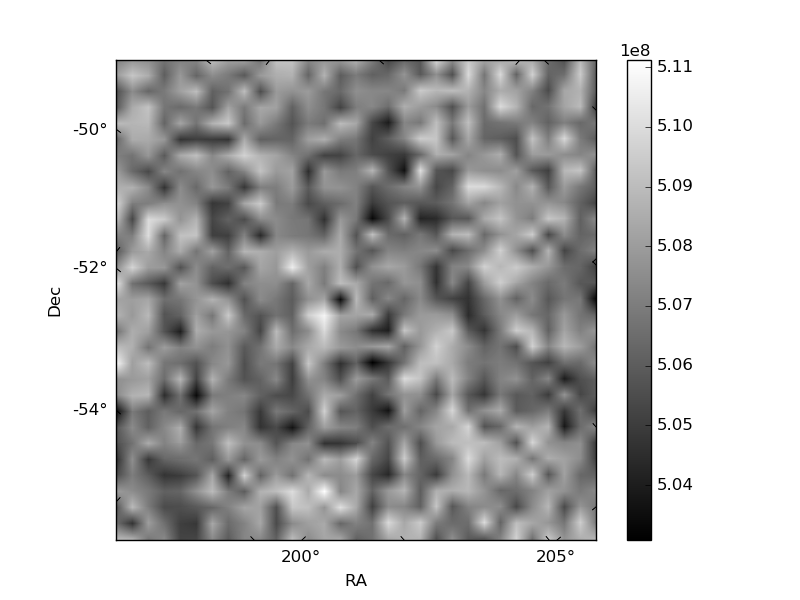
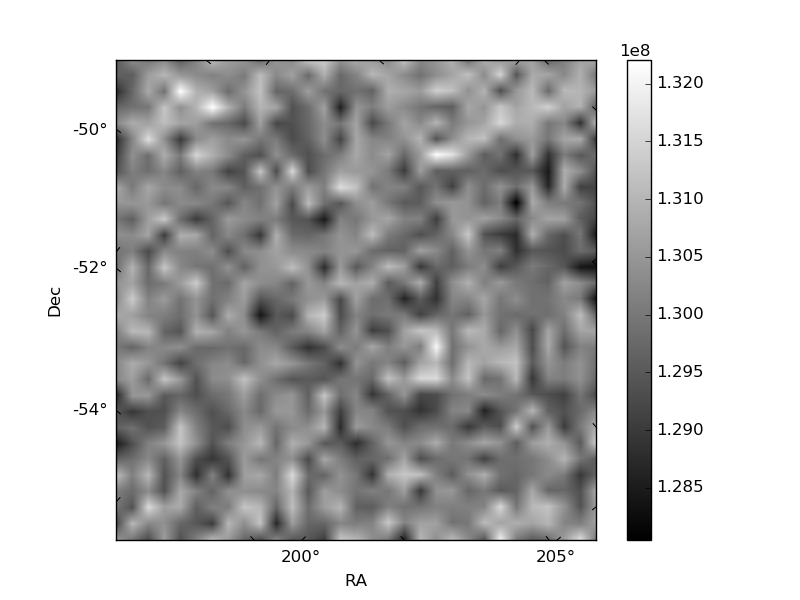
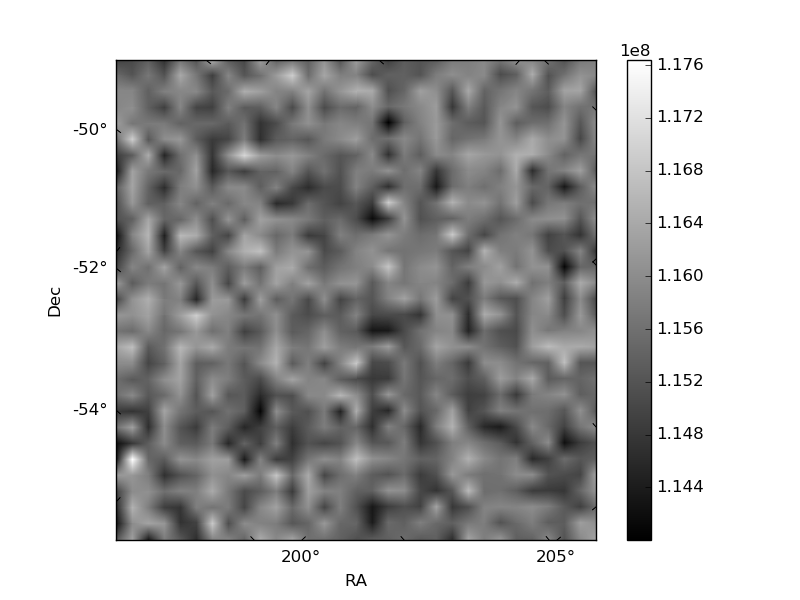
Histogram calculated using DETX and DETY for each event in the final _common_clean file
| Quadrant A | 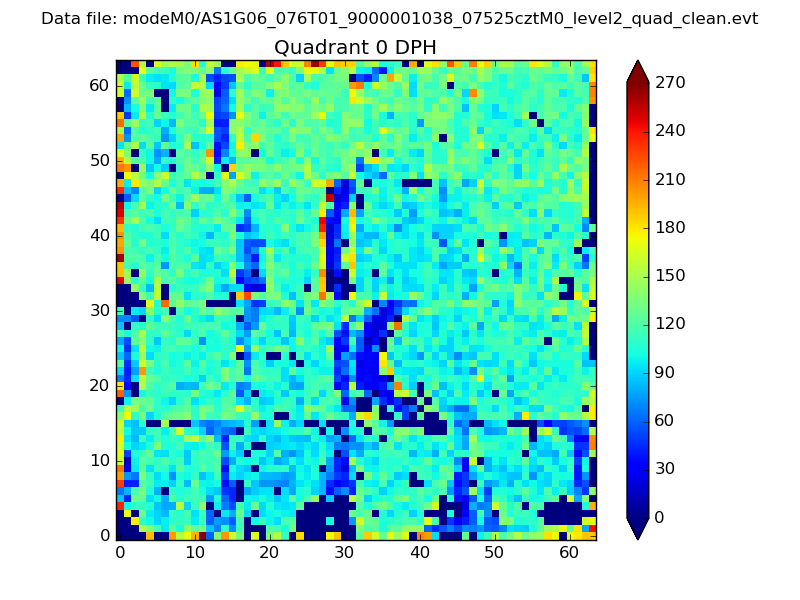 |
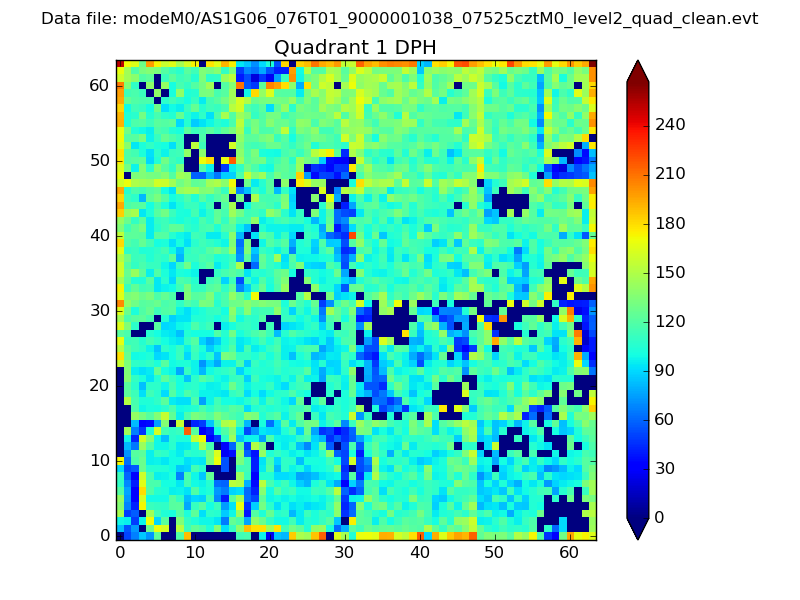 |
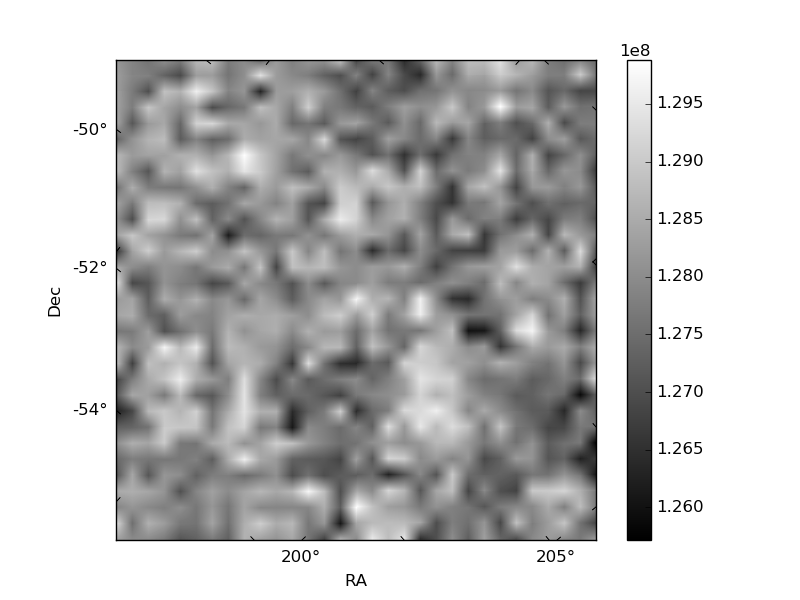
Quadrant B |
|---|---|---|---|
| Quadrant D | 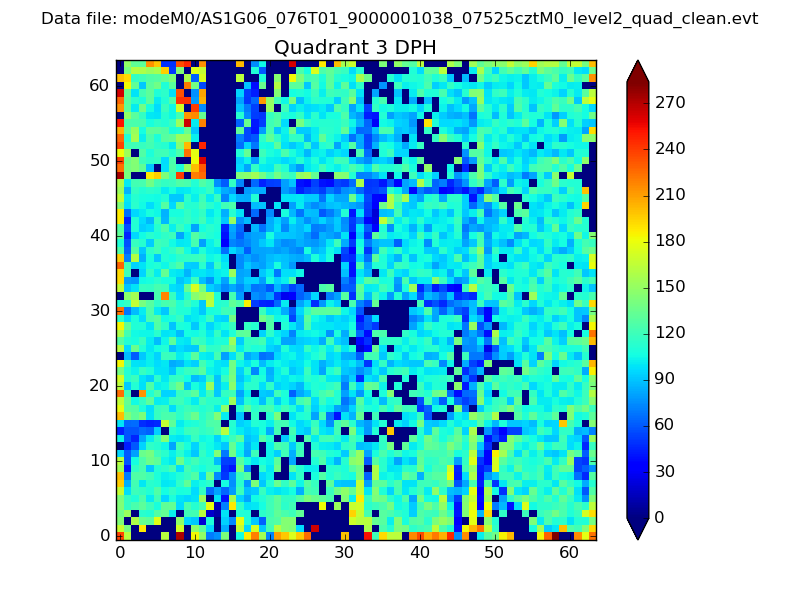 |
 |
Quadrant C |
| Plot type | Count rate plots | Images |
|---|---|---|
| Comparison with Poisson distribution Blue bars denote a histogram of data divided into 1 sec bins. Red curve is a Poisson curve with rate = median count rate of data. |
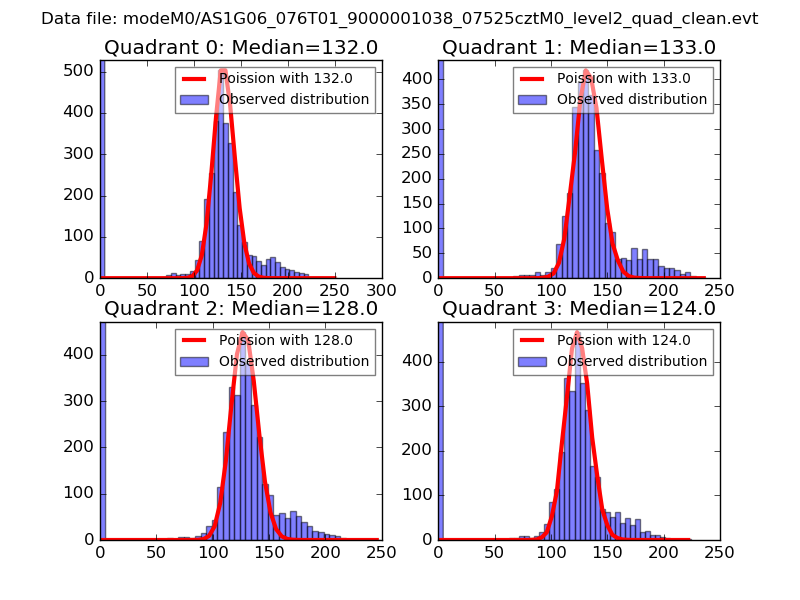 |
 |
| Quadrant-wise count rates Data is divided into 100 sec bins |
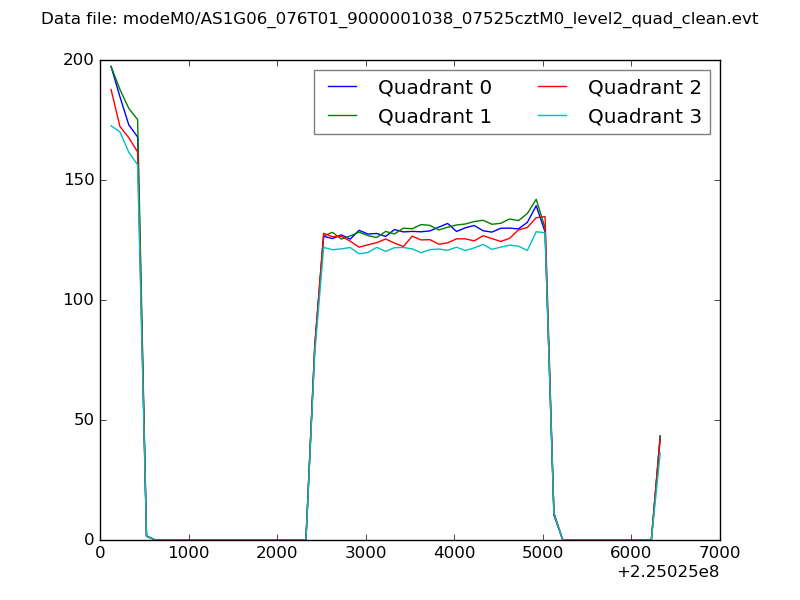 |
|
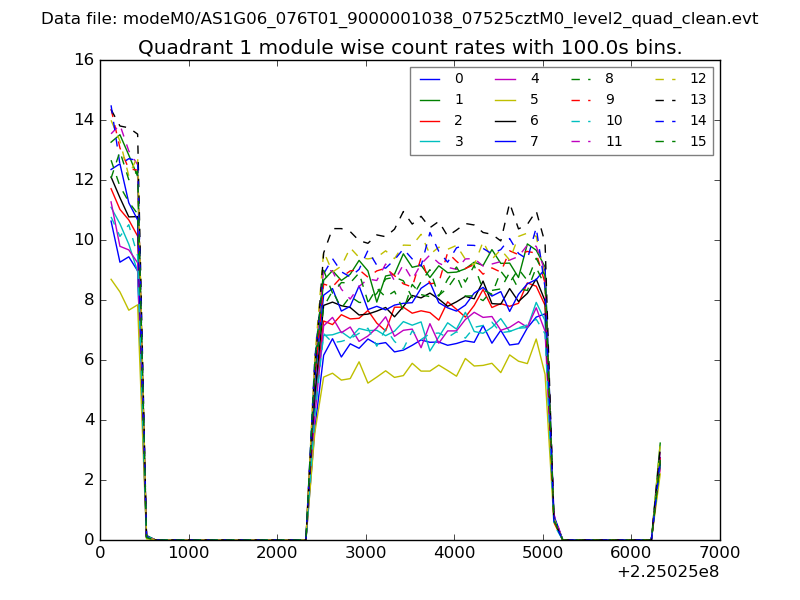
| Module-wise count rates for Quadrant A Data is divided into 100 sec bins |
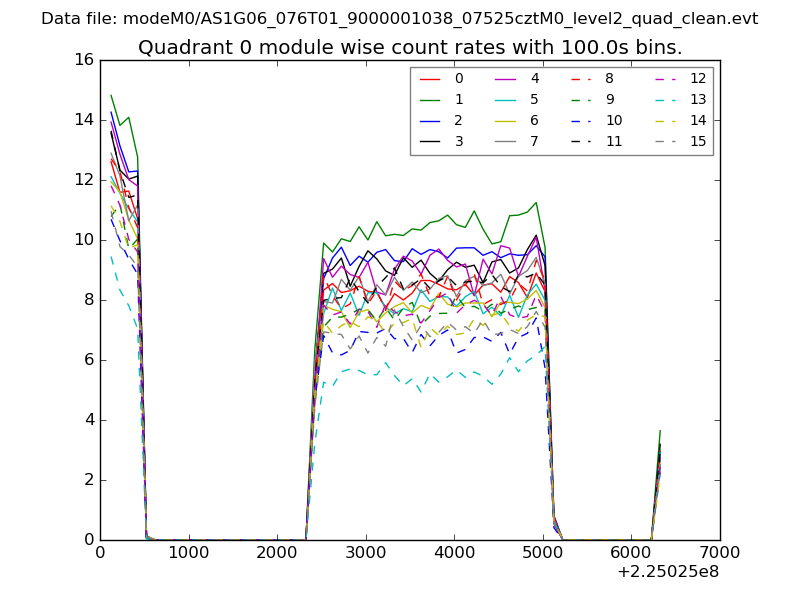 |
 |
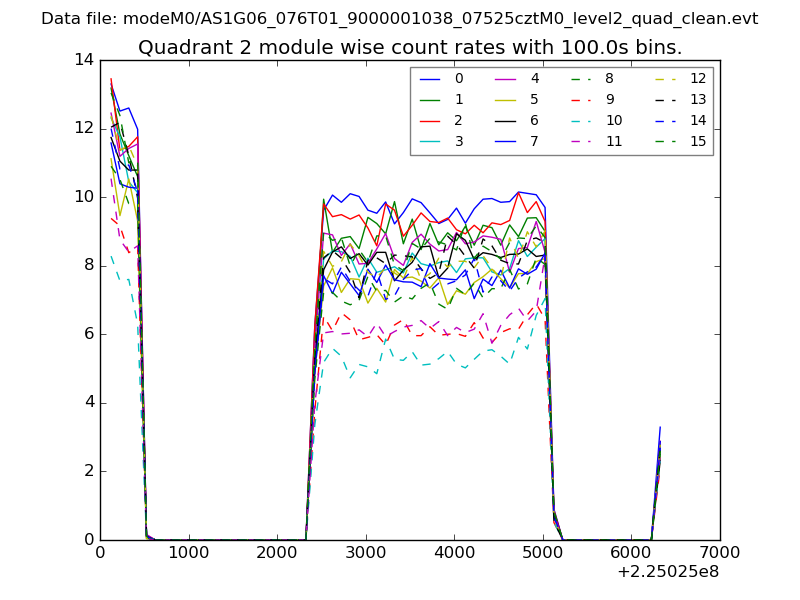
| Module-wise count rates for Quadrant B Data is divided into 100 sec bins |
 |
 |
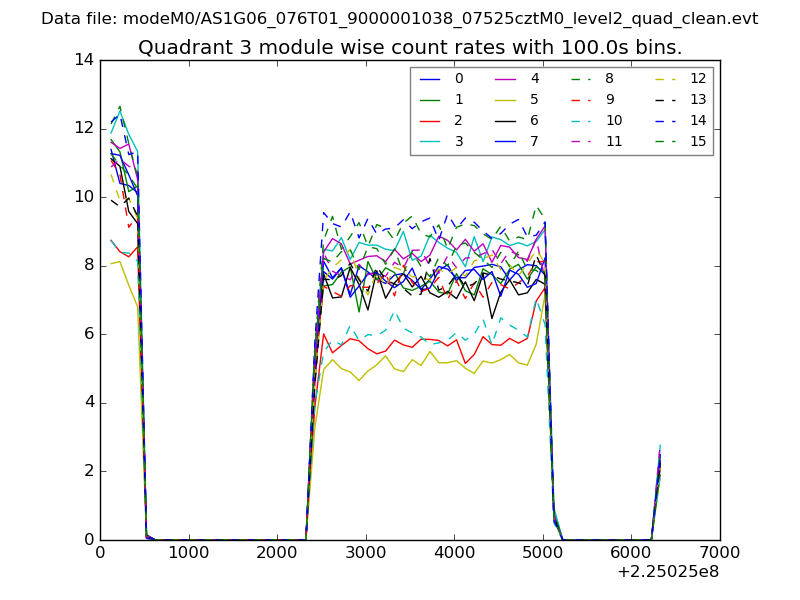
| Module-wise count rates for Quadrant C Data is divided into 100 sec bins |
 |
 |
| Module-wise count rates for Quadrant D Data is divided into 100 sec bins |
 |
 |
| Parameter | Plot |
|---|---|
| CZT HV Monitor | 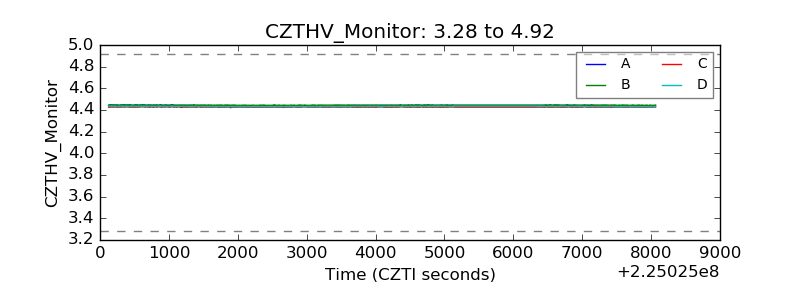 |
| D_VDD | 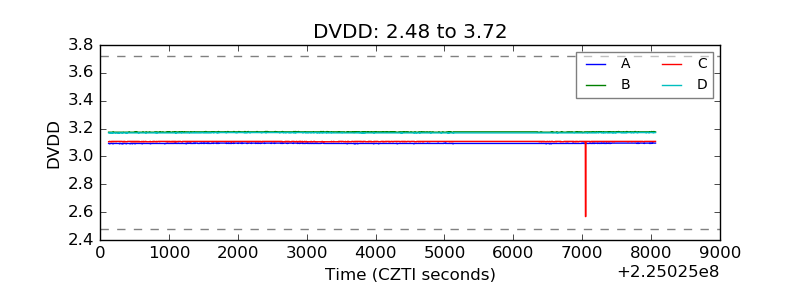 |
| Temperature 1 | 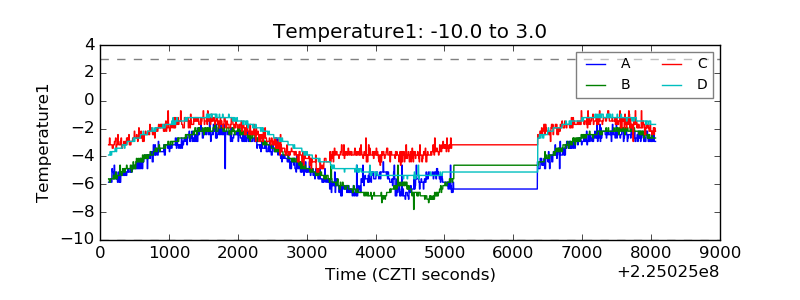 |
| Veto HV Monitor | 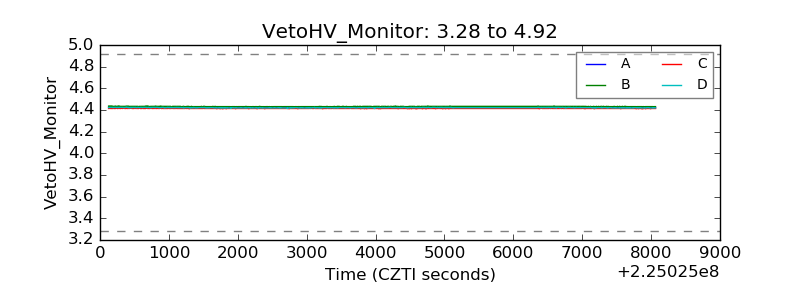 |
| Veto LLD | 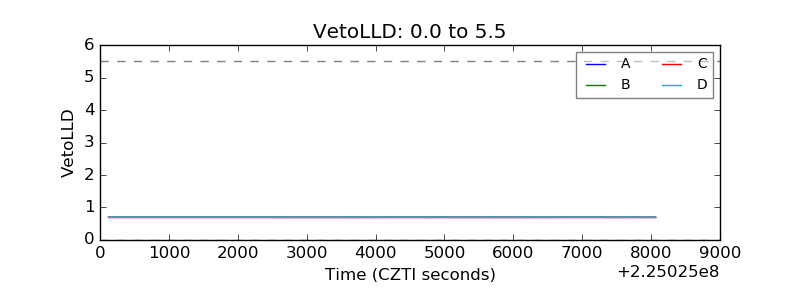 |
| Alpha Counter | 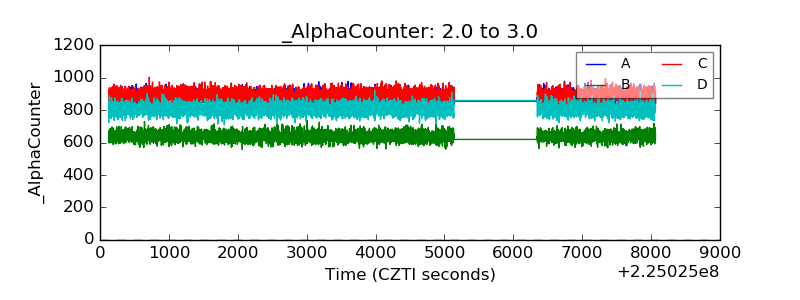 |
| _CPM_Rate | 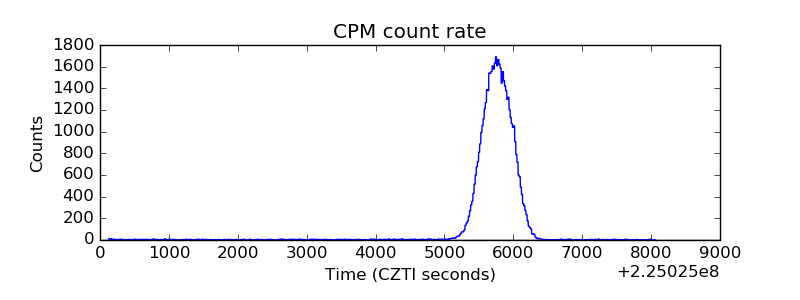 |
| CZT Counter | 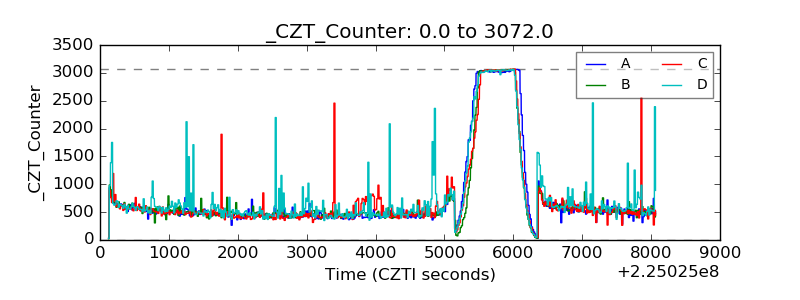 |
| +2.5 Volts monitor |  |
| +5 Volts monitor | 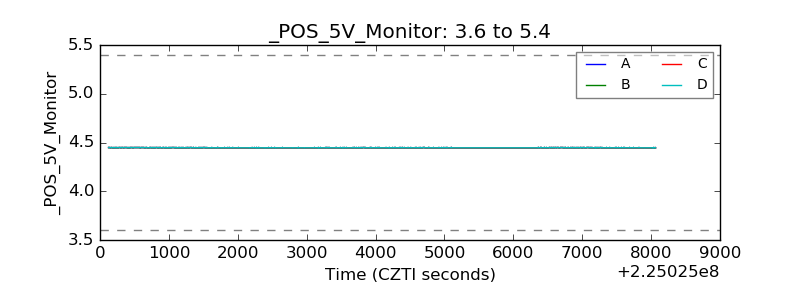 |
| _ROLL_ROT |  |
| _Roll_DEC | 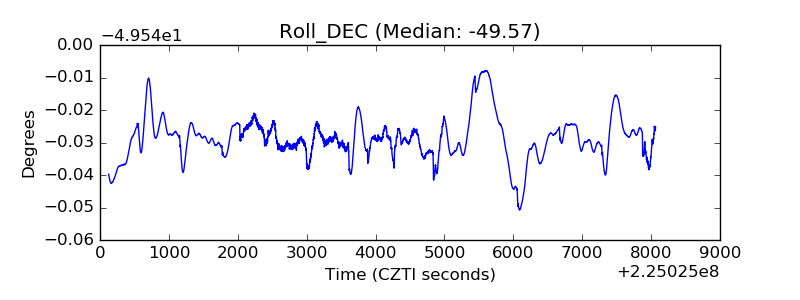 |
| _Roll_RA | 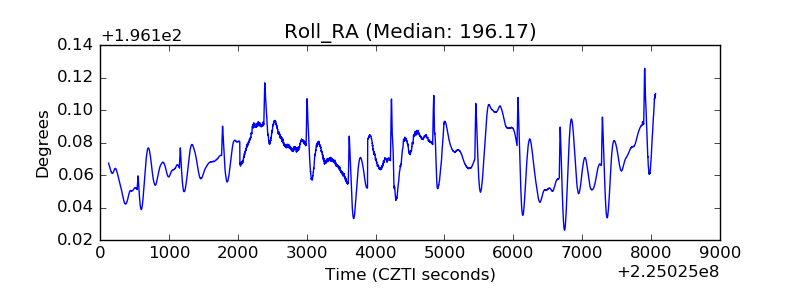 |
| Veto Counter | 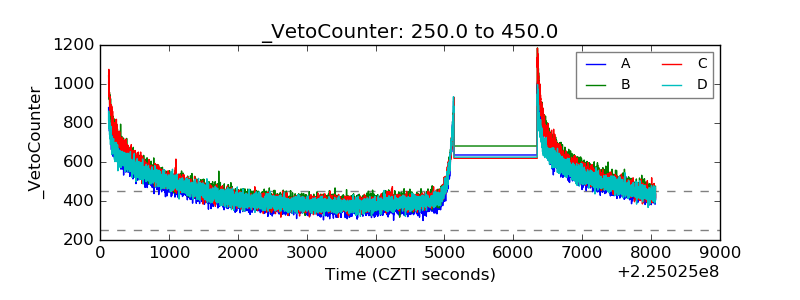 |