| Param | Original file | Final file |
|---|---|---|
| Filename | modeM0/AS1G06_076T01_9000001038_07526cztM0_level2.evt | modeM0/AS1G06_076T01_9000001038_07526cztM0_level2_quad_clean.evt |
| Size (bytes) | 478,028,160 | 68,397,120 |
| Size | 455.9 MB | 65.2 MB |
| Events in quadrant A | 3,264,863 | 411,068 |
| Events in quadrant B | 3,313,508 | 418,498 |
| Events in quadrant C | 3,272,220 | 403,216 |
| Events in quadrant D | 4,183,878 | 383,610 |
| Mode M9 | |||
|---|---|---|---|
| Quadrant | BADHDUFLAG | Total packets | Discarded packets |
| A | 0 | 13 | 0 |
| B | 0 | 13 | 0 |
| C | 0 | 13 | 0 |
| D | 0 | 13 | 0 |
| Mode M0 | |||
|---|---|---|---|
| Quadrant | BADHDUFLAG | Total packets | Discarded packets |
| A | 0 | 13833 | 2 |
| B | 0 | 13902 | 1 |
| C | 0 | 13893 | 1 |
| D | 0 | 16842 | 1 |
| Mode SS | |||
|---|---|---|---|
| Quadrant | BADHDUFLAG | Total packets | Discarded packets |
| A | 0 | 132 | 0 |
| B | 0 | 132 | 0 |
| C | 0 | 132 | 0 |
| D | 0 | 132 | 0 |
| Quadrant | Total seconds | Saturated seconds | Saturation percentage |
|---|---|---|---|
| A | 6515 | 125 | 1.918649% |
| B | 6515 | 124 | 1.903300% |
| C | 6515 | 110 | 1.688411% |
| D | 6515 | 302 | 4.635457% |
Noise dominated data is calculated using 1-second bins in cleaned event files. If a bin has >2000 counts, and if more than 50% of those come from <1% of pixels, then it is considered to be noise-dominated and hence unusable.
| Quadrant | # 1 sec bins | Bins with >0 counts | Bins with >2000 counts | High rate bins dominated by noise | Noise dominated (total time) | Noise dominated (detector-on time) | Marked lightcurve |
|---|---|---|---|---|---|---|---|
| A | 7770 | 6515 | 2 | 2 | 0.03% | 0.03% | 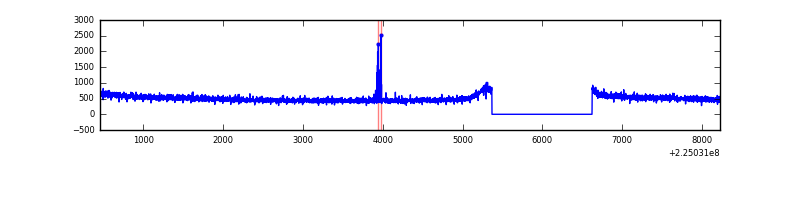 |
| B | 7770 | 6515 | 0 | 0 | 0.00% | 0.00% | 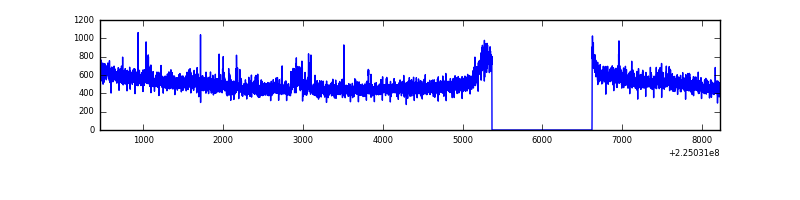 |
| C | 7770 | 6515 | 6 | 6 | 0.08% | 0.09% | 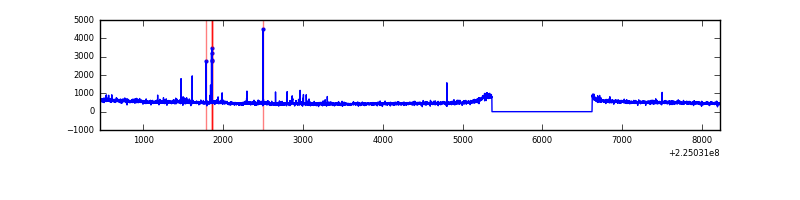 |
| D | 7770 | 6515 | 183 | 183 | 2.36% | 2.81% | 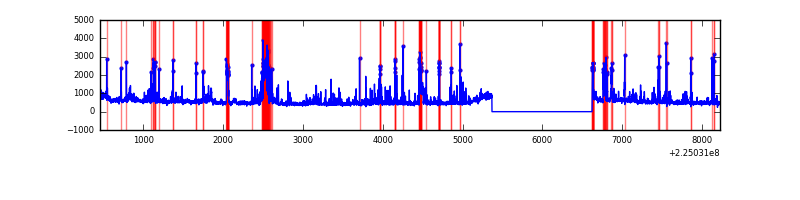 |
Top three noisy pixels from each quadrant. If the there are fewer than three noisy pixels in the level2.evt file, extra rows are filled as -1
| Pixel properties | Quadrant properties | ||||||
|---|---|---|---|---|---|---|---|
| Quadrant | DetID | PixID | Counts | Sigma | Mean | Median | Sigma |
| A | 13 | 248 | 22663 | 130.13 | 839 | 820 | 167.8 |
| A | 13 | 14 | 11693 | 64.78 | 839 | 820 | 167.8 |
| A | 0 | 226 | 8090 | 43.31 | 839 | 820 | 167.8 |
| B | 10 | 245 | 29285 | 182.68 | 842 | 824 | 155.8 |
| B | 0 | 214 | 21272 | 131.25 | 842 | 824 | 155.8 |
| B | 12 | 111 | 15045 | 91.28 | 842 | 824 | 155.8 |
| C | 9 | 68 | 48356 | 259.81 | 805 | 811 | 183.0 |
| C | 1 | 16 | 45690 | 245.25 | 805 | 811 | 183.0 |
| C | 8 | 229 | 36245 | 193.63 | 805 | 811 | 183.0 |
| D | 2 | 152 | 521531 | 2677.58 | 804 | 780 | 194.5 |
| D | 2 | 244 | 239562 | 1227.76 | 804 | 780 | 194.5 |
| D | 12 | 221 | 93263 | 475.52 | 804 | 780 | 194.5 |
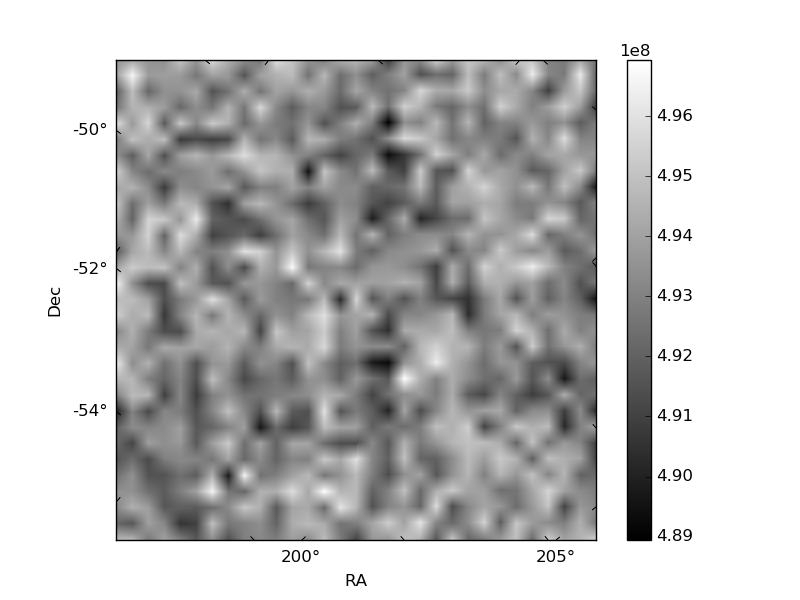
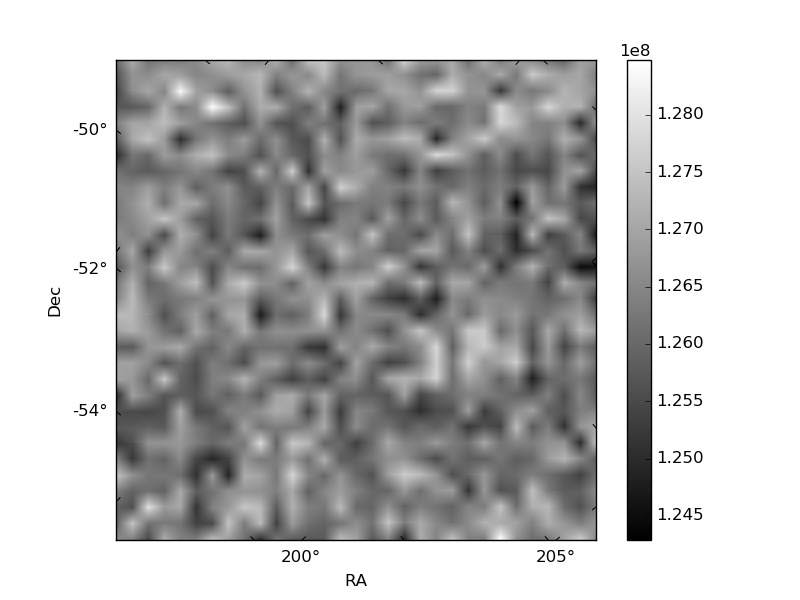
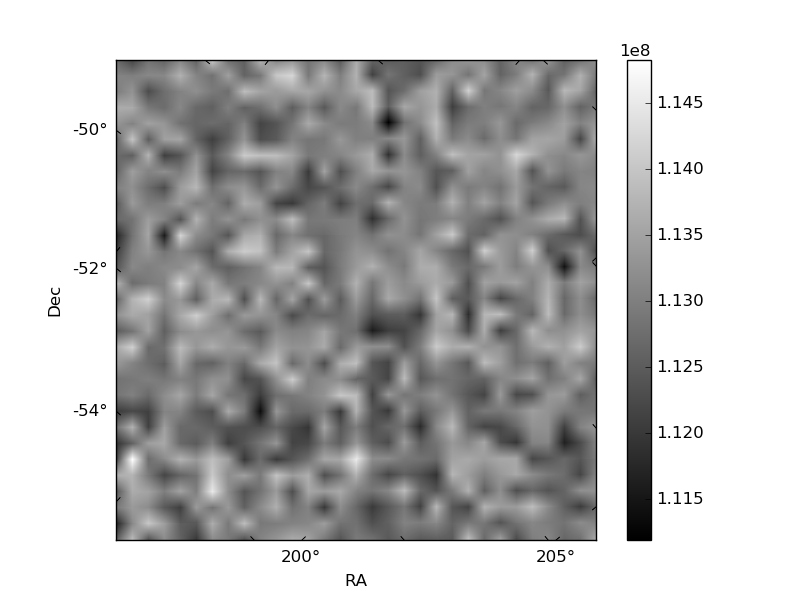
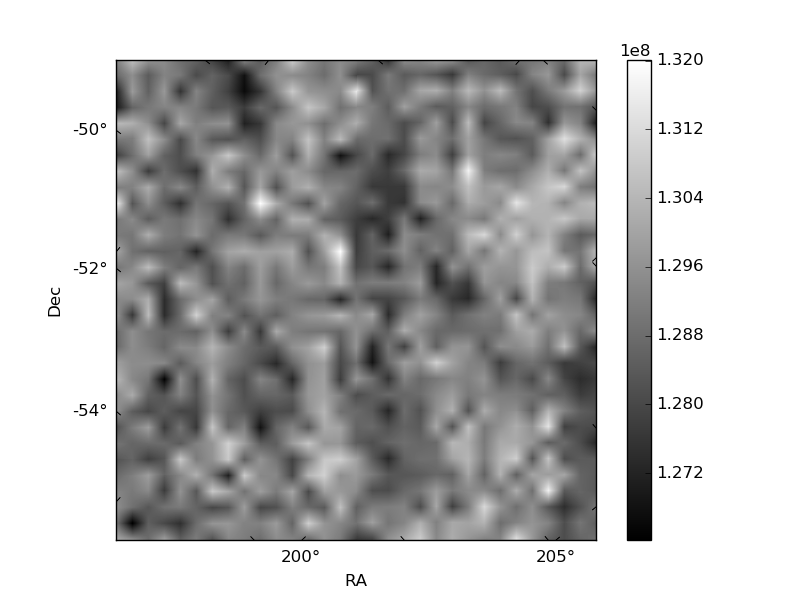
Histogram calculated using DETX and DETY for each event in the final _common_clean file
| Quadrant A | 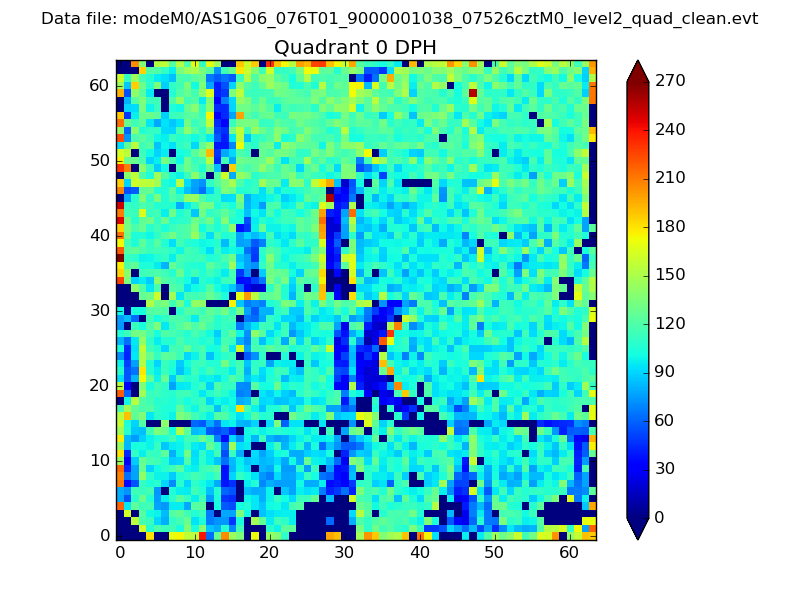 |
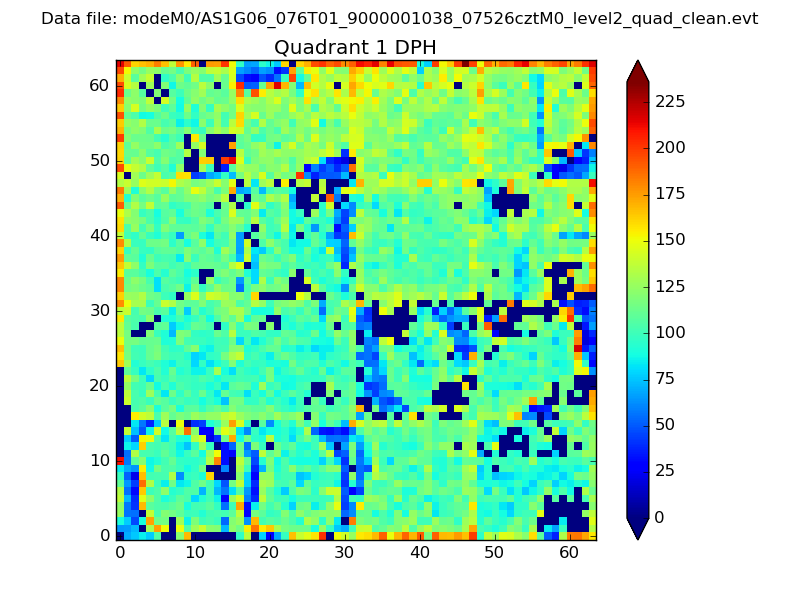 |
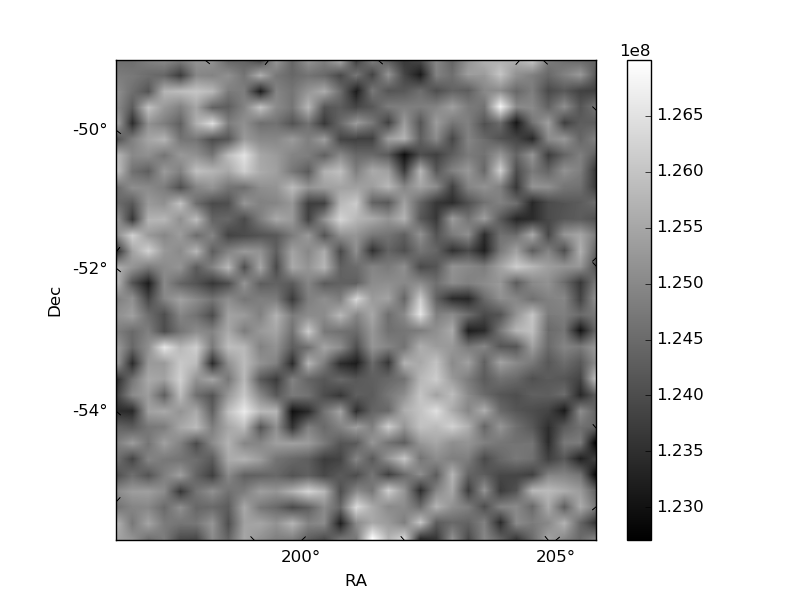
Quadrant B |
|---|---|---|---|
| Quadrant D | 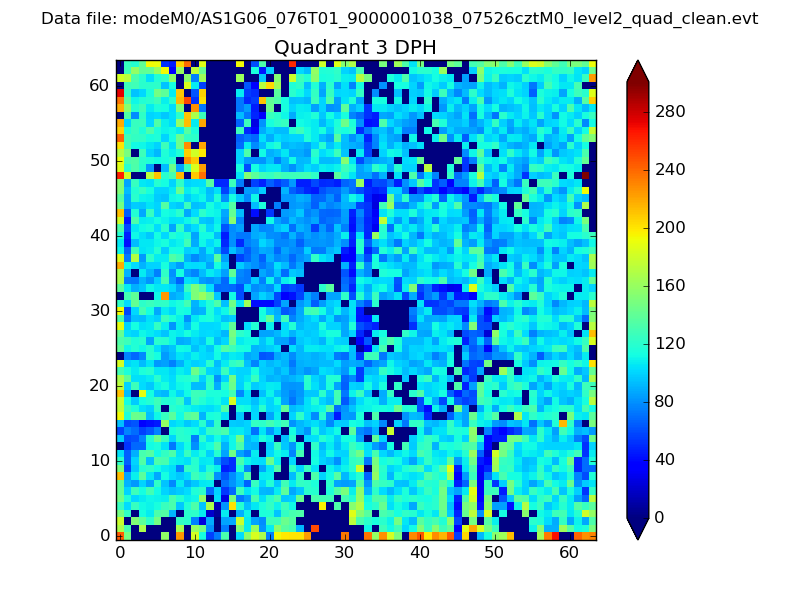 |
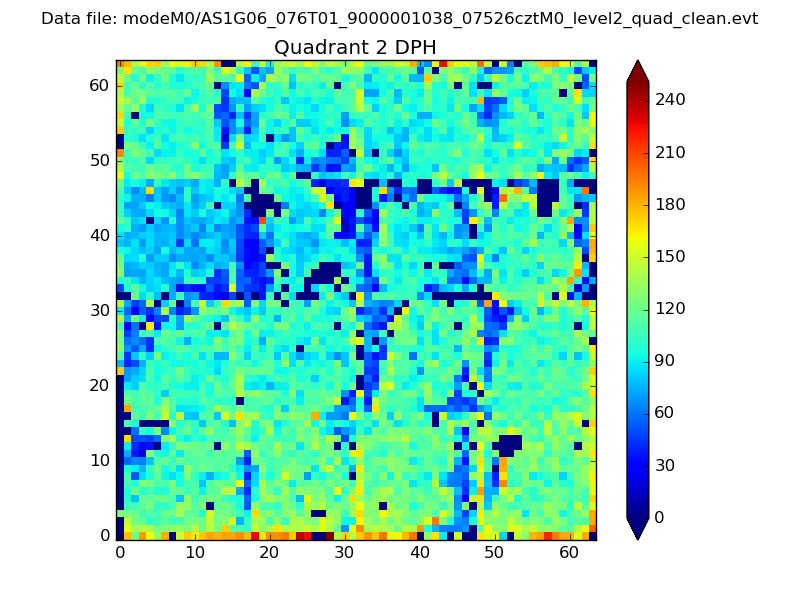 |
Quadrant C |
| Plot type | Count rate plots | Images |
|---|---|---|
| Comparison with Poisson distribution Blue bars denote a histogram of data divided into 1 sec bins. Red curve is a Poisson curve with rate = median count rate of data. |
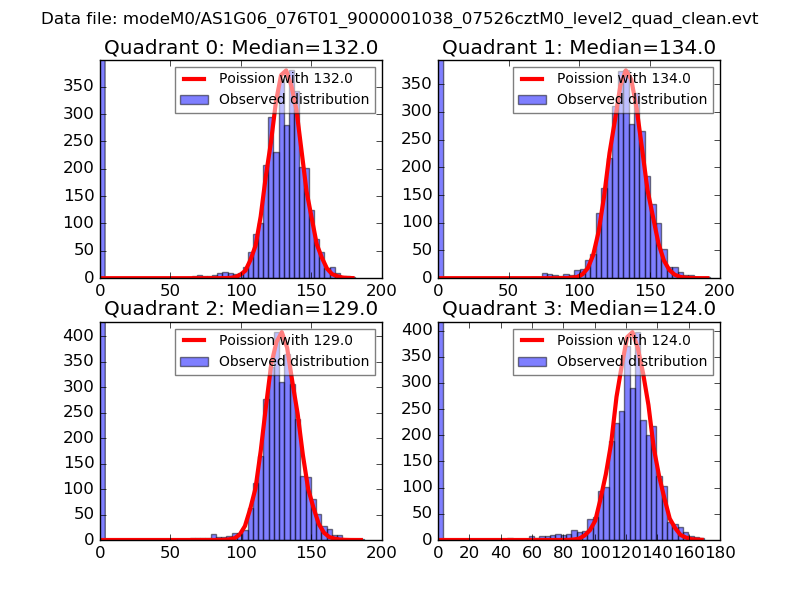 |
 |
| Quadrant-wise count rates Data is divided into 100 sec bins |
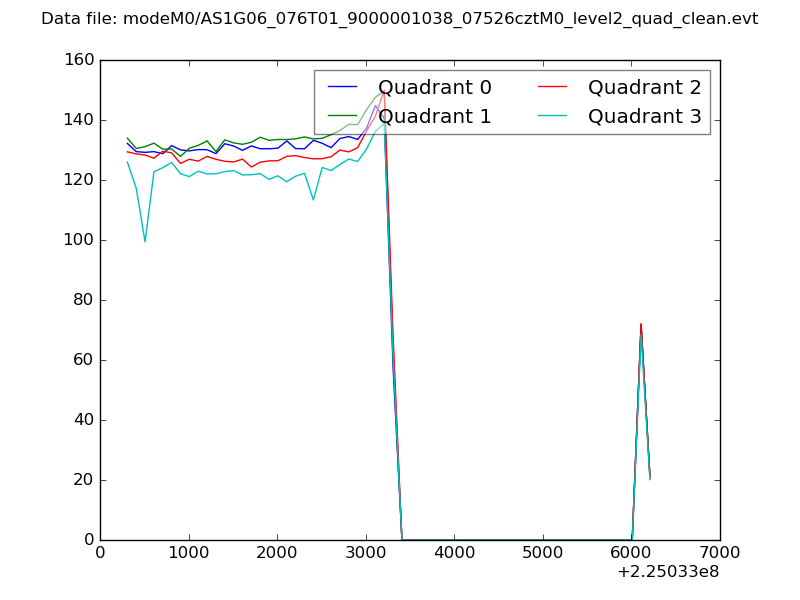 |
|
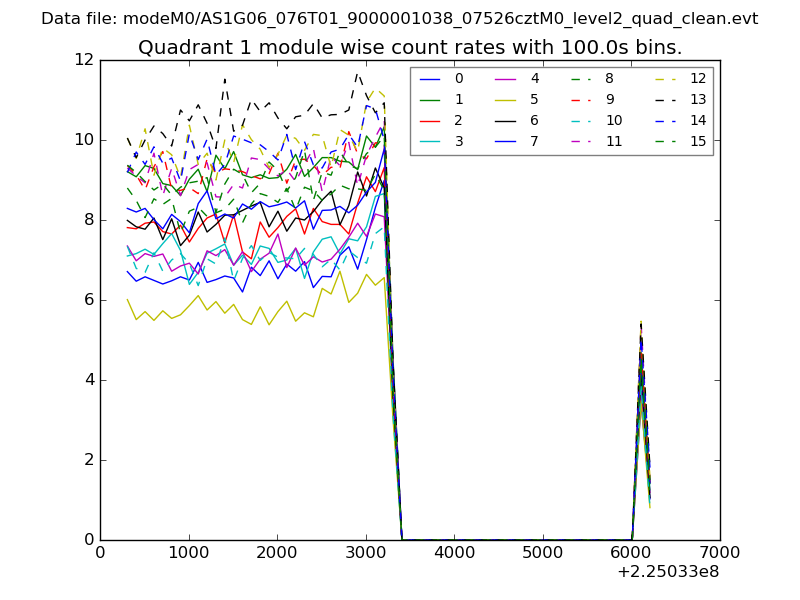
| Module-wise count rates for Quadrant A Data is divided into 100 sec bins |
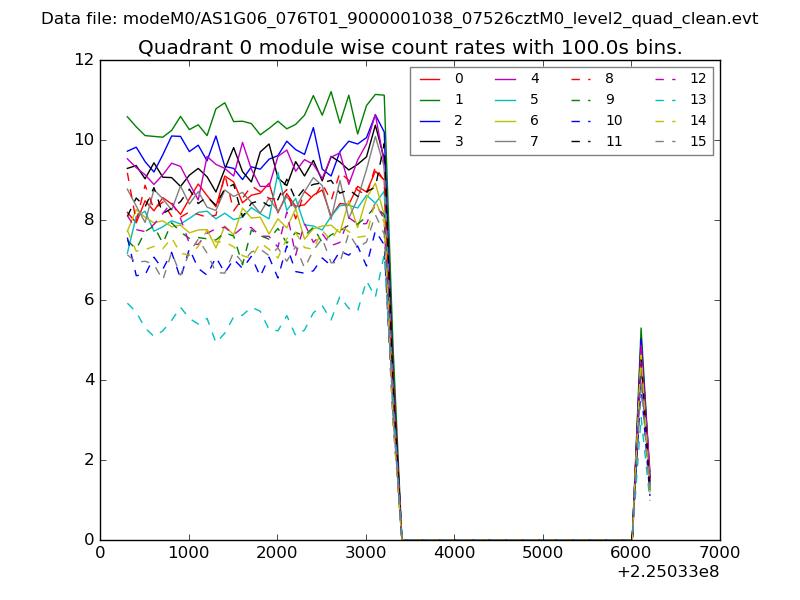 |
 |
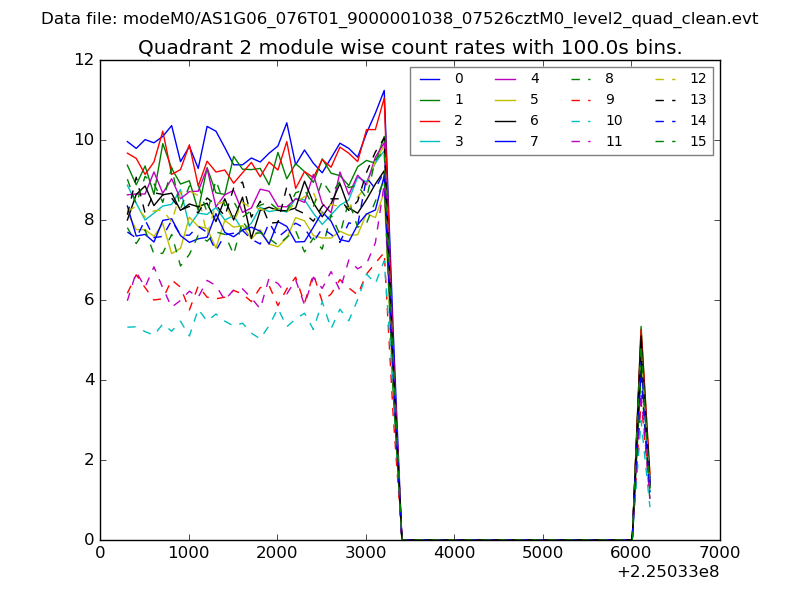
| Module-wise count rates for Quadrant B Data is divided into 100 sec bins |
 |
 |
| Module-wise count rates for Quadrant C Data is divided into 100 sec bins |
 |
 |
| Module-wise count rates for Quadrant D Data is divided into 100 sec bins |
 |
 |
| Parameter | Plot |
|---|---|
| CZT HV Monitor | 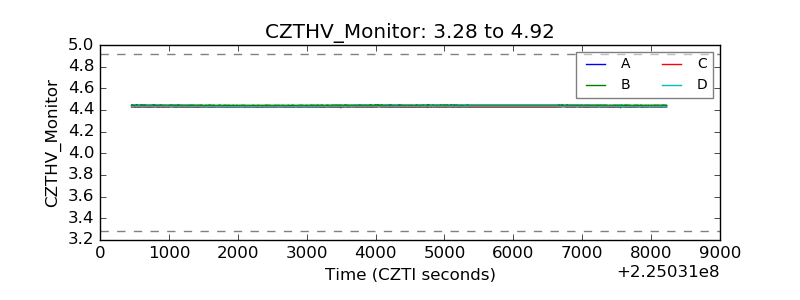 |
| D_VDD | 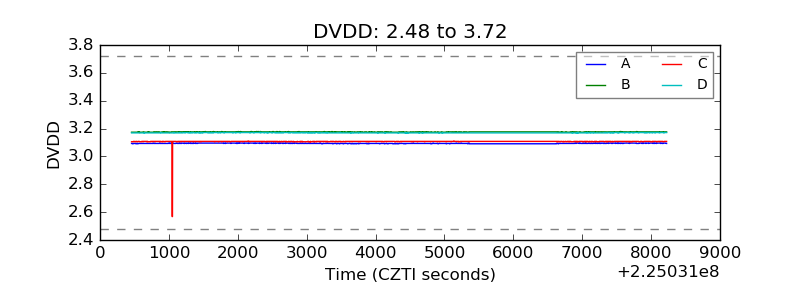 |
| Temperature 1 |  |
| Veto HV Monitor | 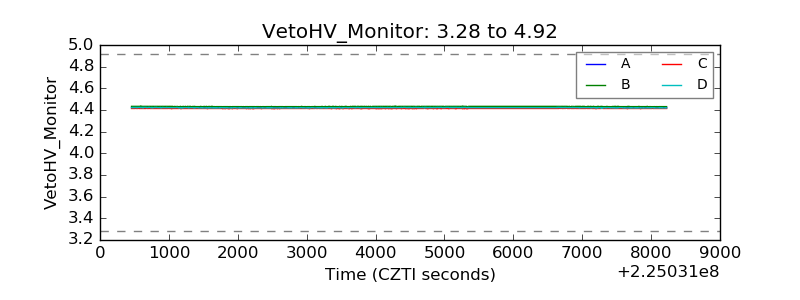 |
| Veto LLD | 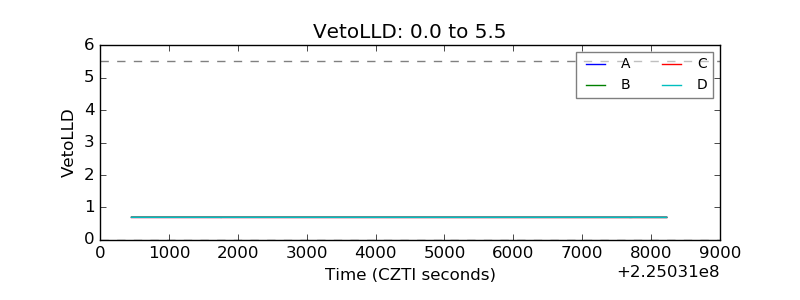 |
| Alpha Counter | 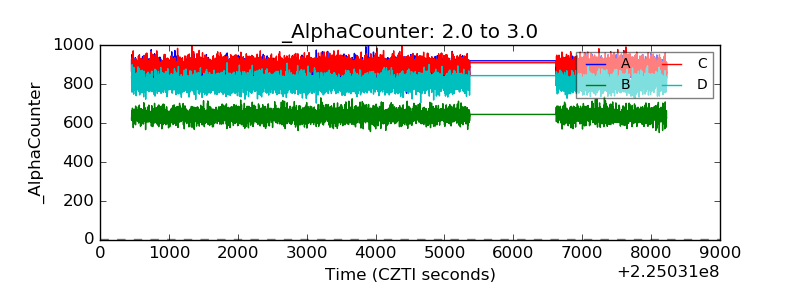 |
| _CPM_Rate | 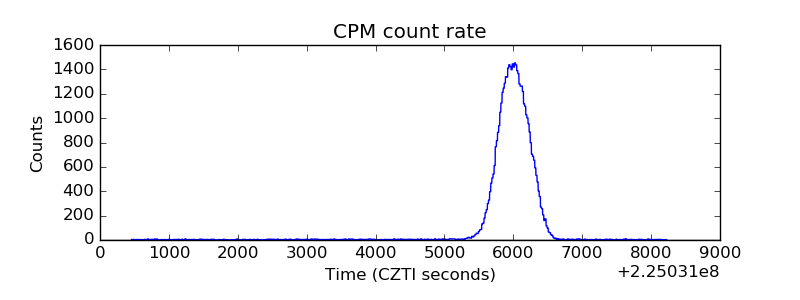 |
| CZT Counter | 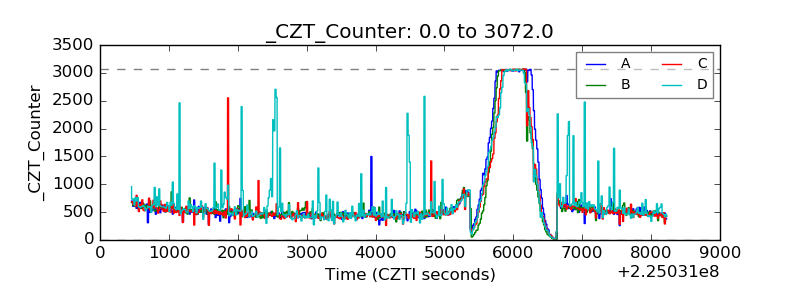 |
| +2.5 Volts monitor |  |
| +5 Volts monitor |  |
| _ROLL_ROT |  |
| _Roll_DEC | 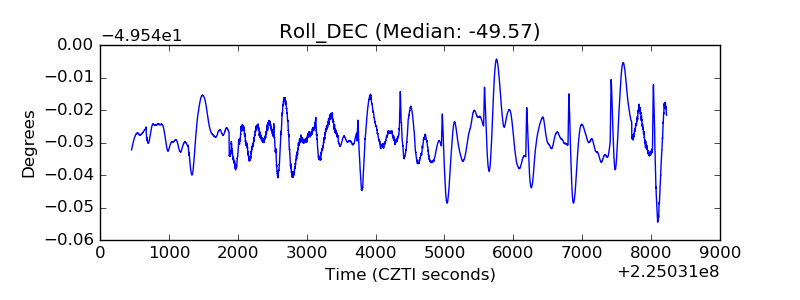 |
| _Roll_RA | 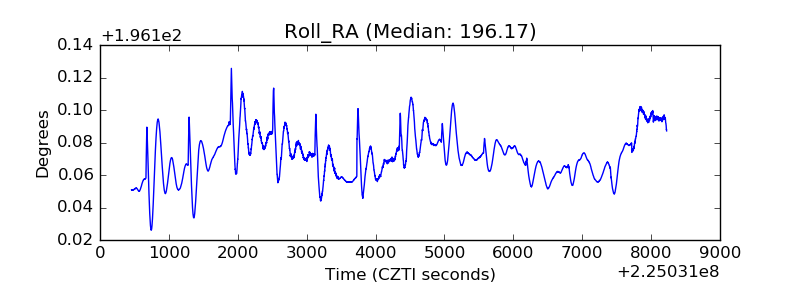 |
| Veto Counter |  |