| Param | Original file | Final file |
|---|---|---|
| Filename | modeM0/AS1G06_076T01_9000001038_07528cztM0_level2.evt | modeM0/AS1G06_076T01_9000001038_07528cztM0_level2_quad_clean.evt |
| Size (bytes) | 445,017,600 | 88,873,920 |
| Size | 424.4 MB | 84.8 MB |
| Events in quadrant A | 3,071,615 | 567,758 |
| Events in quadrant B | 3,143,717 | 580,364 |
| Events in quadrant C | 3,013,126 | 558,684 |
| Events in quadrant D | 3,806,098 | 530,200 |
| Mode M9 | |||
|---|---|---|---|
| Quadrant | BADHDUFLAG | Total packets | Discarded packets |
| A | 0 | 15 | 0 |
| B | 0 | 15 | 0 |
| C | 0 | 15 | 0 |
| D | 0 | 16 | 0 |
| Mode M0 | |||
|---|---|---|---|
| Quadrant | BADHDUFLAG | Total packets | Discarded packets |
| A | 0 | 13413 | 3 |
| B | 0 | 13577 | 2 |
| C | 0 | 13436 | 2 |
| D | 0 | 15870 | 2 |
| Mode SS | |||
|---|---|---|---|
| Quadrant | BADHDUFLAG | Total packets | Discarded packets |
| A | 0 | 132 | 0 |
| B | 0 | 132 | 0 |
| C | 0 | 132 | 0 |
| D | 0 | 132 | 0 |
| Quadrant | Total seconds | Saturated seconds | Saturation percentage |
|---|---|---|---|
| A | 6515 | 71 | 1.089793% |
| B | 6515 | 84 | 1.289332% |
| C | 6515 | 43 | 0.660015% |
| D | 6515 | 216 | 3.315426% |
Noise dominated data is calculated using 1-second bins in cleaned event files. If a bin has >2000 counts, and if more than 50% of those come from <1% of pixels, then it is considered to be noise-dominated and hence unusable.
| Quadrant | # 1 sec bins | Bins with >0 counts | Bins with >2000 counts | High rate bins dominated by noise | Noise dominated (total time) | Noise dominated (detector-on time) | Marked lightcurve |
|---|---|---|---|---|---|---|---|
| A | 7595 | 6516 | 0 | 0 | 0.00% | 0.00% | 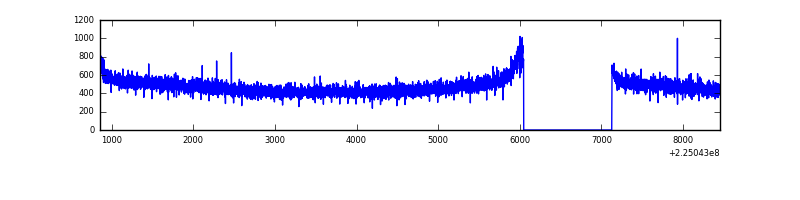 |
| B | 7595 | 6515 | 1 | 1 | 0.01% | 0.02% | 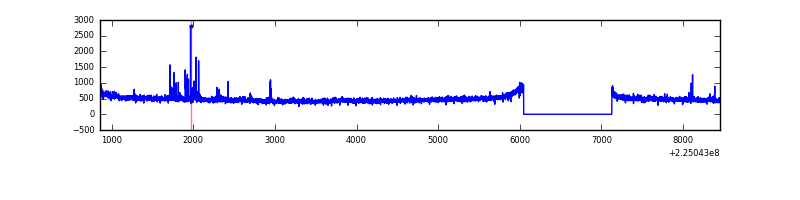 |
| C | 7595 | 6515 | 0 | 0 | 0.00% | 0.00% | 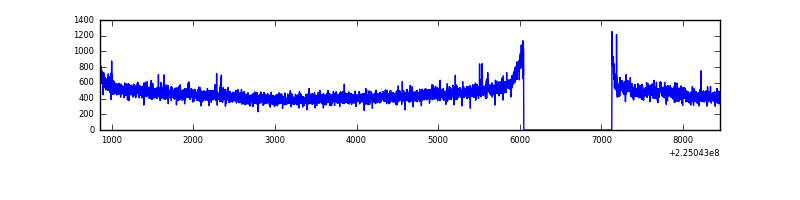 |
| D | 7595 | 6515 | 144 | 144 | 1.90% | 2.21% | 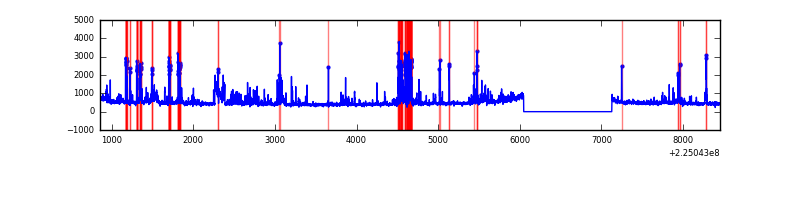 |
Top three noisy pixels from each quadrant. If the there are fewer than three noisy pixels in the level2.evt file, extra rows are filled as -1
| Pixel properties | Quadrant properties | ||||||
|---|---|---|---|---|---|---|---|
| Quadrant | DetID | PixID | Counts | Sigma | Mean | Median | Sigma |
| A | 13 | 14 | 43469 | 269.95 | 787 | 771 | 158.2 |
| A | 0 | 226 | 7700 | 43.81 | 787 | 771 | 158.2 |
| A | 12 | 194 | 6943 | 39.02 | 787 | 771 | 158.2 |
| B | 0 | 213 | 40475 | 265.56 | 794 | 774 | 149.5 |
| B | 0 | 219 | 15935 | 101.41 | 794 | 774 | 149.5 |
| B | 12 | 111 | 14578 | 92.34 | 794 | 774 | 149.5 |
| C | 10 | 22 | 23530 | 129.73 | 760 | 764 | 175.5 |
| C | 8 | 229 | 11117 | 59.0 | 760 | 764 | 175.5 |
| C | 1 | 16 | 9029 | 47.1 | 760 | 764 | 175.5 |
| D | 2 | 136 | 297434 | 1615.38 | 752 | 728 | 183.7 |
| D | 2 | 244 | 245805 | 1334.29 | 752 | 728 | 183.7 |
| D | 2 | 152 | 175883 | 953.61 | 752 | 728 | 183.7 |
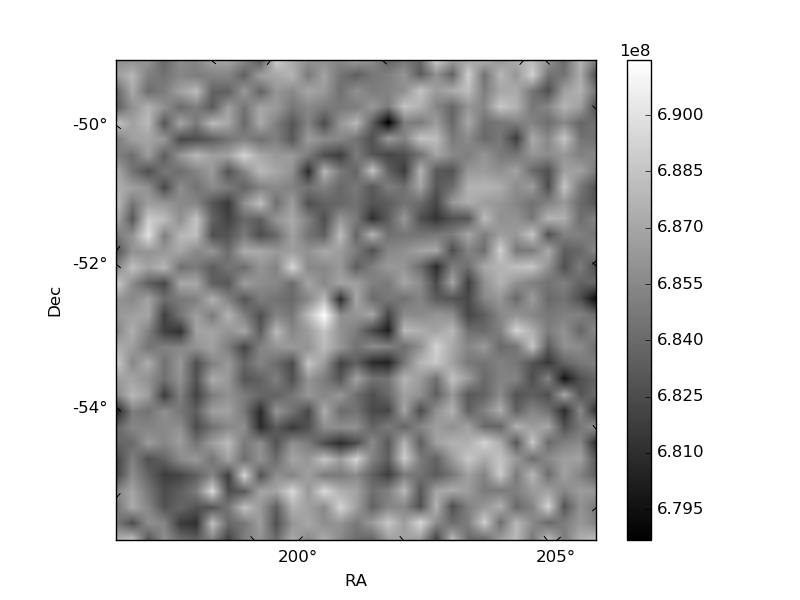
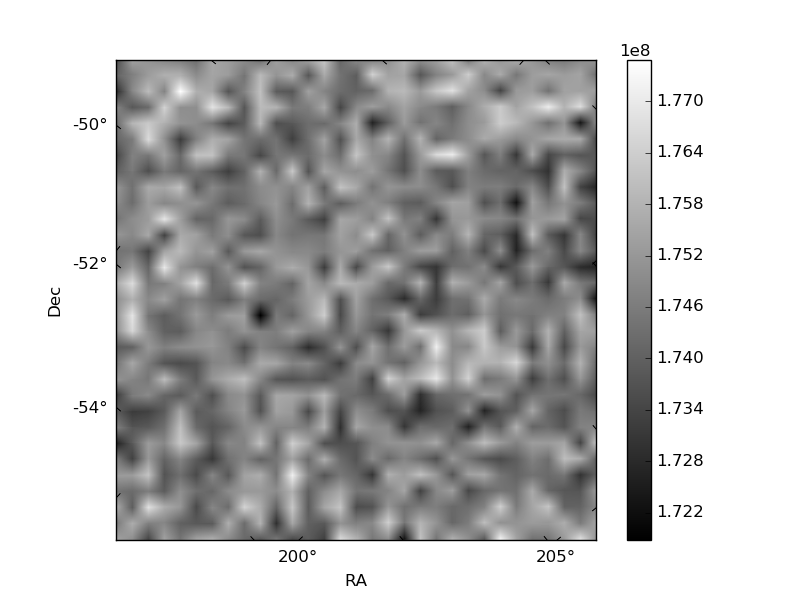
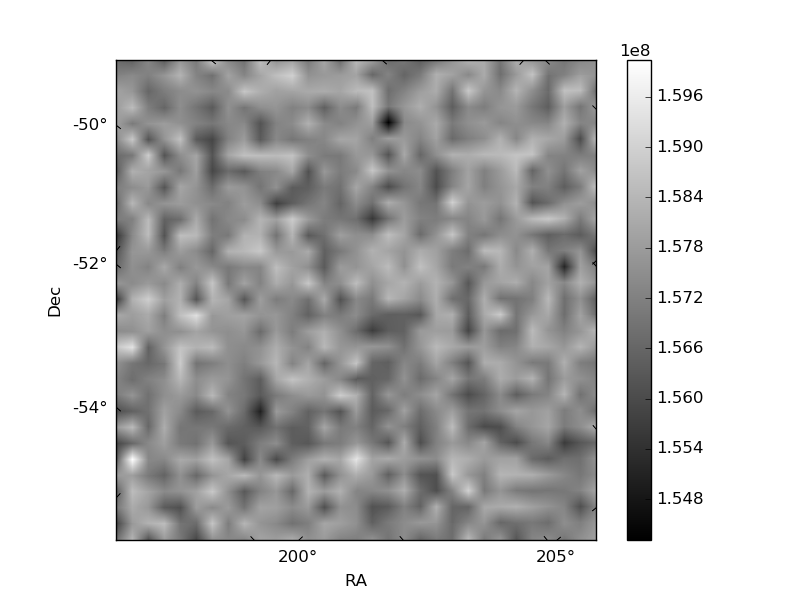
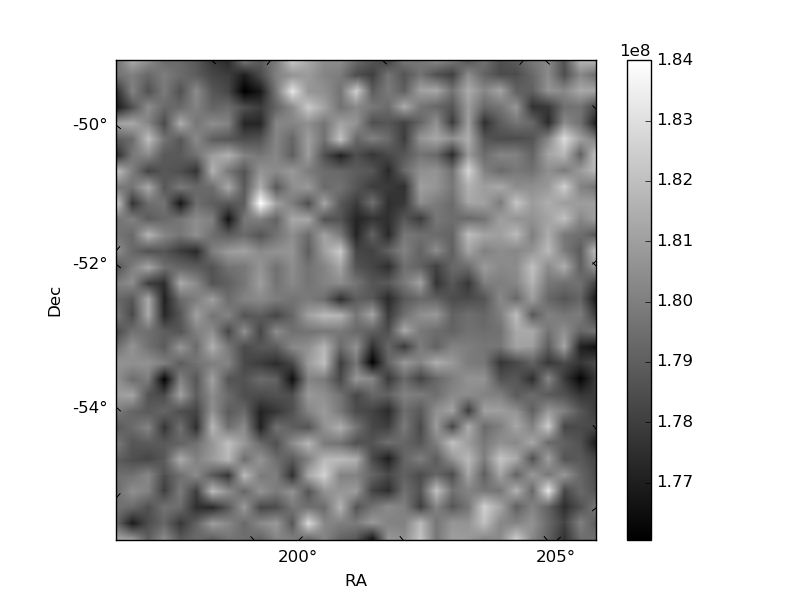
Histogram calculated using DETX and DETY for each event in the final _common_clean file
| Quadrant A | 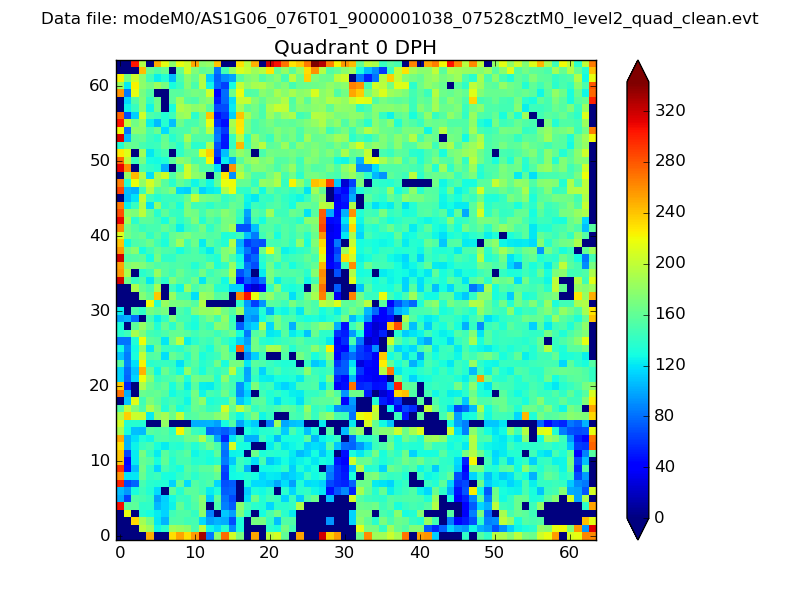 |
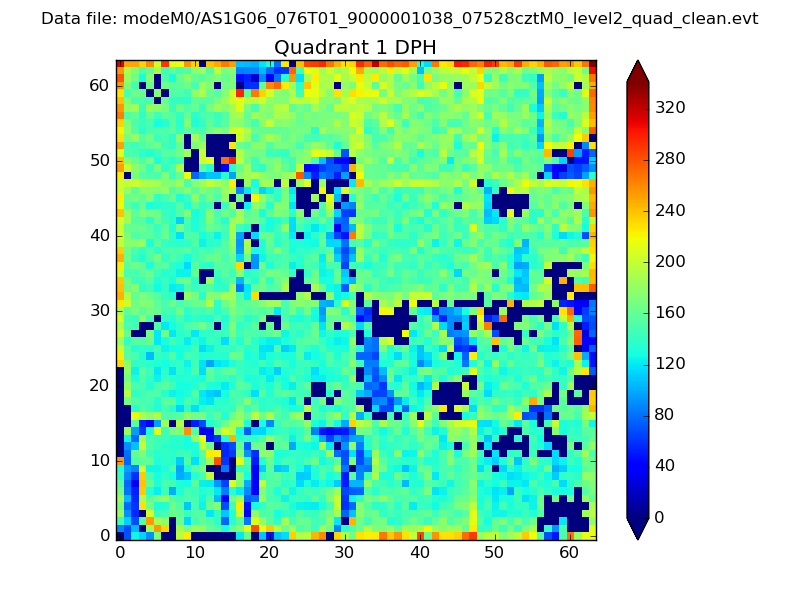 |
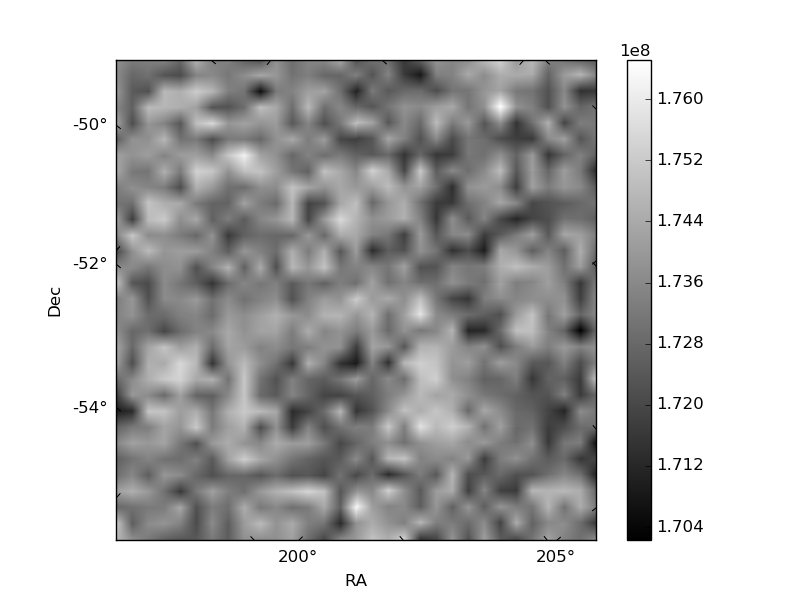
Quadrant B |
|---|---|---|---|
| Quadrant D | 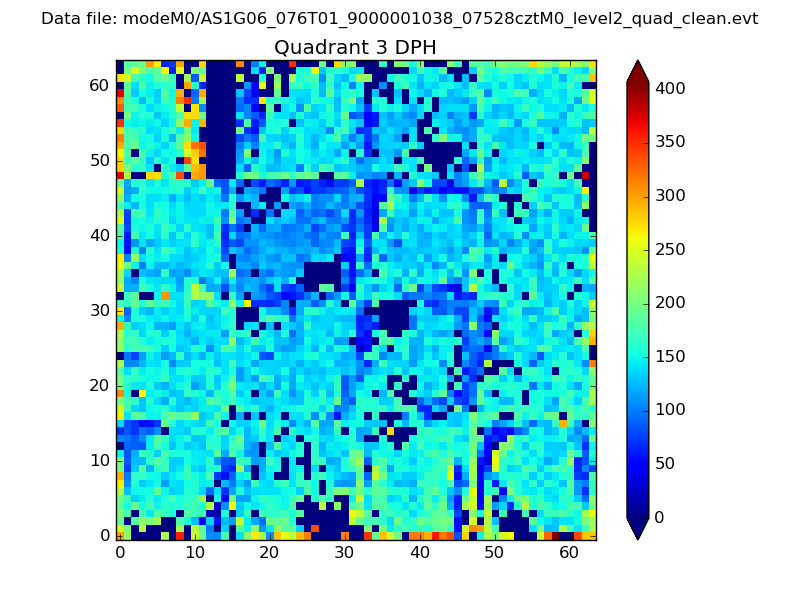 |
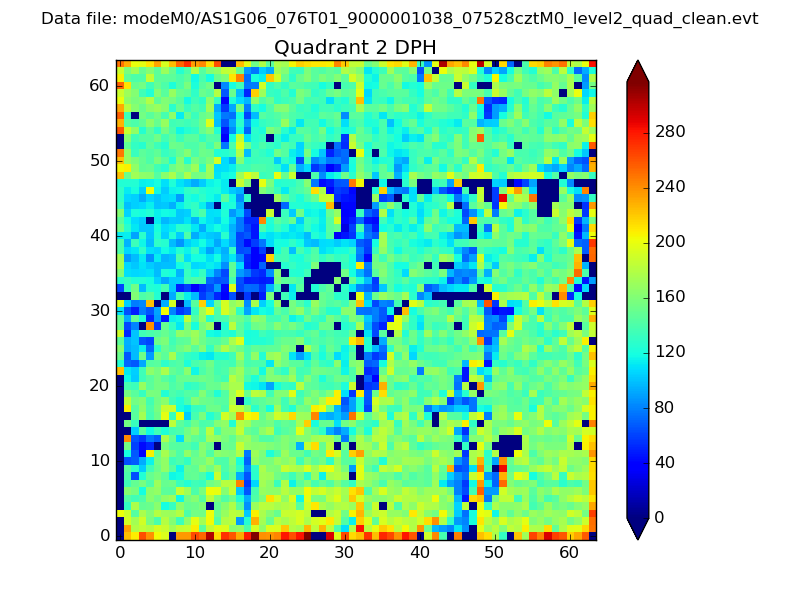 |
Quadrant C |
| Plot type | Count rate plots | Images |
|---|---|---|
| Comparison with Poisson distribution Blue bars denote a histogram of data divided into 1 sec bins. Red curve is a Poisson curve with rate = median count rate of data. |
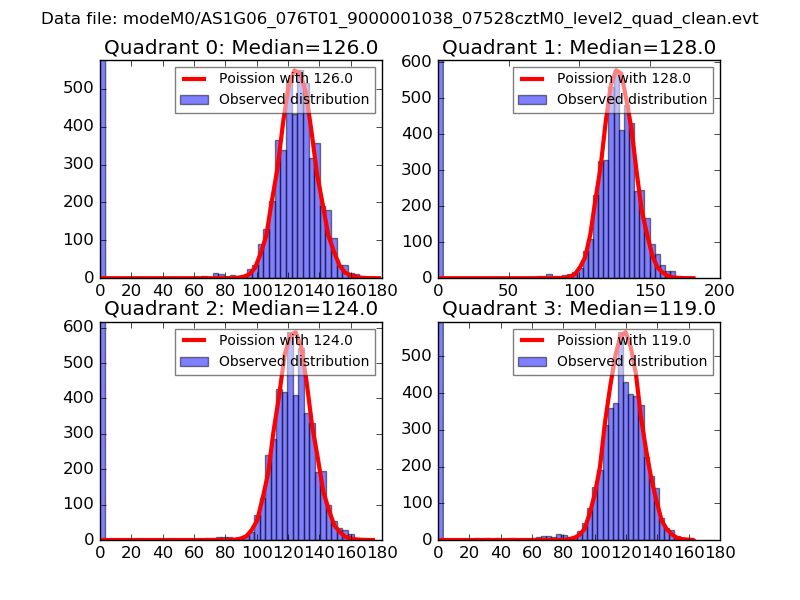 |
 |
| Quadrant-wise count rates Data is divided into 100 sec bins |
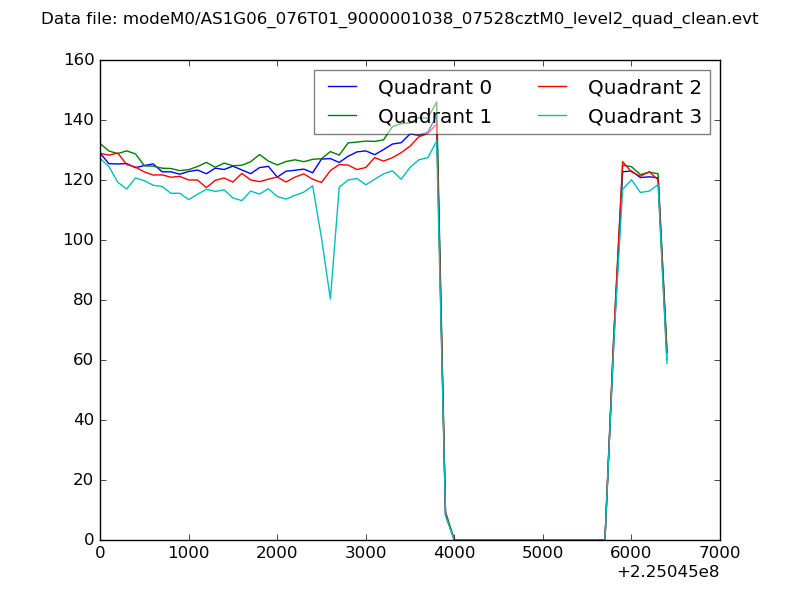 |
|
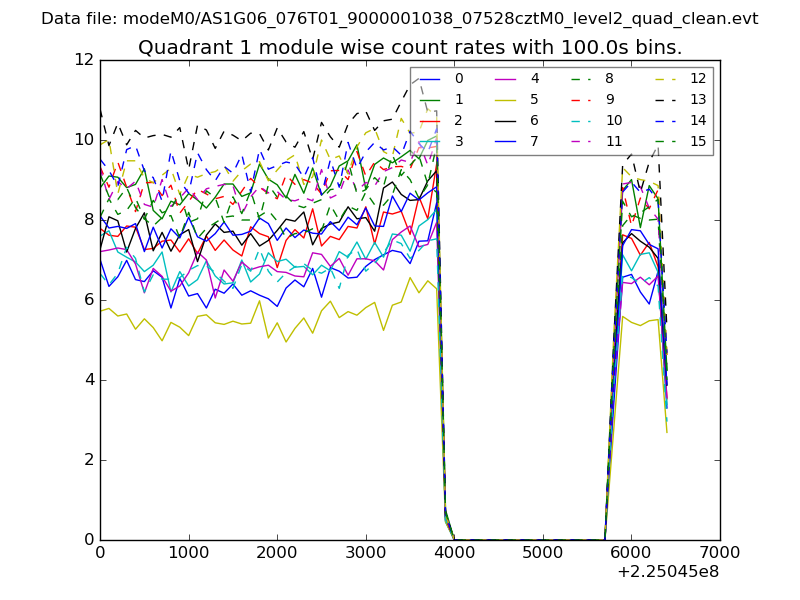
| Module-wise count rates for Quadrant A Data is divided into 100 sec bins |
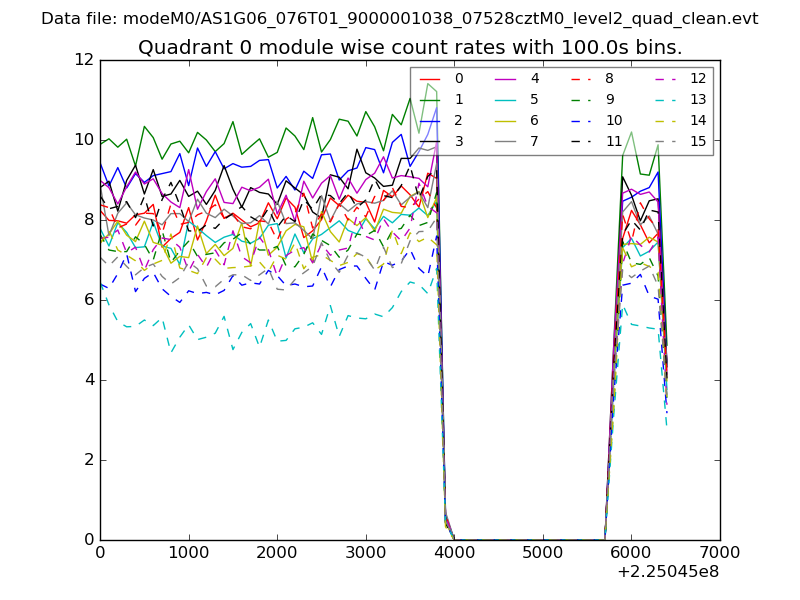 |
 |
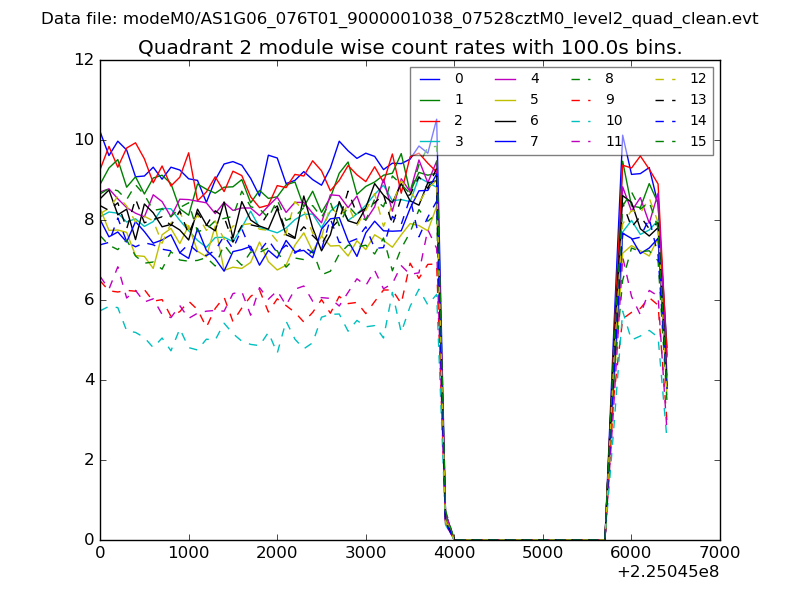
| Module-wise count rates for Quadrant B Data is divided into 100 sec bins |
 |
 |
| Module-wise count rates for Quadrant C Data is divided into 100 sec bins |
 |
 |
| Module-wise count rates for Quadrant D Data is divided into 100 sec bins |
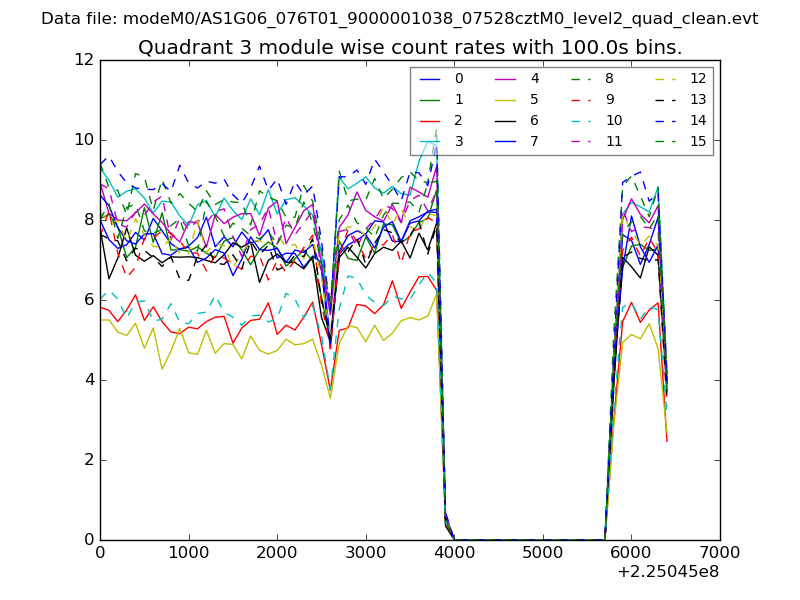 |
 |
| Parameter | Plot |
|---|---|
| CZT HV Monitor | 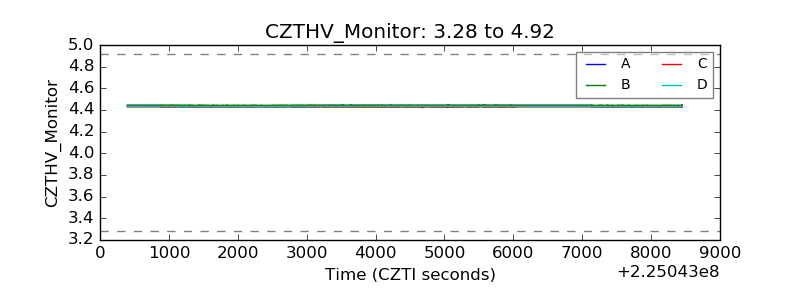 |
| D_VDD |  |
| Temperature 1 | 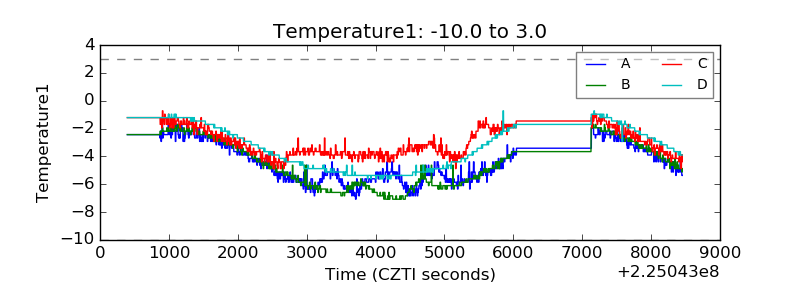 |
| Veto HV Monitor | 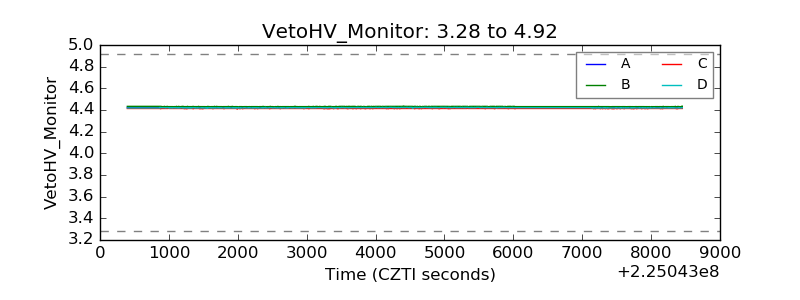 |
| Veto LLD |  |
| Alpha Counter | 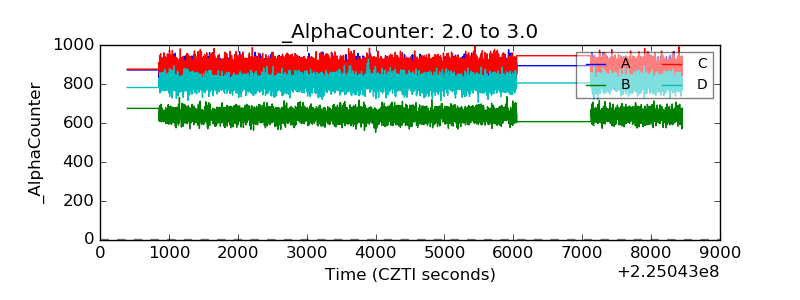 |
| _CPM_Rate | 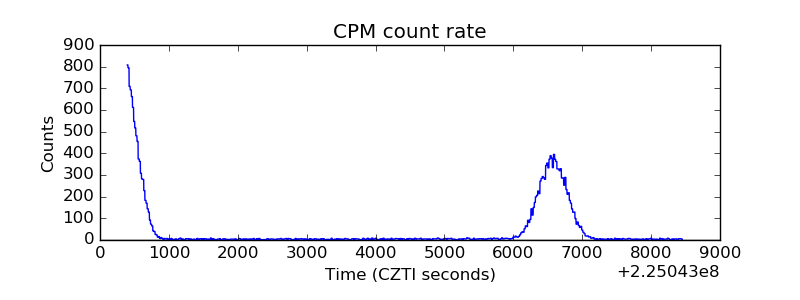 |
| CZT Counter | 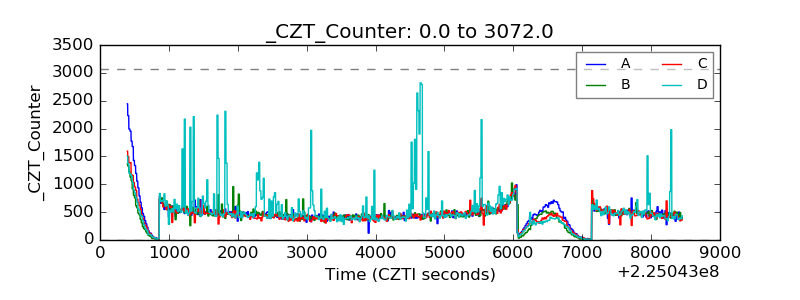 |
| +2.5 Volts monitor |  |
| +5 Volts monitor |  |
| _ROLL_ROT |  |
| _Roll_DEC | 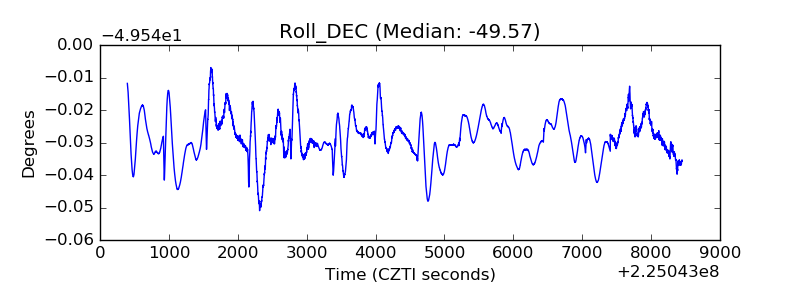 |
| _Roll_RA | 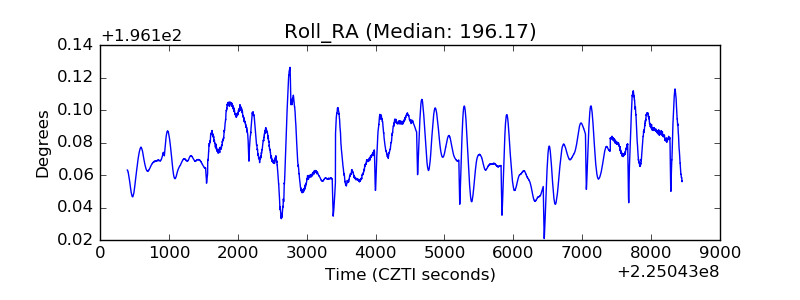 |
| Veto Counter |  |