| Param | Original file | Final file |
|---|---|---|
| Filename | modeM0/AS1G06_076T01_9000001038_07529cztM0_level2.evt | modeM0/AS1G06_076T01_9000001038_07529cztM0_level2_quad_clean.evt |
| Size (bytes) | 469,310,400 | 98,133,120 |
| Size | 447.6 MB | 93.6 MB |
| Events in quadrant A | 3,330,372 | 627,482 |
| Events in quadrant B | 3,401,607 | 637,360 |
| Events in quadrant C | 3,299,242 | 617,389 |
| Events in quadrant D | 3,692,337 | 588,388 |
| Mode M9 | |||
|---|---|---|---|
| Quadrant | BADHDUFLAG | Total packets | Discarded packets |
| A | 0 | 19 | 0 |
| B | 0 | 19 | 0 |
| C | 0 | 19 | 0 |
| D | 0 | 19 | 0 |
| Mode M0 | |||
|---|---|---|---|
| Quadrant | BADHDUFLAG | Total packets | Discarded packets |
| A | 0 | 14907 | 3 |
| B | 0 | 14995 | 2 |
| C | 0 | 14902 | 2 |
| D | 0 | 16122 | 2 |
| Mode SS | |||
|---|---|---|---|
| Quadrant | BADHDUFLAG | Total packets | Discarded packets |
| A | 0 | 146 | 0 |
| B | 0 | 146 | 0 |
| C | 0 | 146 | 0 |
| D | 0 | 146 | 0 |
| Quadrant | Total seconds | Saturated seconds | Saturation percentage |
|---|---|---|---|
| A | 7207 | 90 | 1.248786% |
| B | 7207 | 112 | 1.554045% |
| C | 7207 | 55 | 0.763147% |
| D | 7207 | 111 | 1.540169% |
Noise dominated data is calculated using 1-second bins in cleaned event files. If a bin has >2000 counts, and if more than 50% of those come from <1% of pixels, then it is considered to be noise-dominated and hence unusable.
| Quadrant | # 1 sec bins | Bins with >0 counts | Bins with >2000 counts | High rate bins dominated by noise | Noise dominated (total time) | Noise dominated (detector-on time) | Marked lightcurve |
|---|---|---|---|---|---|---|---|
| A | 9042 | 7209 | 0 | 0 | 0.00% | 0.00% | 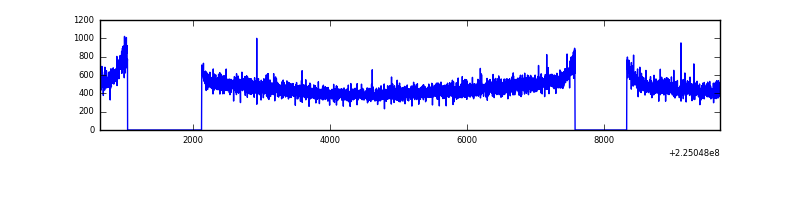 |
| B | 9042 | 7208 | 2 | 2 | 0.02% | 0.03% | 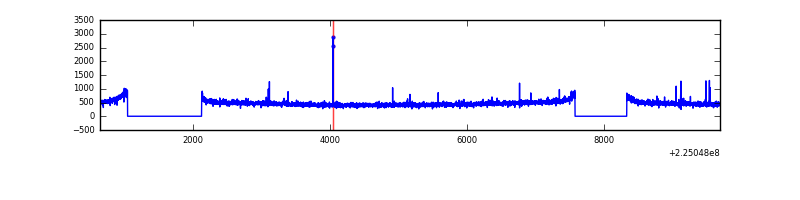 |
| C | 9042 | 7208 | 1 | 1 | 0.01% | 0.01% | 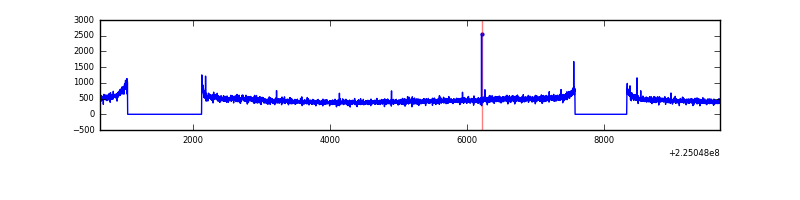 |
| D | 9042 | 7208 | 54 | 54 | 0.60% | 0.75% | 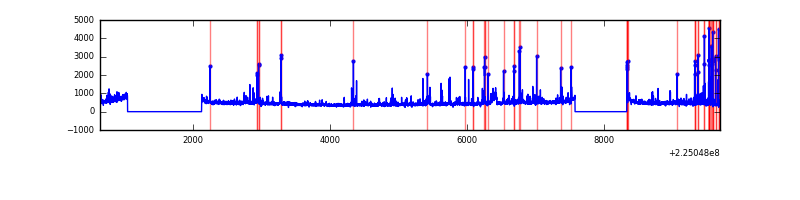 |
Top three noisy pixels from each quadrant. If the there are fewer than three noisy pixels in the level2.evt file, extra rows are filled as -1
| Pixel properties | Quadrant properties | ||||||
|---|---|---|---|---|---|---|---|
| Quadrant | DetID | PixID | Counts | Sigma | Mean | Median | Sigma |
| A | 13 | 14 | 14895 | 79.92 | 861 | 842 | 175.8 |
| A | 0 | 226 | 8525 | 43.69 | 861 | 842 | 175.8 |
| A | 12 | 194 | 7443 | 37.54 | 861 | 842 | 175.8 |
| B | 12 | 111 | 16378 | 94.21 | 868 | 847 | 164.9 |
| B | 11 | 111 | 12930 | 73.29 | 868 | 847 | 164.9 |
| B | 4 | 81 | 11133 | 62.39 | 868 | 847 | 164.9 |
| C | 10 | 22 | 22401 | 111.4 | 834 | 836 | 193.6 |
| C | 1 | 16 | 12686 | 61.21 | 834 | 836 | 193.6 |
| C | 8 | 229 | 7005 | 31.87 | 834 | 836 | 193.6 |
| D | 2 | 152 | 234420 | 1152.44 | 829 | 803 | 202.7 |
| D | 2 | 244 | 87001 | 425.21 | 829 | 803 | 202.7 |
| D | 12 | 233 | 58800 | 286.1 | 829 | 803 | 202.7 |
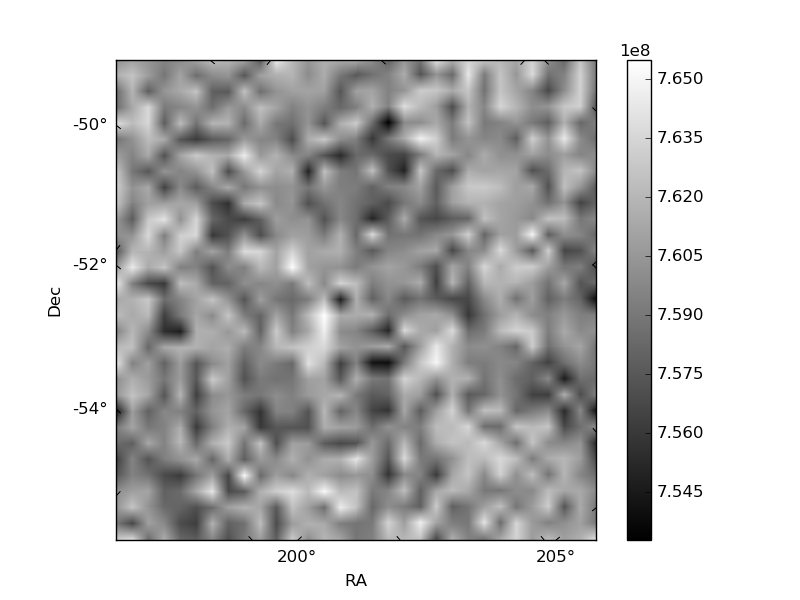
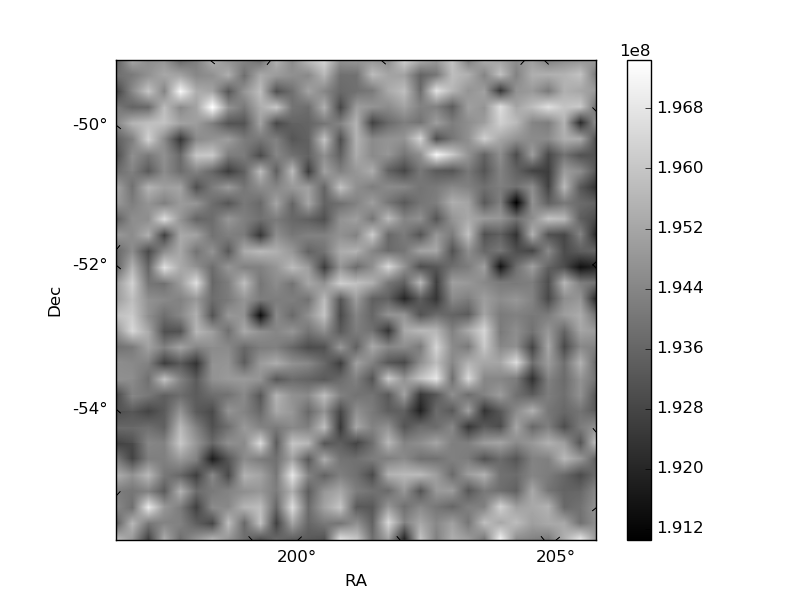
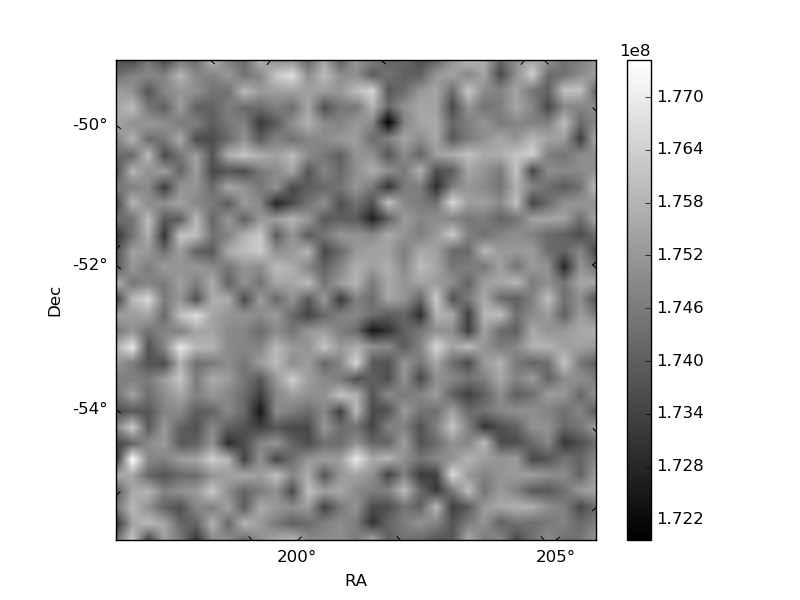
Histogram calculated using DETX and DETY for each event in the final _common_clean file
| Quadrant A | 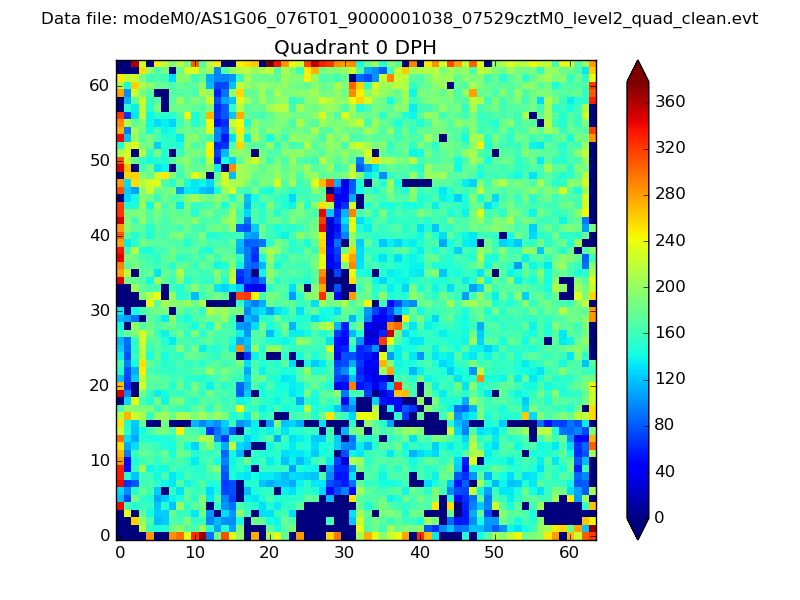 |
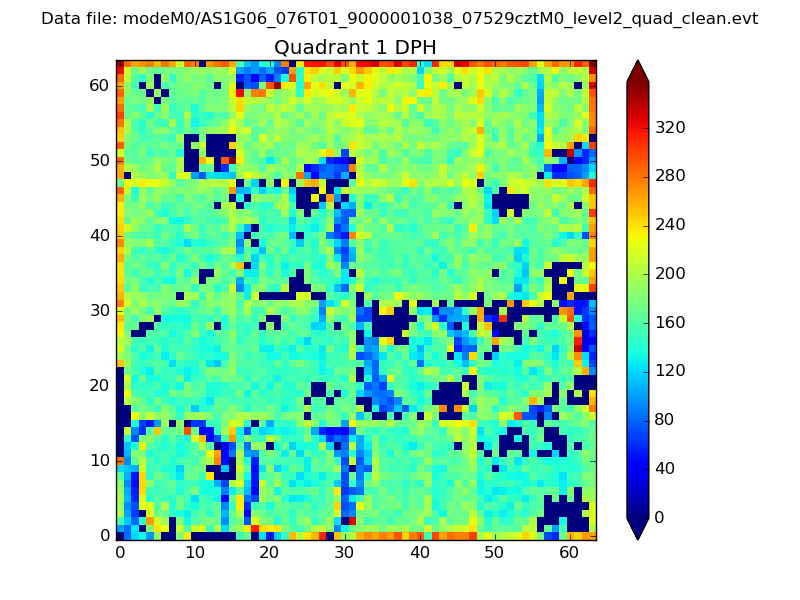 |
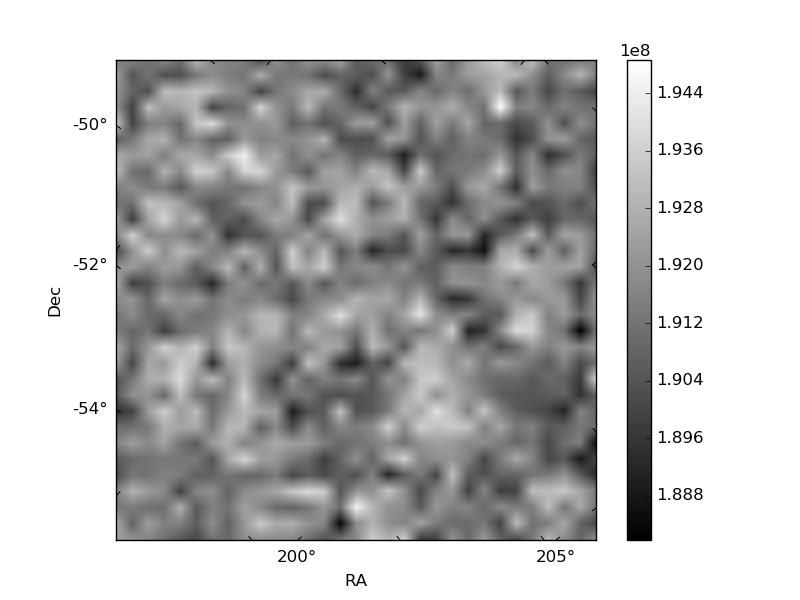
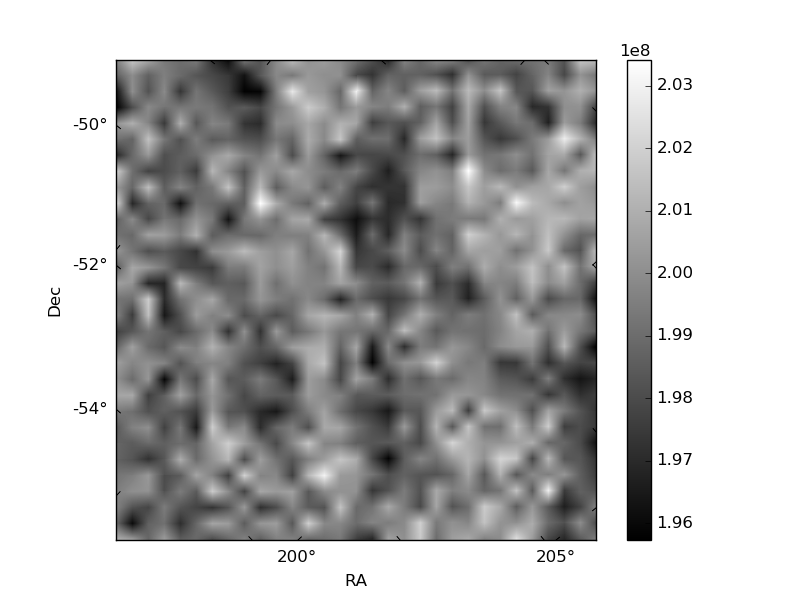
Quadrant B |
|---|---|---|---|
| Quadrant D | 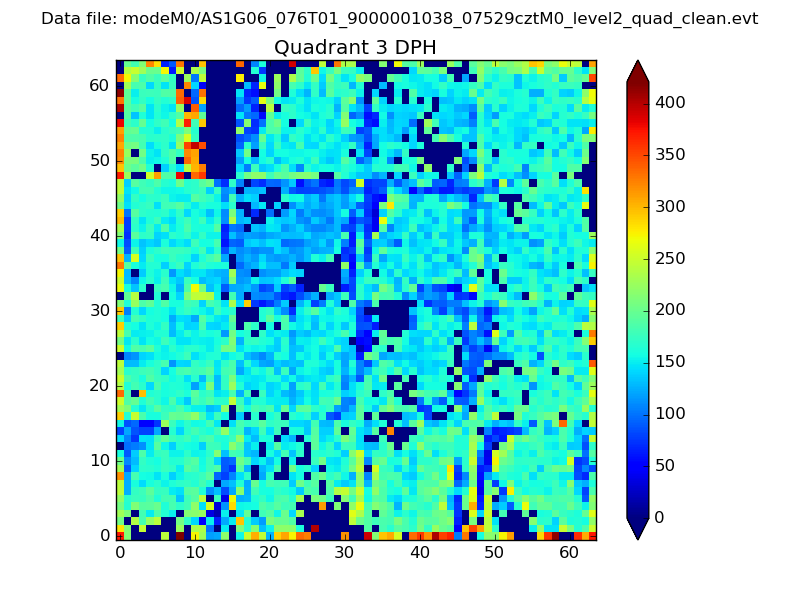 |
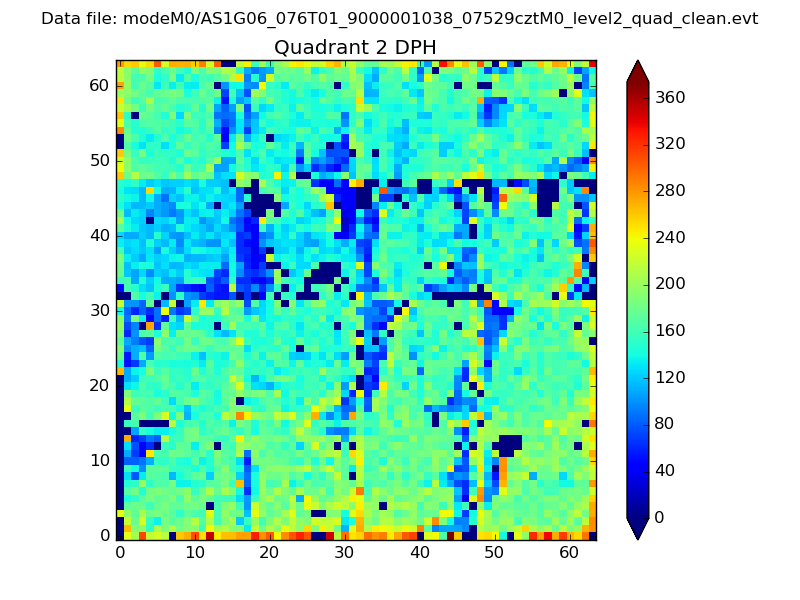 |
Quadrant C |
| Plot type | Count rate plots | Images |
|---|---|---|
| Comparison with Poisson distribution Blue bars denote a histogram of data divided into 1 sec bins. Red curve is a Poisson curve with rate = median count rate of data. |
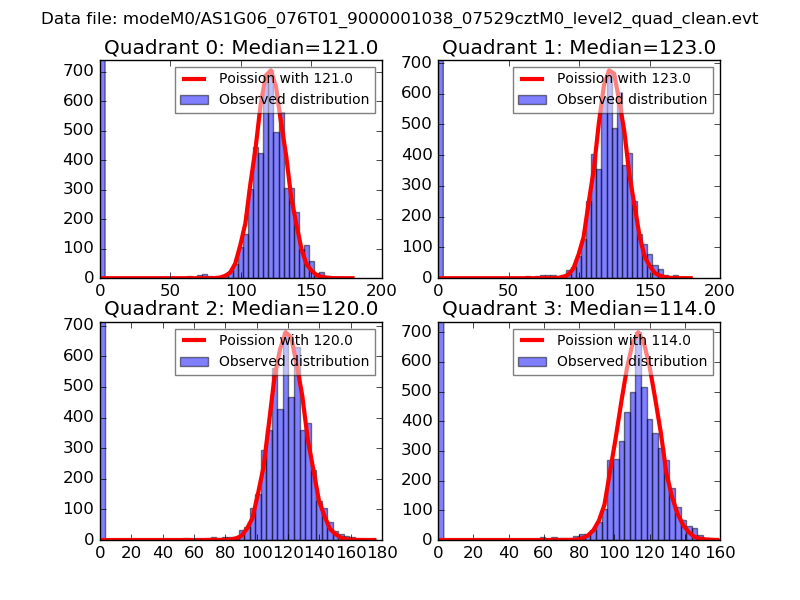 |
 |
| Quadrant-wise count rates Data is divided into 100 sec bins |
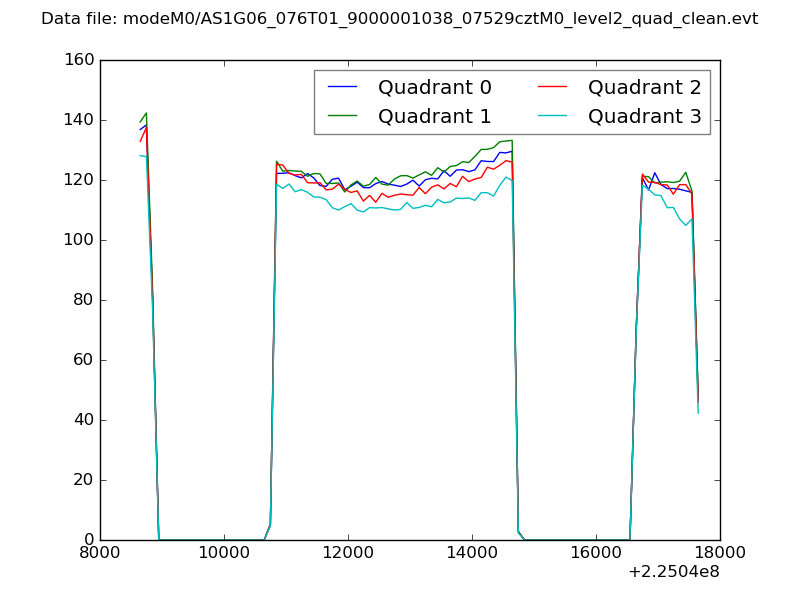 |
|
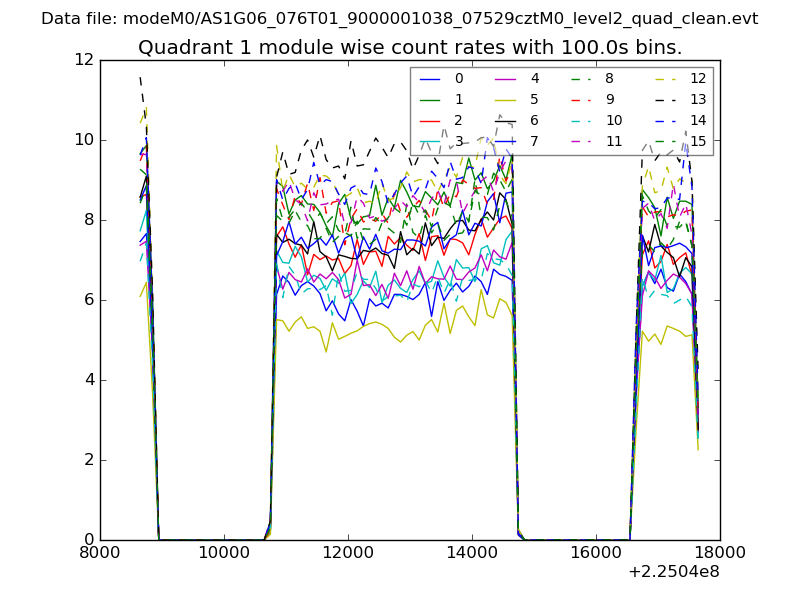
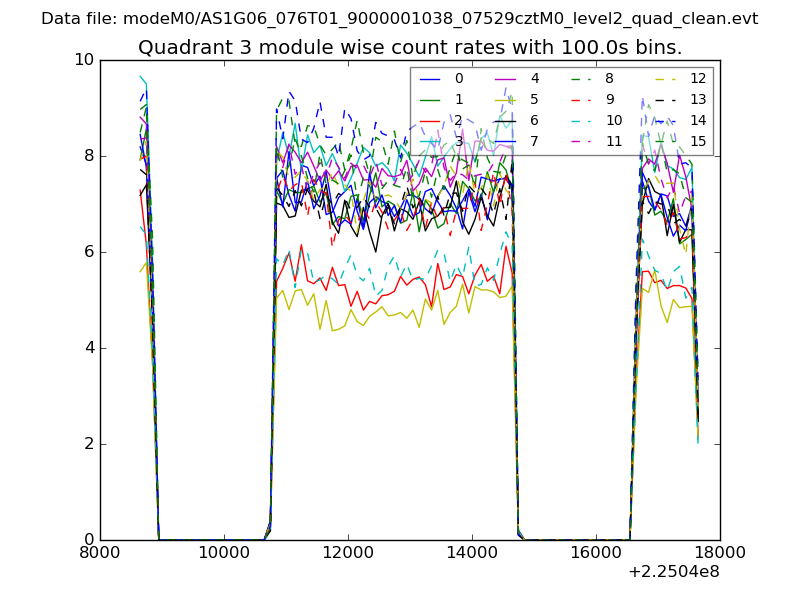
| Module-wise count rates for Quadrant A Data is divided into 100 sec bins |
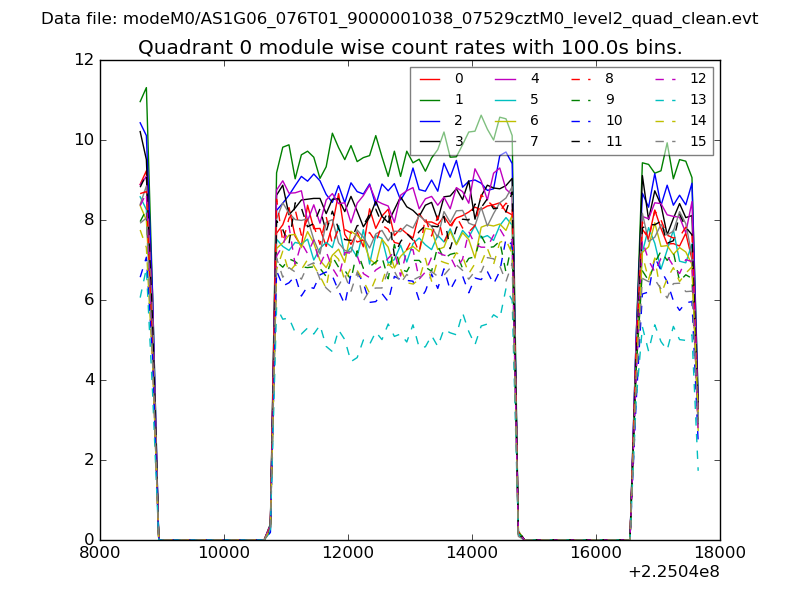 |
 |
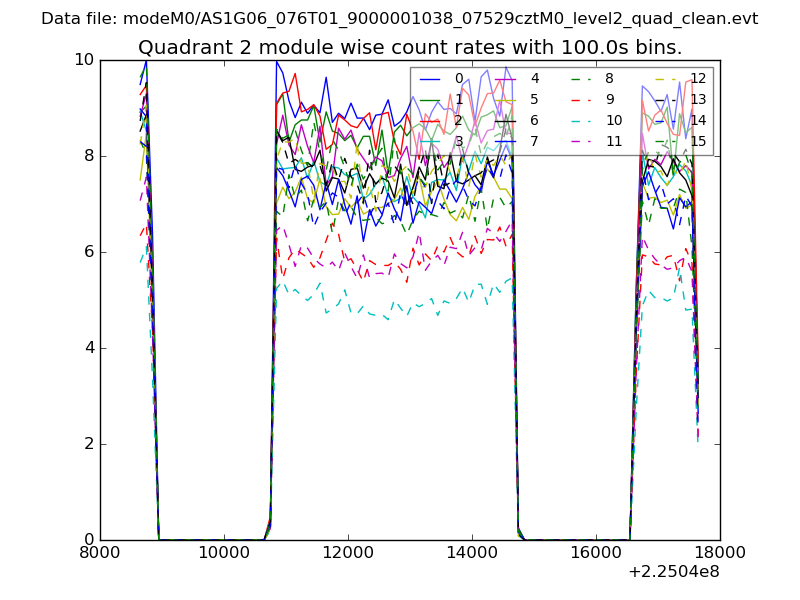
| Module-wise count rates for Quadrant B Data is divided into 100 sec bins |
 |
 |
| Module-wise count rates for Quadrant C Data is divided into 100 sec bins |
 |
 |
| Module-wise count rates for Quadrant D Data is divided into 100 sec bins |
 |
 |
| Parameter | Plot |
|---|---|
| CZT HV Monitor | 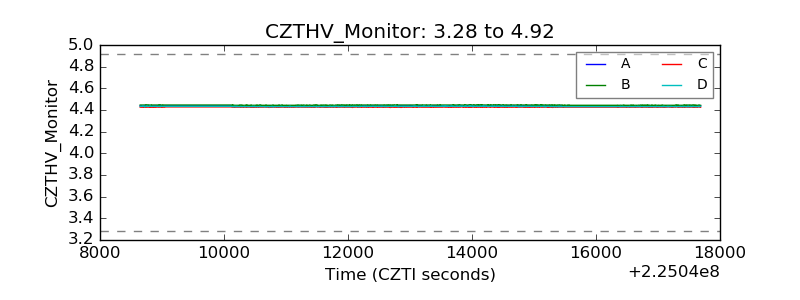 |
| D_VDD | 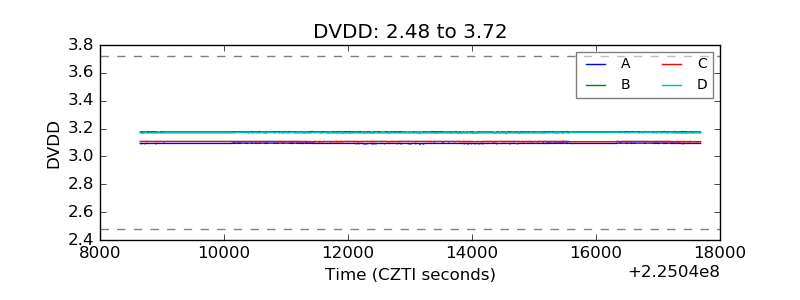 |
| Temperature 1 | 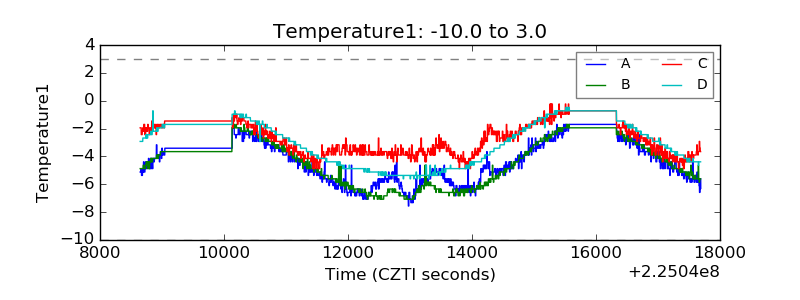 |
| Veto HV Monitor | 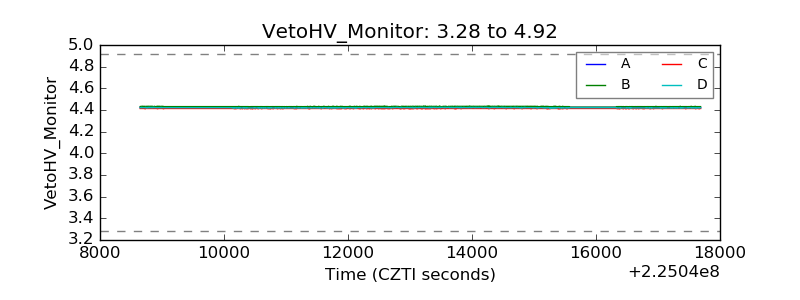 |
| Veto LLD | 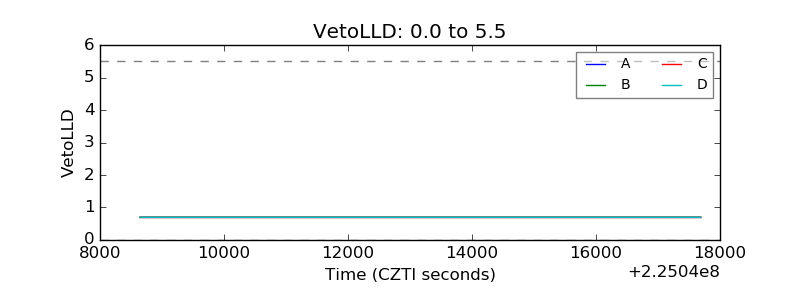 |
| Alpha Counter | 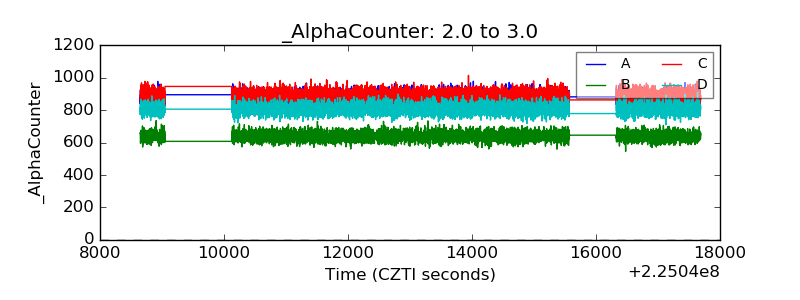 |
| _CPM_Rate | 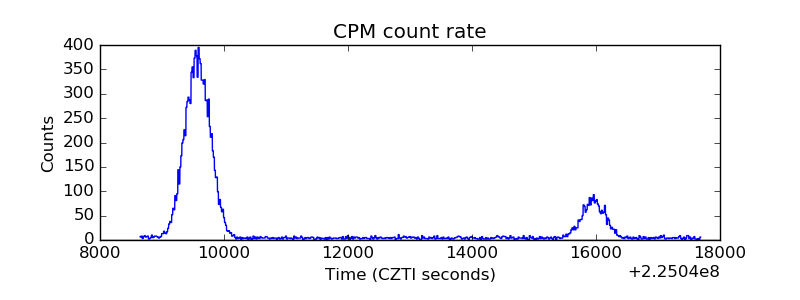 |
| CZT Counter | 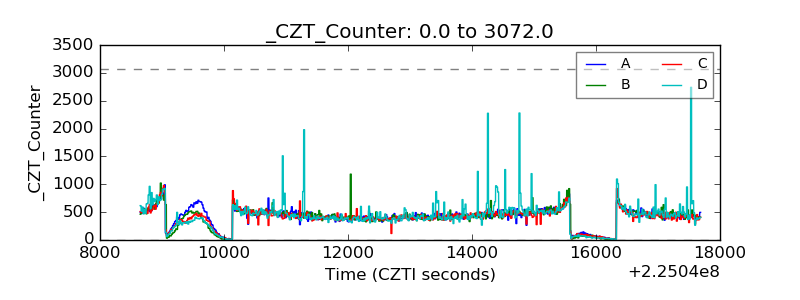 |
| +2.5 Volts monitor | 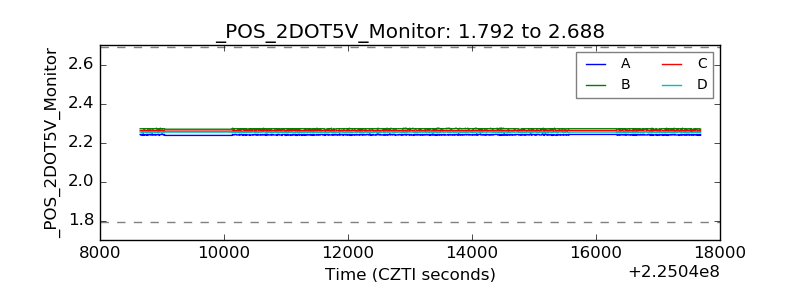 |
| +5 Volts monitor | 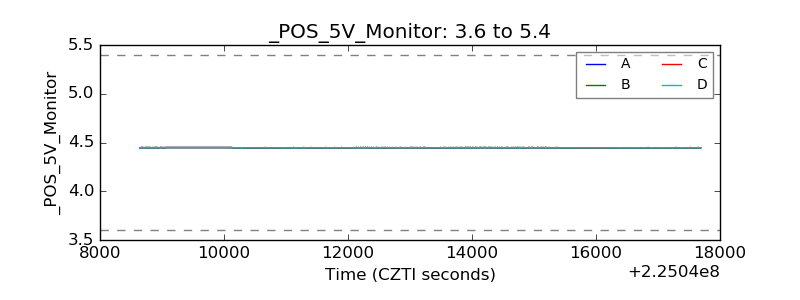 |
| _ROLL_ROT | 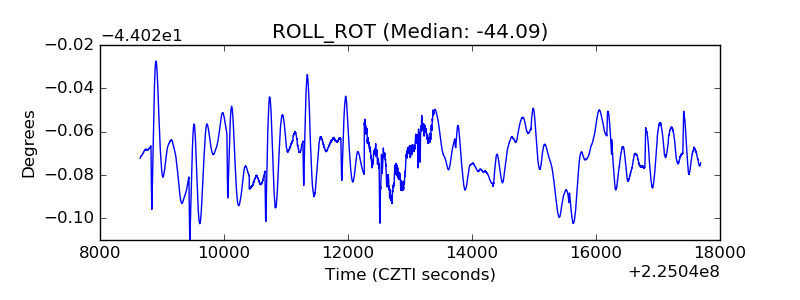 |
| _Roll_DEC | 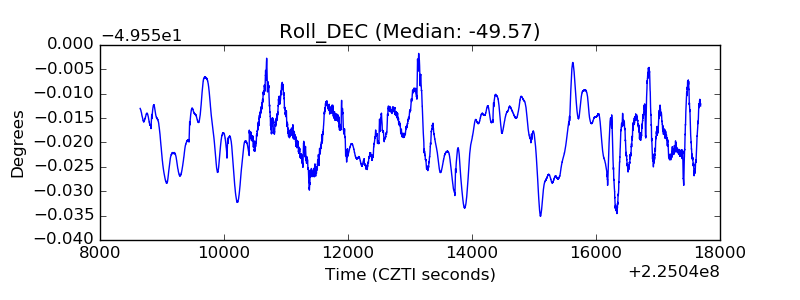 |
| _Roll_RA | 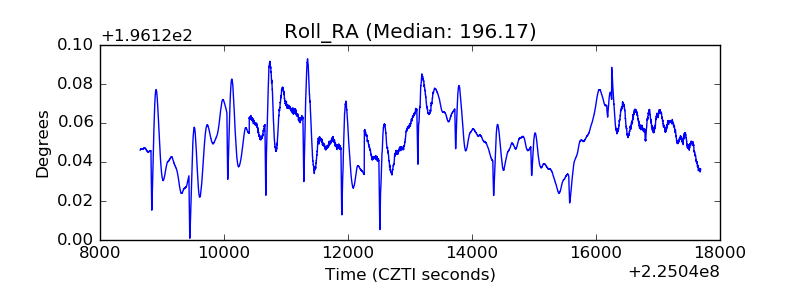 |
| Veto Counter | 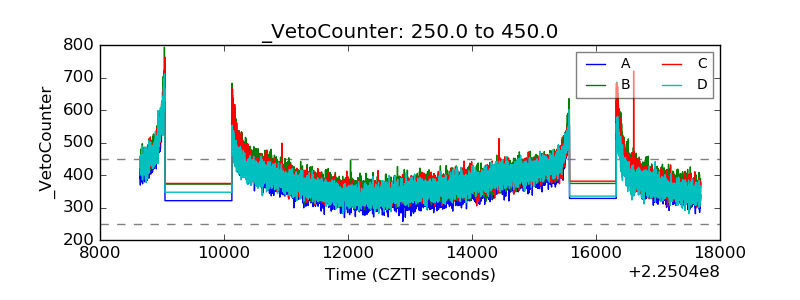 |