| Param | Original file | Final file |
|---|---|---|
| Filename | modeM0/AS1G06_076T01_9000001038_07530cztM0_level2.evt | modeM0/AS1G06_076T01_9000001038_07530cztM0_level2_quad_clean.evt |
| Size (bytes) | 514,509,120 | 101,327,040 |
| Size | 490.7 MB | 96.6 MB |
| Events in quadrant A | 3,494,128 | 642,203 |
| Events in quadrant B | 3,599,901 | 656,502 |
| Events in quadrant C | 3,438,853 | 634,801 |
| Events in quadrant D | 4,528,972 | 602,371 |
| Mode M9 | |||
|---|---|---|---|
| Quadrant | BADHDUFLAG | Total packets | Discarded packets |
| A | 0 | 12 | 0 |
| B | 0 | 12 | 0 |
| C | 0 | 12 | 0 |
| D | 0 | 12 | 0 |
| Mode M0 | |||
|---|---|---|---|
| Quadrant | BADHDUFLAG | Total packets | Discarded packets |
| A | 0 | 15818 | 3 |
| B | 0 | 15987 | 2 |
| C | 0 | 15764 | 2 |
| D | 0 | 18943 | 2 |
| Mode SS | |||
|---|---|---|---|
| Quadrant | BADHDUFLAG | Total packets | Discarded packets |
| A | 0 | 154 | 0 |
| B | 0 | 154 | 0 |
| C | 0 | 154 | 0 |
| D | 0 | 154 | 0 |
| Quadrant | Total seconds | Saturated seconds | Saturation percentage |
|---|---|---|---|
| A | 7670 | 47 | 0.612777% |
| B | 7670 | 76 | 0.990874% |
| C | 7670 | 23 | 0.299870% |
| D | 7670 | 173 | 2.255541% |
Noise dominated data is calculated using 1-second bins in cleaned event files. If a bin has >2000 counts, and if more than 50% of those come from <1% of pixels, then it is considered to be noise-dominated and hence unusable.
| Quadrant | # 1 sec bins | Bins with >0 counts | Bins with >2000 counts | High rate bins dominated by noise | Noise dominated (total time) | Noise dominated (detector-on time) | Marked lightcurve |
|---|---|---|---|---|---|---|---|
| A | 8765 | 7672 | 0 | 0 | 0.00% | 0.00% | 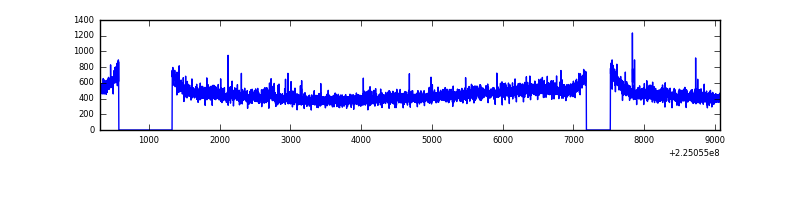 |
| B | 8765 | 7672 | 1 | 1 | 0.01% | 0.01% | 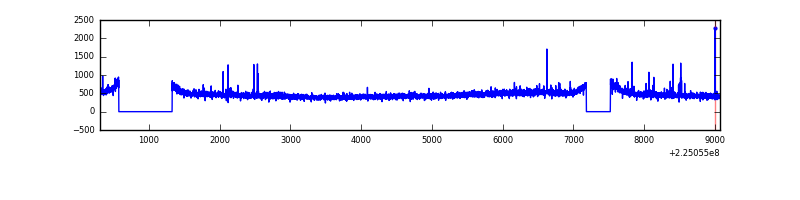 |
| C | 8765 | 7672 | 0 | 0 | 0.00% | 0.00% | 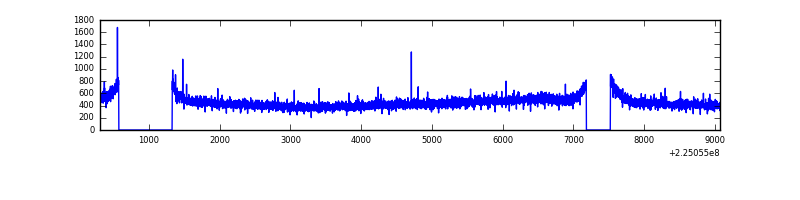 |
| D | 8765 | 7672 | 120 | 120 | 1.37% | 1.56% | 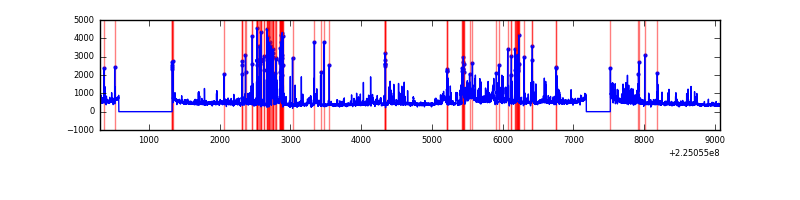 |
Top three noisy pixels from each quadrant. If the there are fewer than three noisy pixels in the level2.evt file, extra rows are filled as -1
| Pixel properties | Quadrant properties | ||||||
|---|---|---|---|---|---|---|---|
| Quadrant | DetID | PixID | Counts | Sigma | Mean | Median | Sigma |
| A | 13 | 14 | 10939 | 54.1 | 903 | 882 | 185.9 |
| A | 0 | 23 | 9576 | 46.77 | 903 | 882 | 185.9 |
| A | 0 | 226 | 9240 | 44.96 | 903 | 882 | 185.9 |
| B | 12 | 111 | 17330 | 94.43 | 914 | 891 | 174.1 |
| B | 0 | 219 | 14534 | 78.37 | 914 | 891 | 174.1 |
| B | 11 | 111 | 13794 | 74.11 | 914 | 891 | 174.1 |
| C | 1 | 16 | 8722 | 38.48 | 875 | 878 | 203.9 |
| C | 13 | 61 | 6902 | 29.55 | 875 | 878 | 203.9 |
| C | 8 | 128 | 5177 | 21.09 | 875 | 878 | 203.9 |
| D | 2 | 244 | 580253 | 2739.64 | 862 | 832 | 211.5 |
| D | 12 | 233 | 210946 | 993.47 | 862 | 832 | 211.5 |
| D | 2 | 152 | 130441 | 612.82 | 862 | 832 | 211.5 |
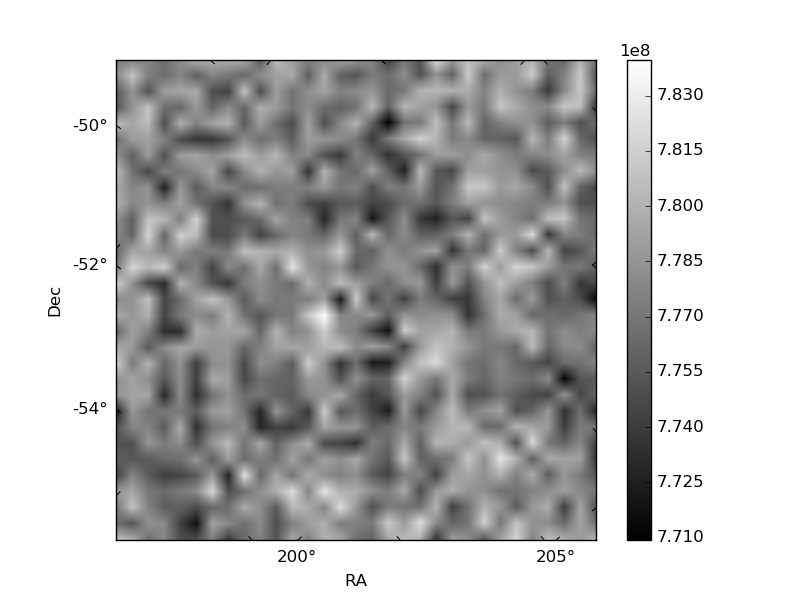
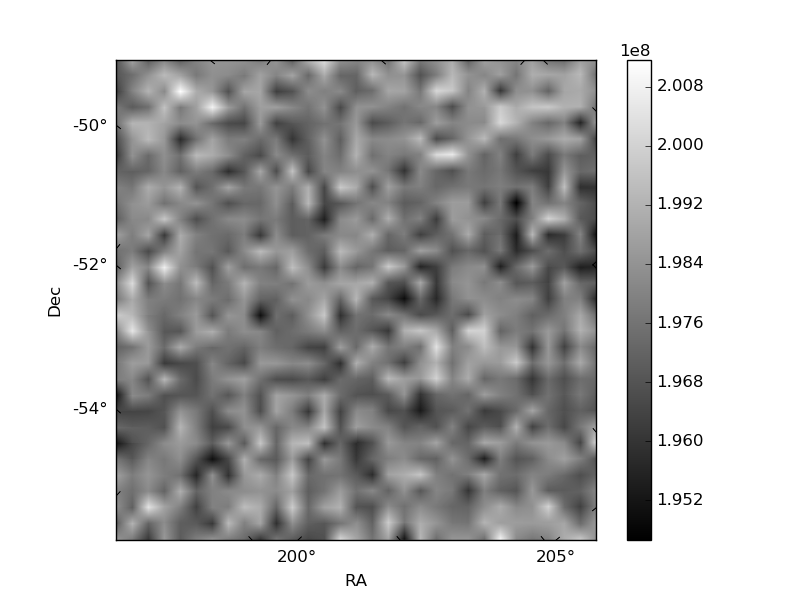
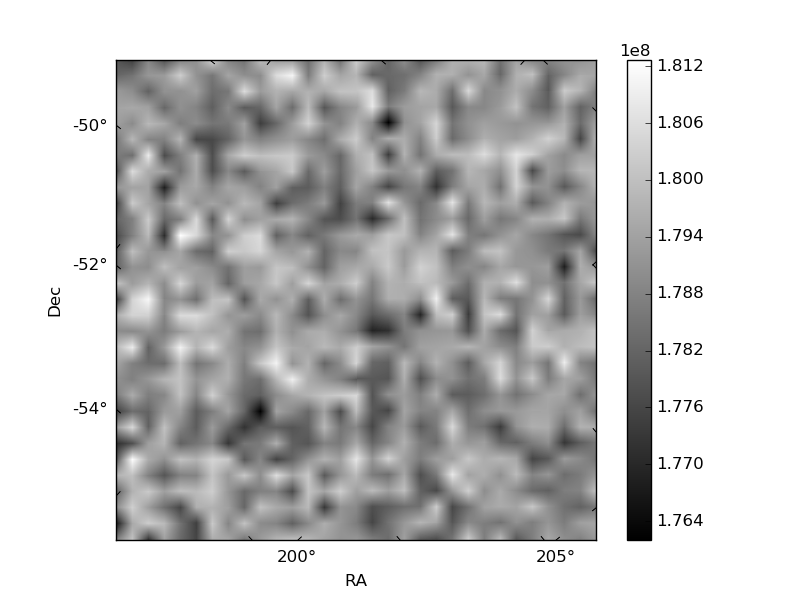
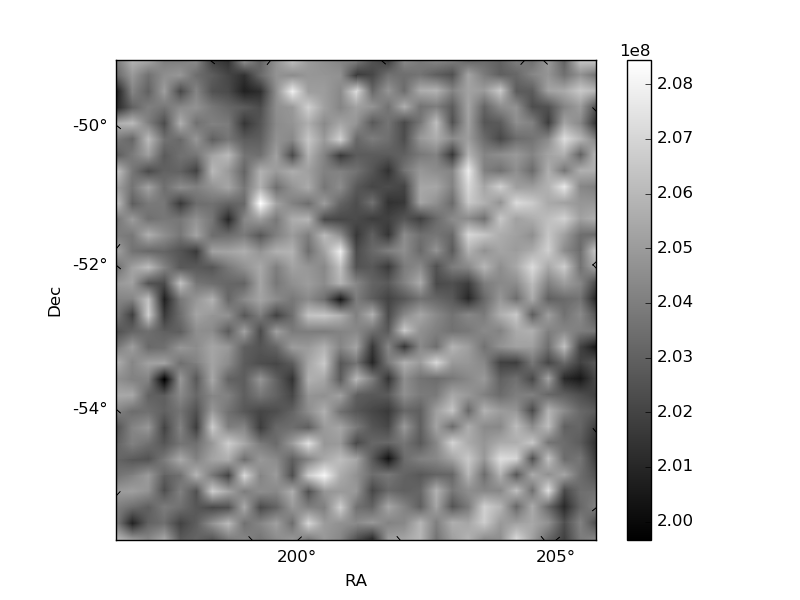
Histogram calculated using DETX and DETY for each event in the final _common_clean file
| Quadrant A | 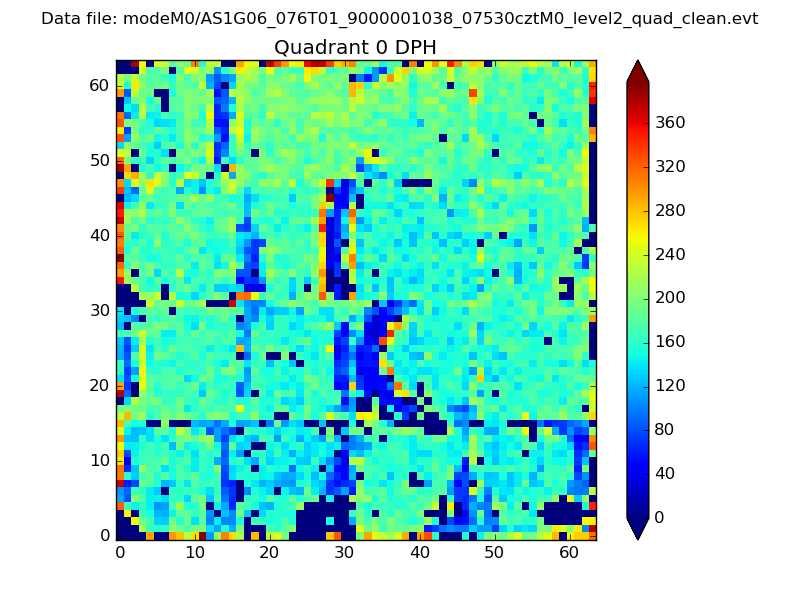 |
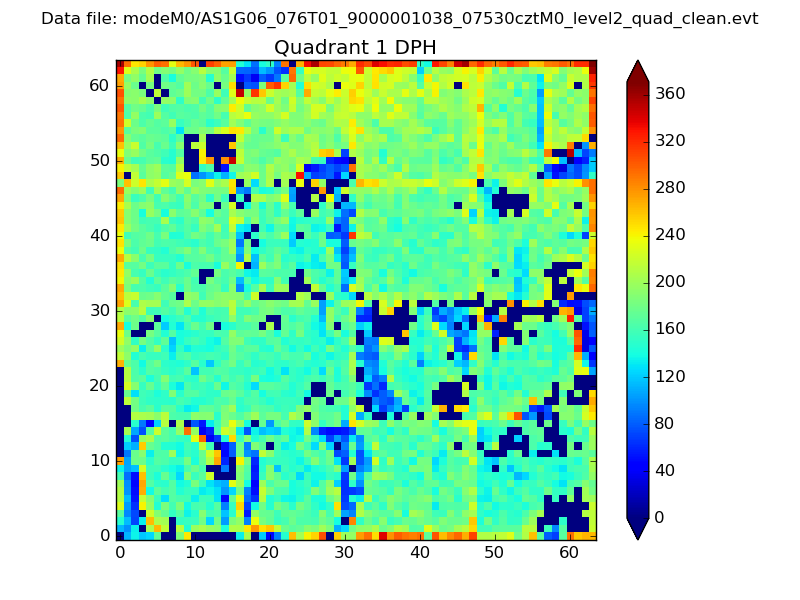 |
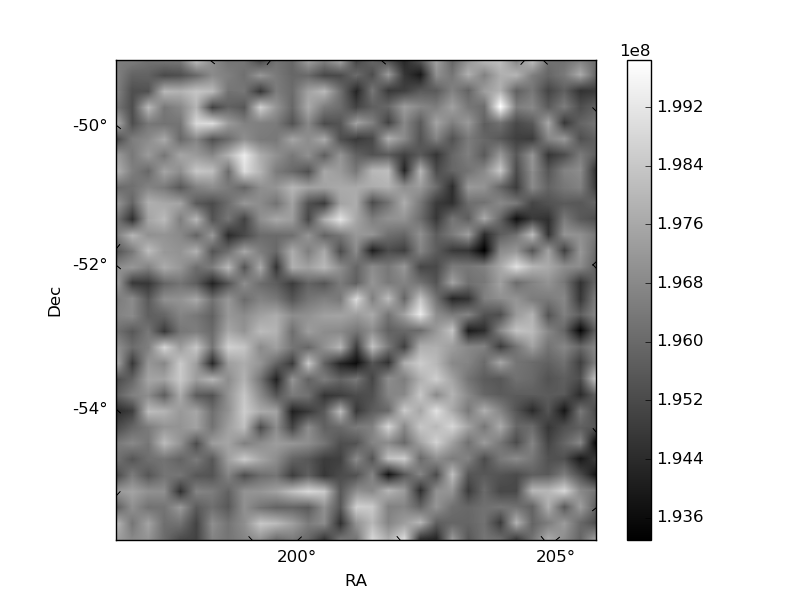
Quadrant B |
|---|---|---|---|
| Quadrant D | 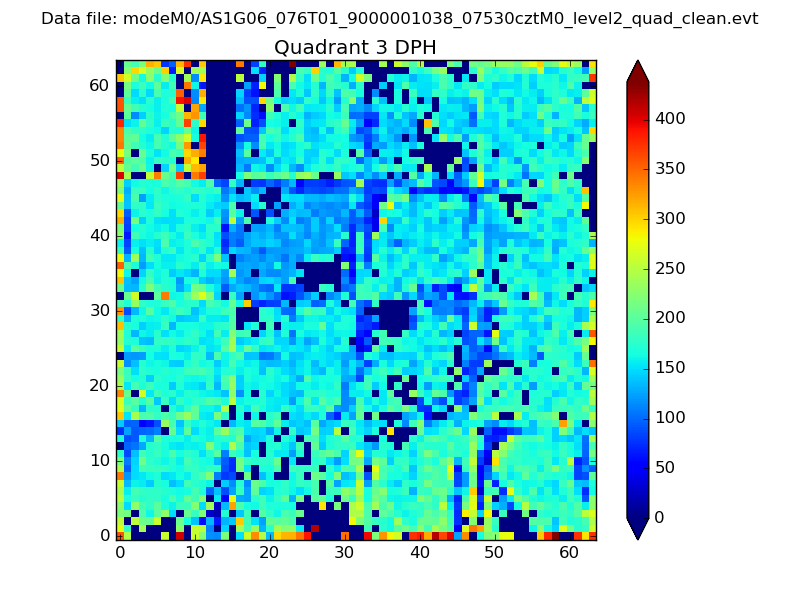 |
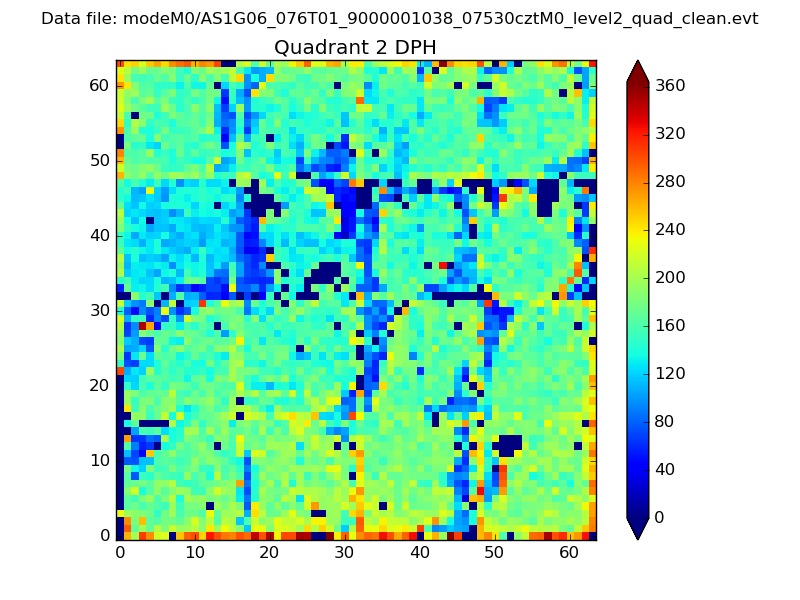 |
Quadrant C |
| Plot type | Count rate plots | Images |
|---|---|---|
| Comparison with Poisson distribution Blue bars denote a histogram of data divided into 1 sec bins. Red curve is a Poisson curve with rate = median count rate of data. |
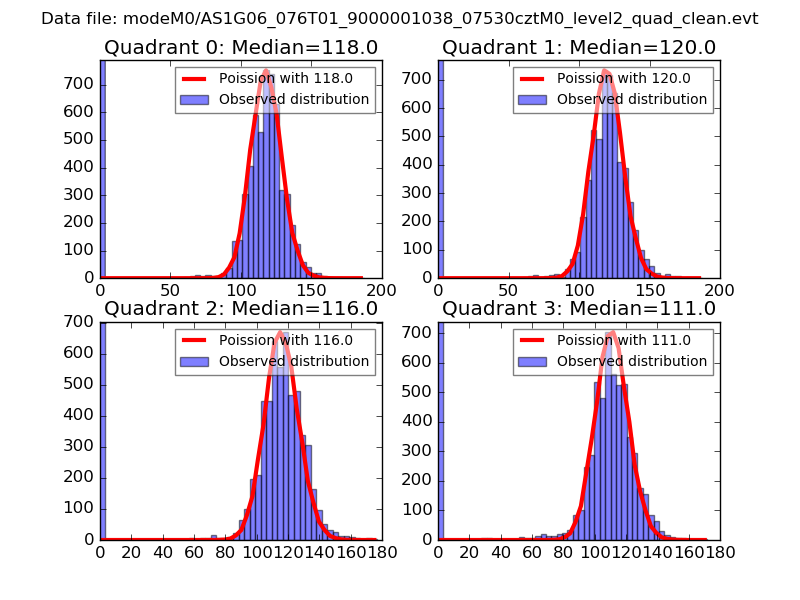 |
 |
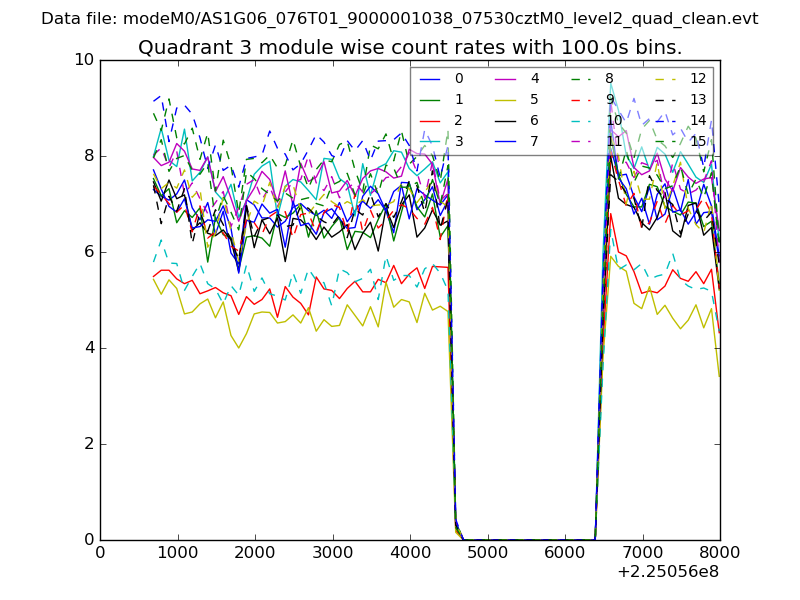
| Quadrant-wise count rates Data is divided into 100 sec bins |
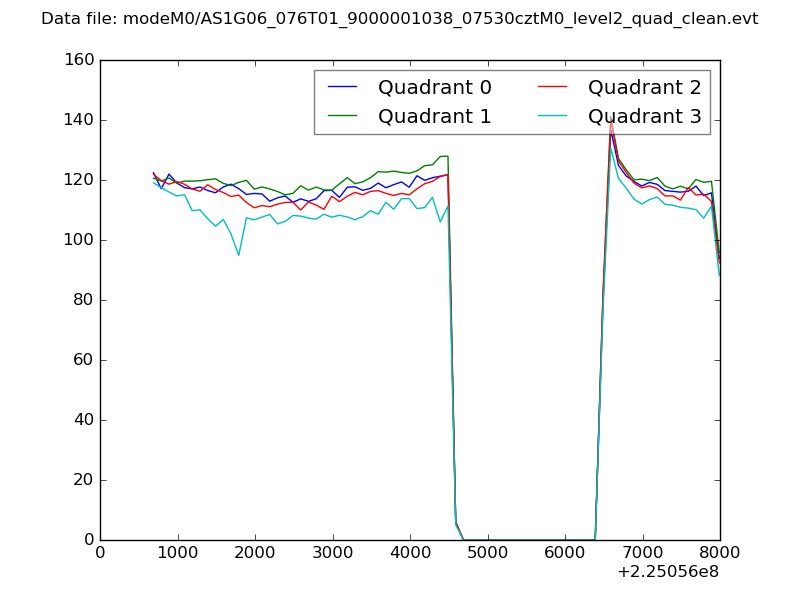 |
|
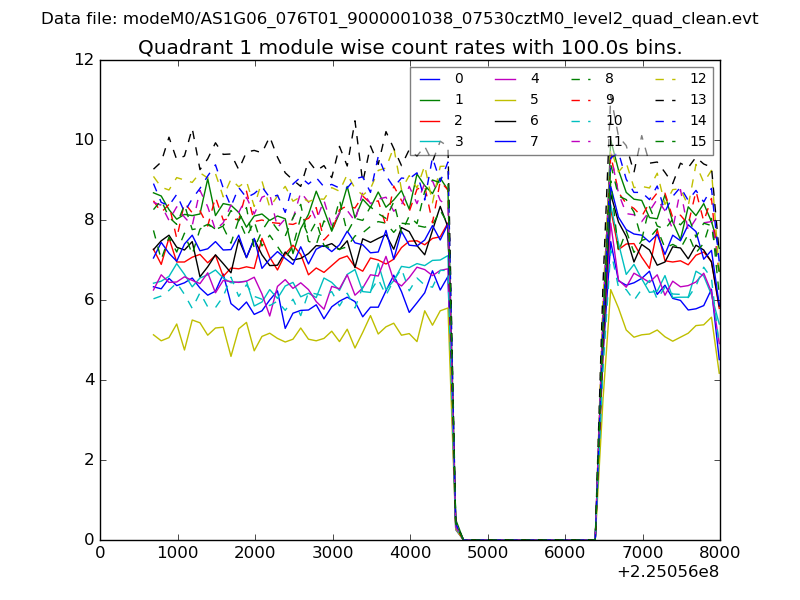
| Module-wise count rates for Quadrant A Data is divided into 100 sec bins |
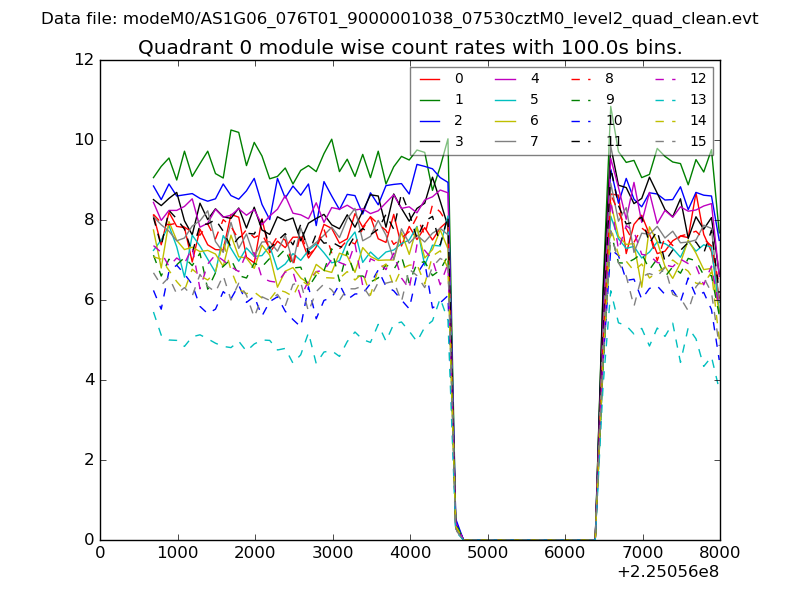 |
 |
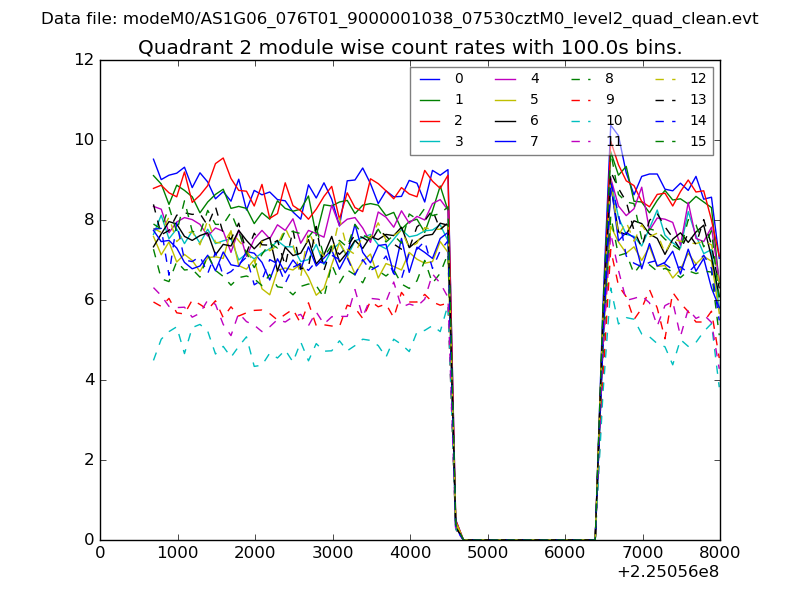
| Module-wise count rates for Quadrant B Data is divided into 100 sec bins |
 |
 |
| Module-wise count rates for Quadrant C Data is divided into 100 sec bins |
 |
 |
| Module-wise count rates for Quadrant D Data is divided into 100 sec bins |
 |
 |
| Parameter | Plot |
|---|---|
| CZT HV Monitor | 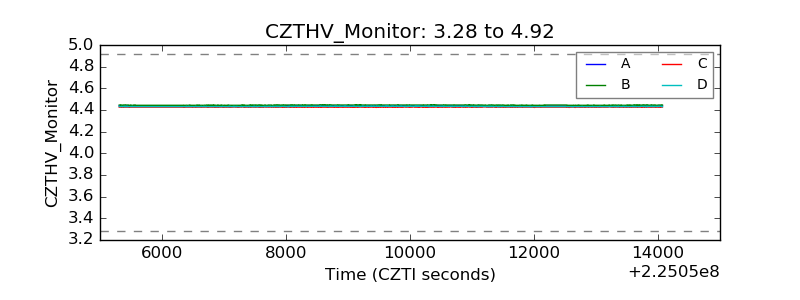 |
| D_VDD | 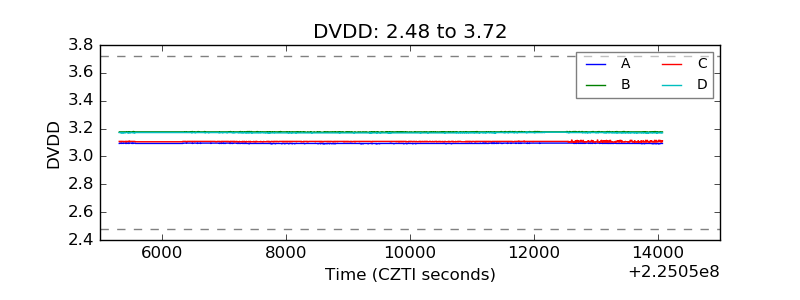 |
| Temperature 1 | 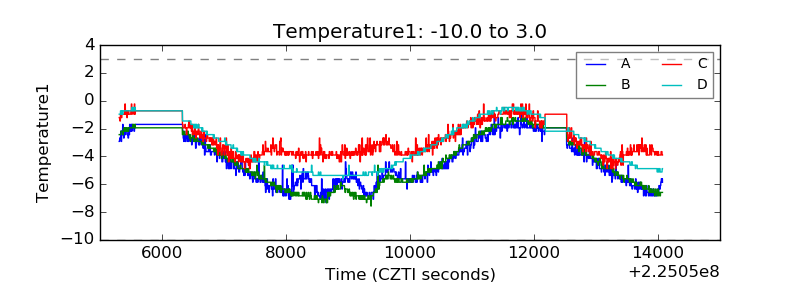 |
| Veto HV Monitor | 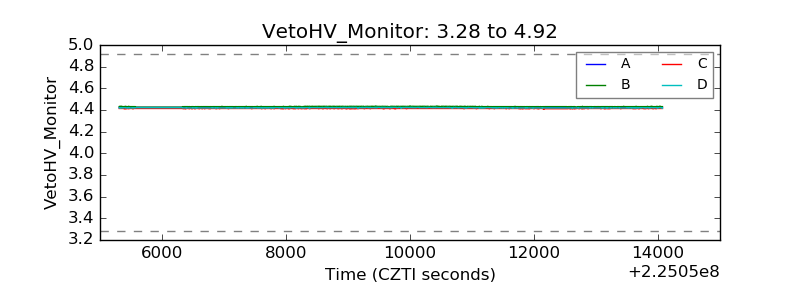 |
| Veto LLD | 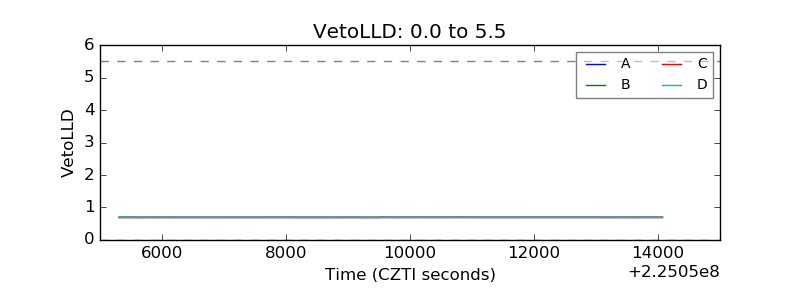 |
| Alpha Counter | 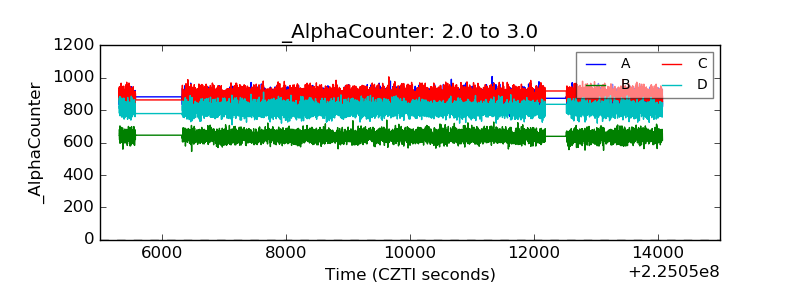 |
| _CPM_Rate | 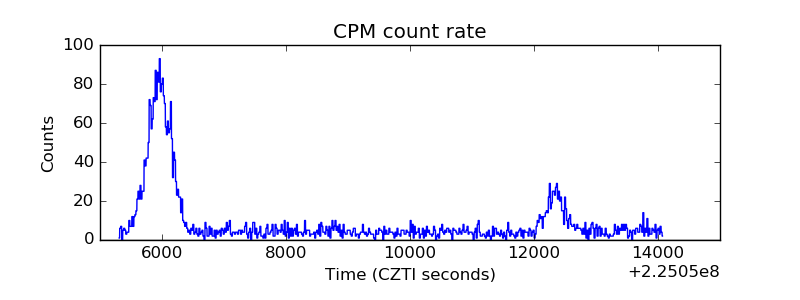 |
| CZT Counter | 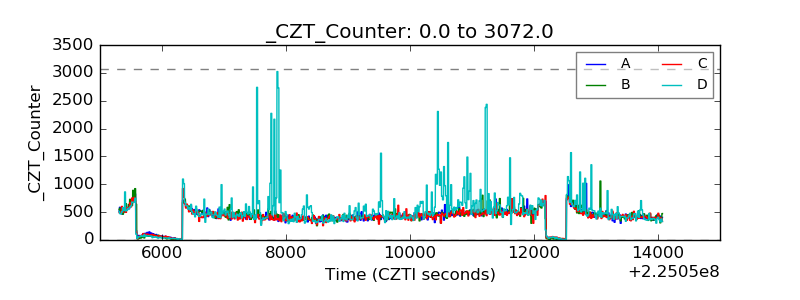 |
| +2.5 Volts monitor | 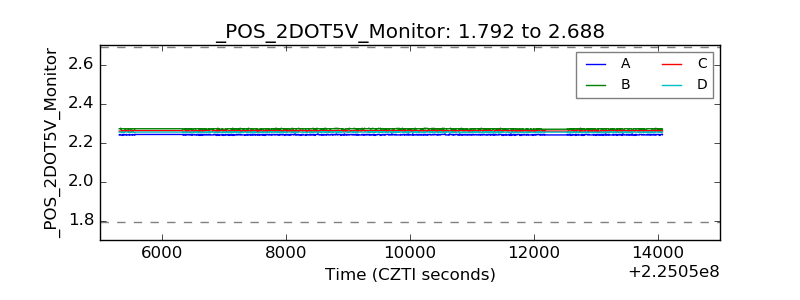 |
| +5 Volts monitor | 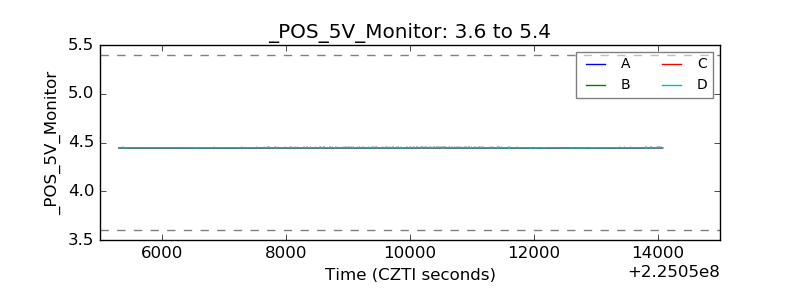 |
| _ROLL_ROT | 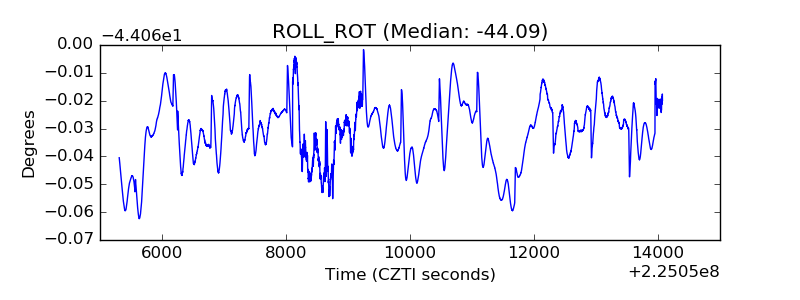 |
| _Roll_DEC | 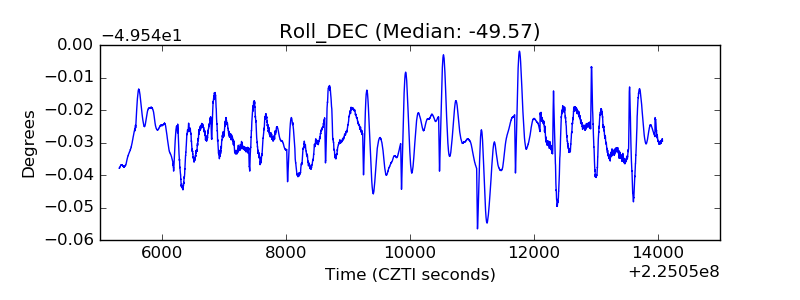 |
| _Roll_RA | 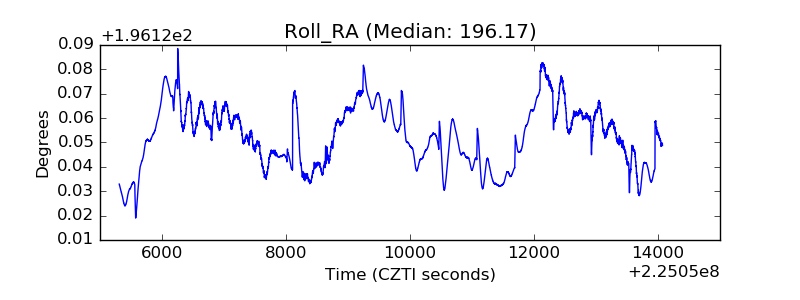 |
| Veto Counter | 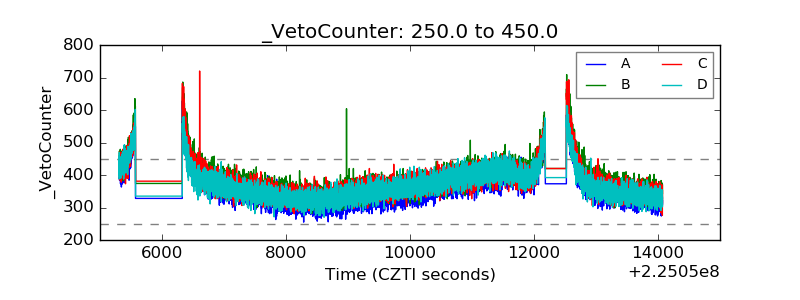 |