| Param | Original file | Final file |
|---|---|---|
| Filename | modeM0/AS1G06_076T01_9000001038_07531cztM0_level2.evt | modeM0/AS1G06_076T01_9000001038_07531cztM0_level2_quad_clean.evt |
| Size (bytes) | 490,642,560 | 102,565,440 |
| Size | 467.9 MB | 97.8 MB |
| Events in quadrant A | 3,421,371 | 651,429 |
| Events in quadrant B | 3,602,630 | 666,974 |
| Events in quadrant C | 3,421,718 | 646,669 |
| Events in quadrant D | 3,900,616 | 616,066 |
| Mode M9 | |||
|---|---|---|---|
| Quadrant | BADHDUFLAG | Total packets | Discarded packets |
| A | 0 | 7 | 0 |
| B | 0 | 7 | 0 |
| C | 0 | 7 | 0 |
| D | 0 | 7 | 0 |
| Mode M0 | |||
|---|---|---|---|
| Quadrant | BADHDUFLAG | Total packets | Discarded packets |
| A | 0 | 15536 | 3 |
| B | 0 | 15944 | 2 |
| C | 0 | 15581 | 2 |
| D | 0 | 17146 | 2 |
| Mode SS | |||
|---|---|---|---|
| Quadrant | BADHDUFLAG | Total packets | Discarded packets |
| A | 0 | 154 | 0 |
| B | 0 | 154 | 0 |
| C | 0 | 154 | 0 |
| D | 0 | 154 | 0 |
| Quadrant | Total seconds | Saturated seconds | Saturation percentage |
|---|---|---|---|
| A | 7556 | 54 | 0.714664% |
| B | 7556 | 81 | 1.071996% |
| C | 7556 | 33 | 0.436739% |
| D | 7556 | 98 | 1.296983% |
Noise dominated data is calculated using 1-second bins in cleaned event files. If a bin has >2000 counts, and if more than 50% of those come from <1% of pixels, then it is considered to be noise-dominated and hence unusable.
| Quadrant | # 1 sec bins | Bins with >0 counts | Bins with >2000 counts | High rate bins dominated by noise | Noise dominated (total time) | Noise dominated (detector-on time) | Marked lightcurve |
|---|---|---|---|---|---|---|---|
| A | 8146 | 7559 | 0 | 0 | 0.00% | 0.00% | 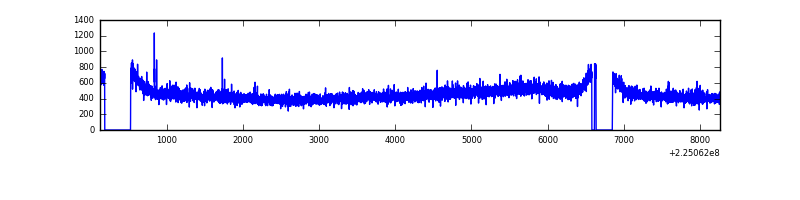 |
| B | 8146 | 7559 | 4 | 4 | 0.05% | 0.05% | 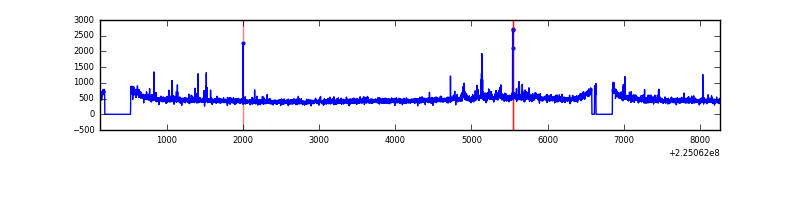 |
| C | 8146 | 7559 | 3 | 3 | 0.04% | 0.04% | 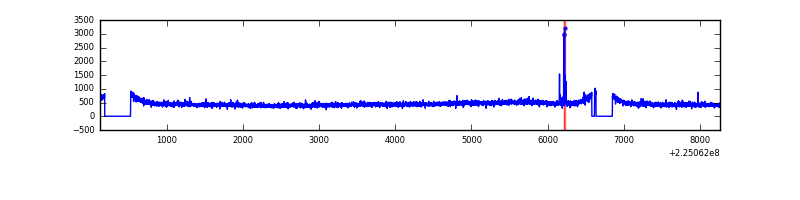 |
| D | 8146 | 7559 | 60 | 60 | 0.74% | 0.79% | 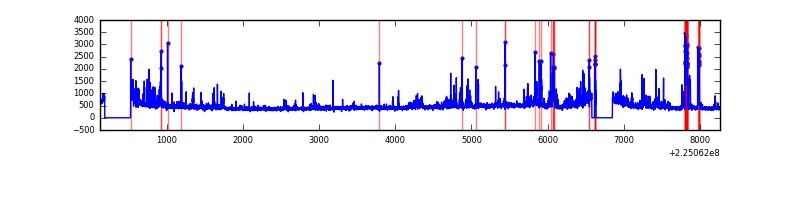 |
Top three noisy pixels from each quadrant. If the there are fewer than three noisy pixels in the level2.evt file, extra rows are filled as -1
| Pixel properties | Quadrant properties | ||||||
|---|---|---|---|---|---|---|---|
| Quadrant | DetID | PixID | Counts | Sigma | Mean | Median | Sigma |
| A | 13 | 14 | 27128 | 144.73 | 880 | 860 | 181.5 |
| A | 0 | 226 | 8595 | 42.62 | 880 | 860 | 181.5 |
| A | 12 | 194 | 7717 | 37.78 | 880 | 860 | 181.5 |
| B | 0 | 219 | 61898 | 355.23 | 893 | 868 | 171.8 |
| B | 4 | 173 | 18690 | 103.73 | 893 | 868 | 171.8 |
| B | 12 | 111 | 17070 | 94.3 | 893 | 868 | 171.8 |
| C | 1 | 16 | 29597 | 144.55 | 856 | 860 | 198.8 |
| C | 8 | 128 | 19219 | 92.35 | 856 | 860 | 198.8 |
| C | 8 | 229 | 13134 | 61.74 | 856 | 860 | 198.8 |
| D | 2 | 152 | 236917 | 1141.42 | 846 | 820 | 206.8 |
| D | 5 | 233 | 172055 | 827.84 | 846 | 820 | 206.8 |
| D | 2 | 136 | 57506 | 274.05 | 846 | 820 | 206.8 |
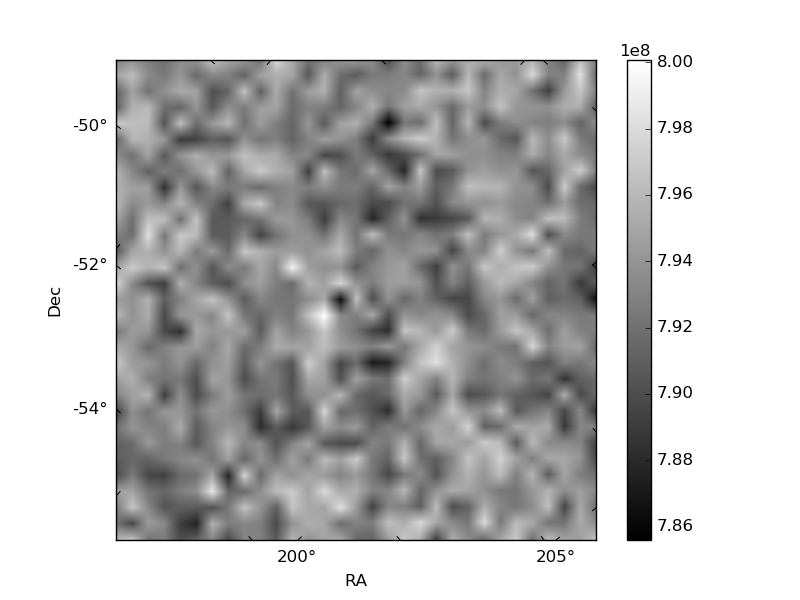
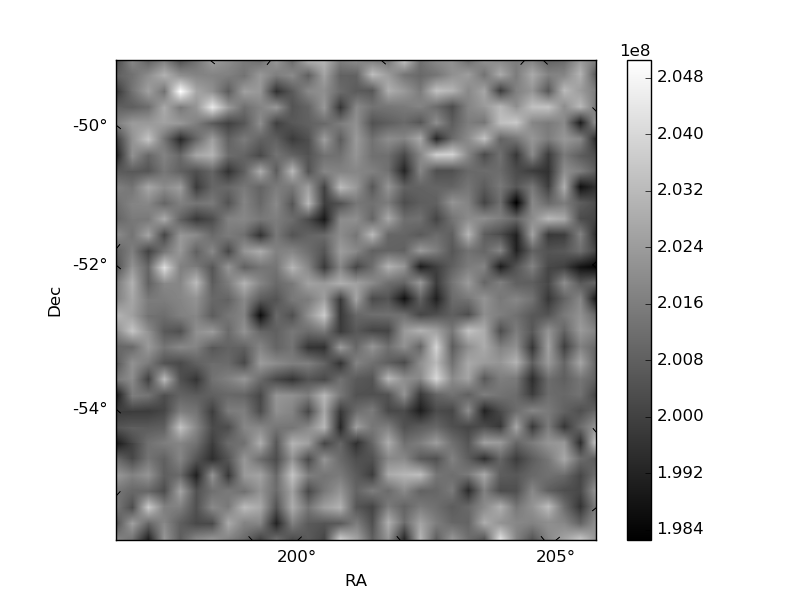
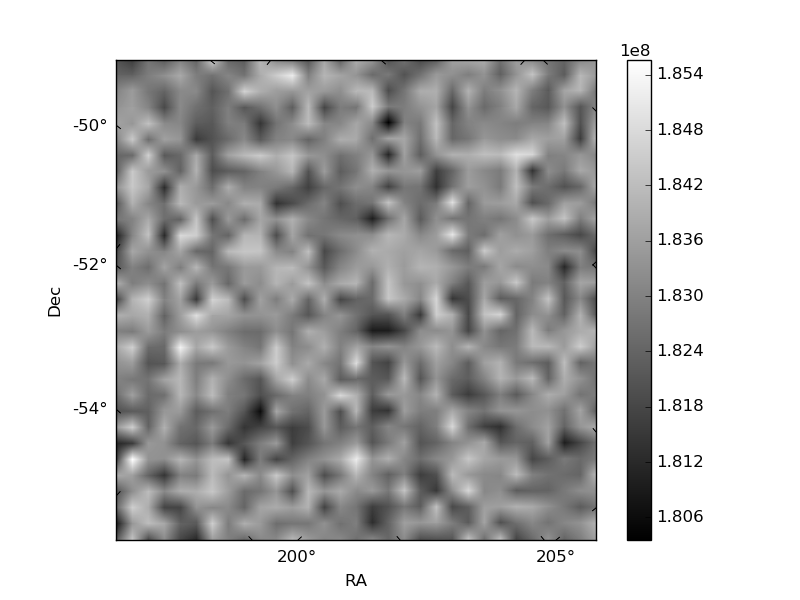
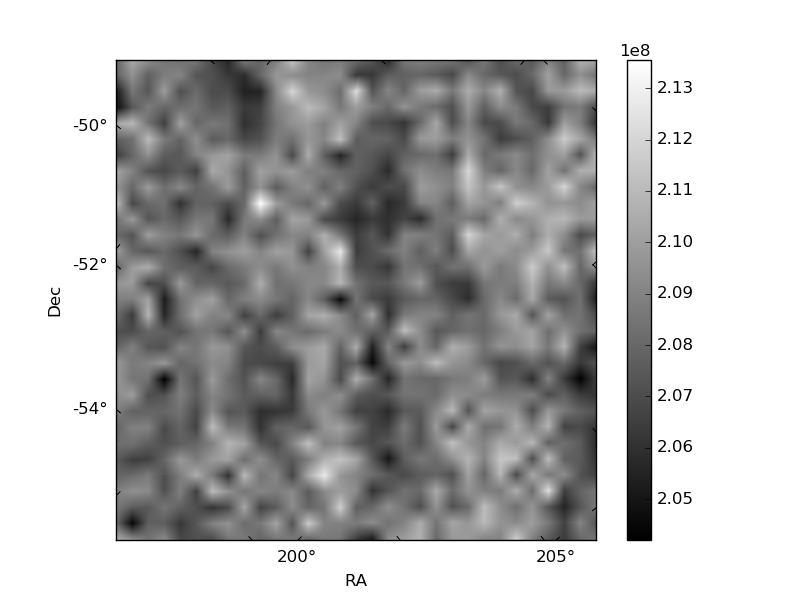
Histogram calculated using DETX and DETY for each event in the final _common_clean file
| Quadrant A | 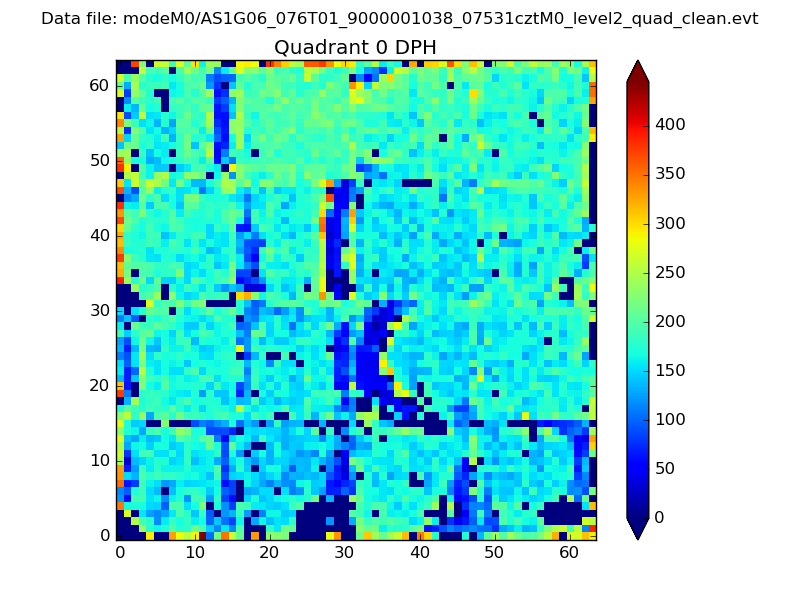 |
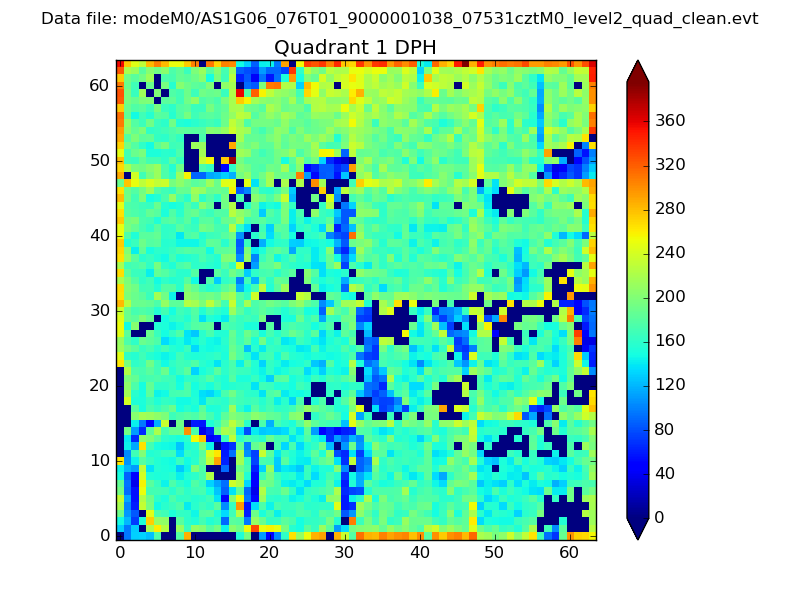 |
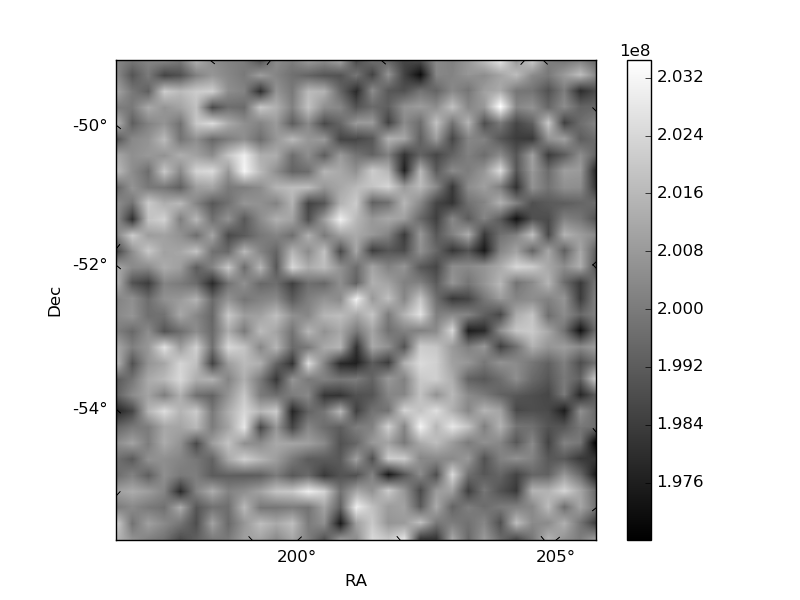
Quadrant B |
|---|---|---|---|
| Quadrant D | 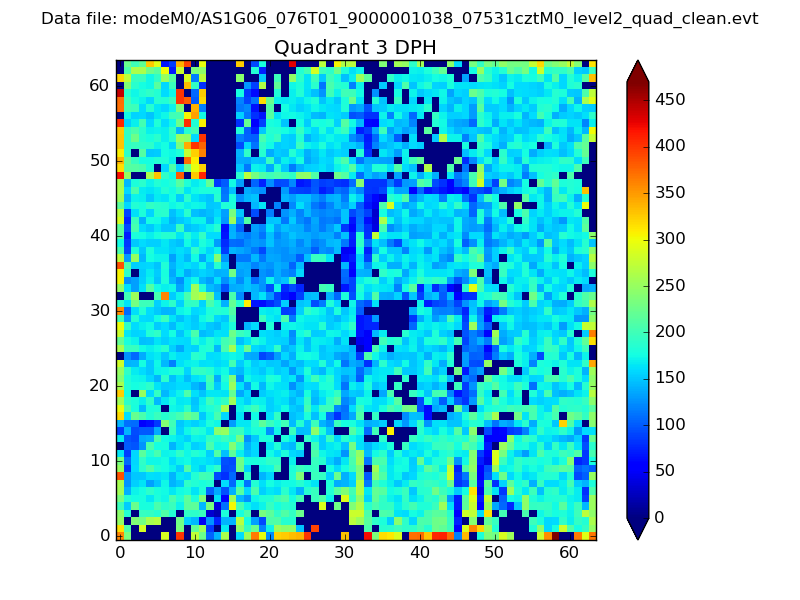 |
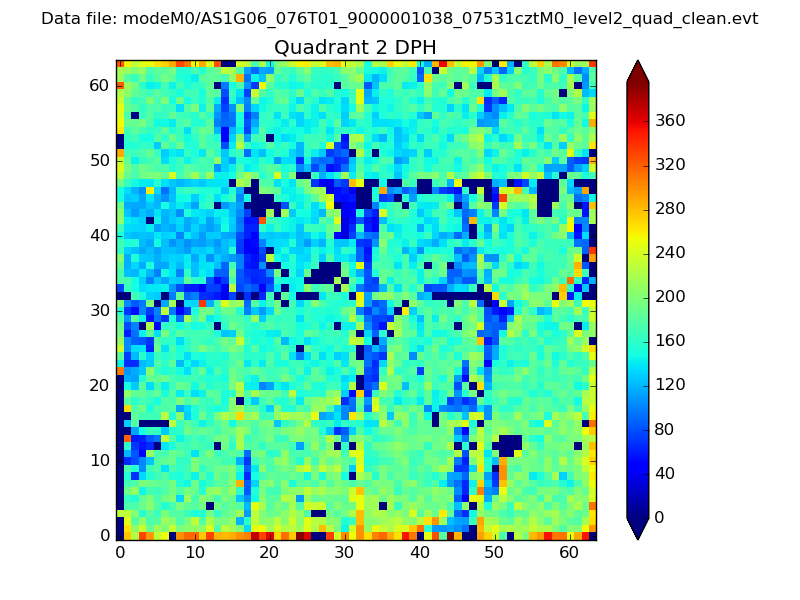 |
Quadrant C |
| Plot type | Count rate plots | Images |
|---|---|---|
| Comparison with Poisson distribution Blue bars denote a histogram of data divided into 1 sec bins. Red curve is a Poisson curve with rate = median count rate of data. |
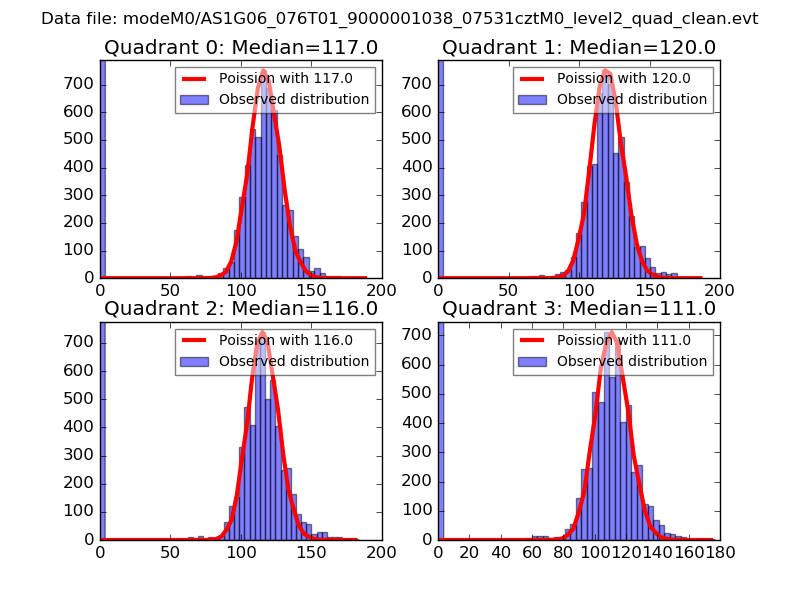 |
 |
| Quadrant-wise count rates Data is divided into 100 sec bins |
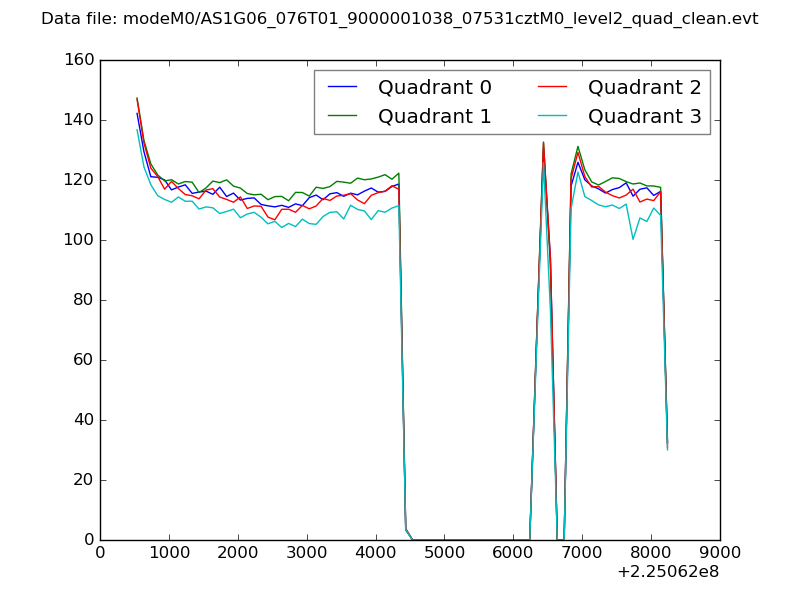 |
|
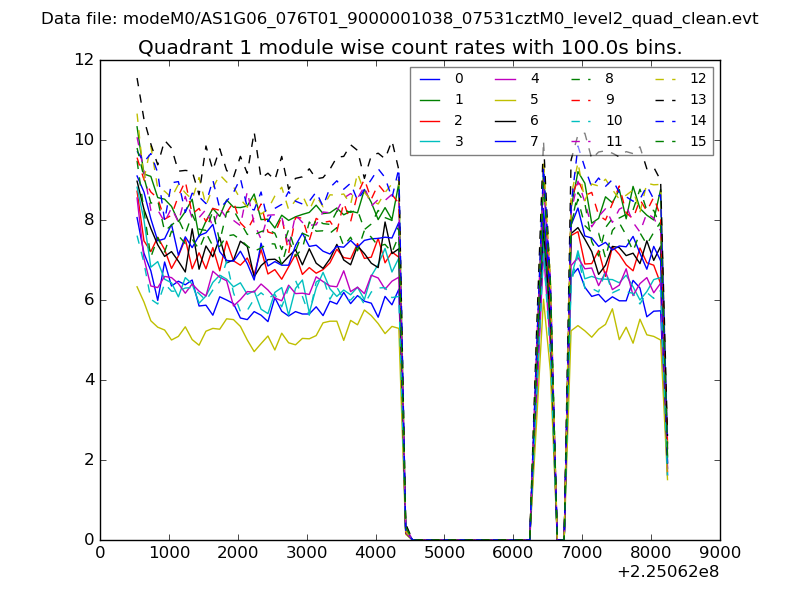
| Module-wise count rates for Quadrant A Data is divided into 100 sec bins |
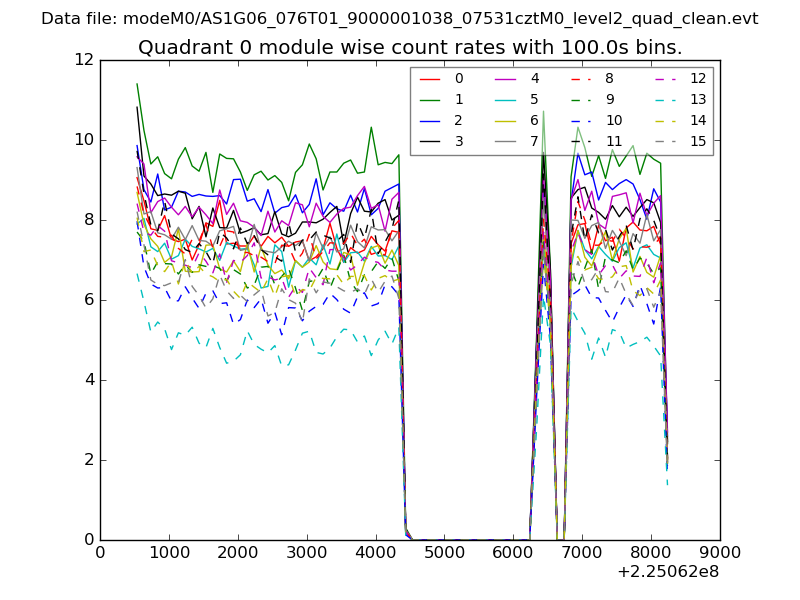 |
 |
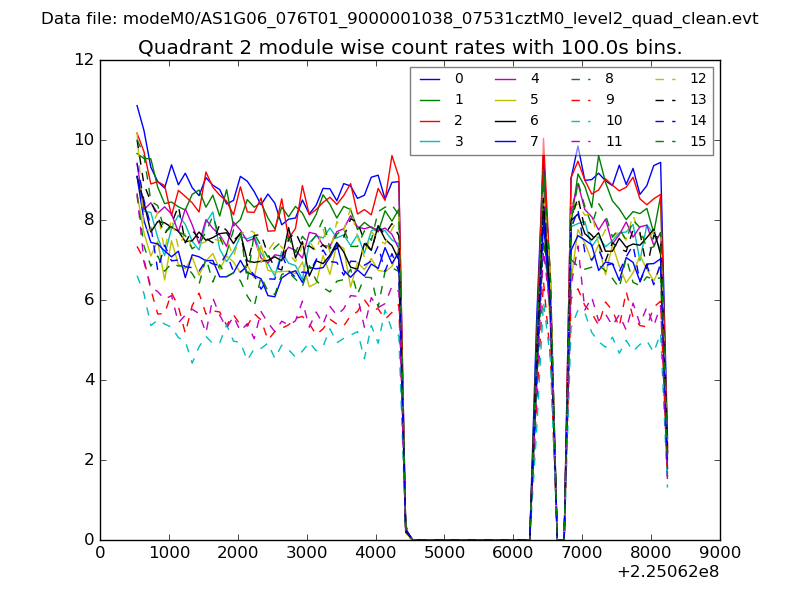
| Module-wise count rates for Quadrant B Data is divided into 100 sec bins |
 |
 |
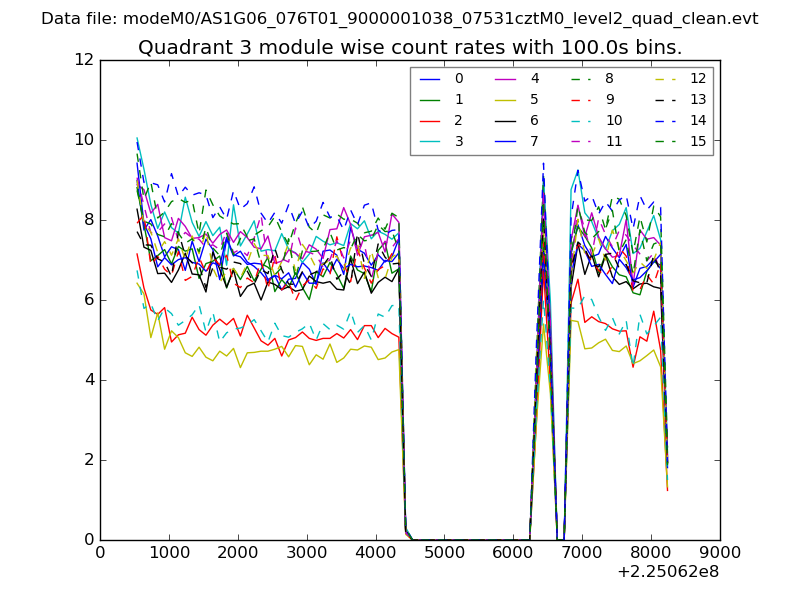
| Module-wise count rates for Quadrant C Data is divided into 100 sec bins |
 |
 |
| Module-wise count rates for Quadrant D Data is divided into 100 sec bins |
 |
 |
| Parameter | Plot |
|---|---|
| CZT HV Monitor | 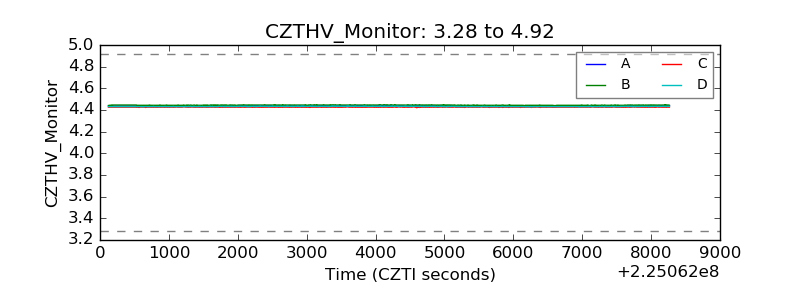 |
| D_VDD |  |
| Temperature 1 | 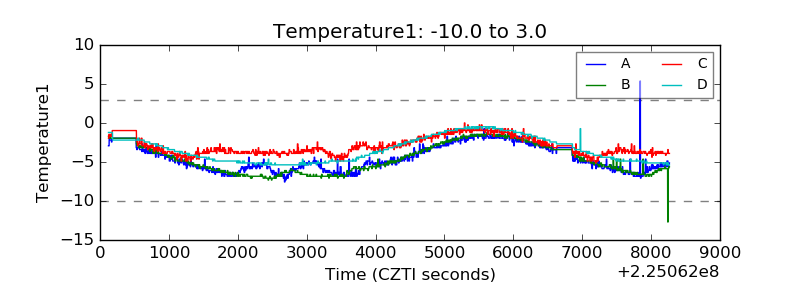 |
| Veto HV Monitor | 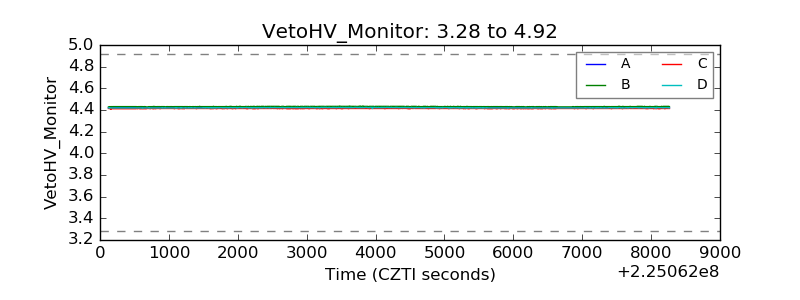 |
| Veto LLD |  |
| Alpha Counter | 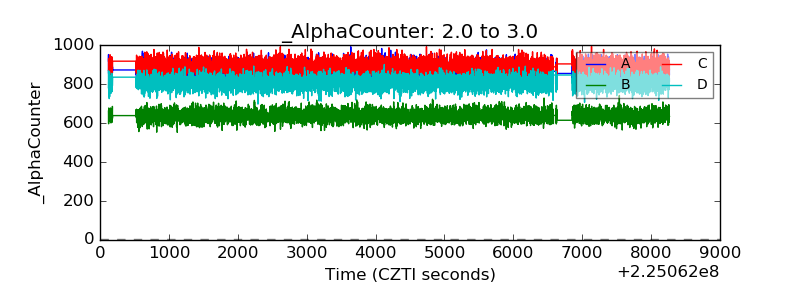 |
| _CPM_Rate | 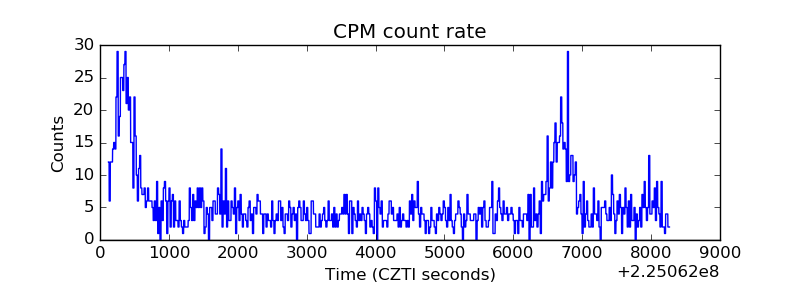 |
| CZT Counter | 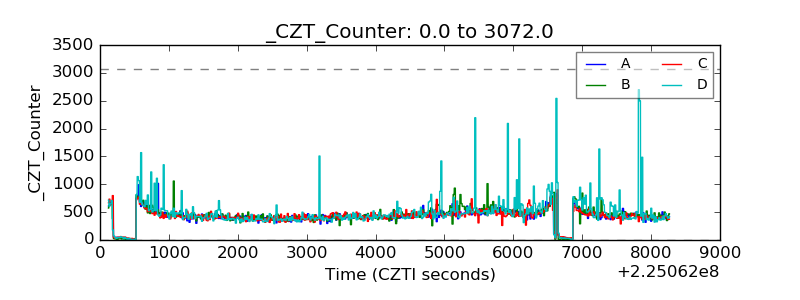 |
| +2.5 Volts monitor |  |
| +5 Volts monitor |  |
| _ROLL_ROT | 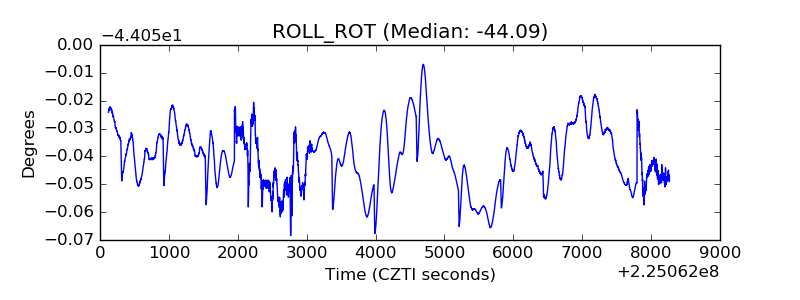 |
| _Roll_DEC | 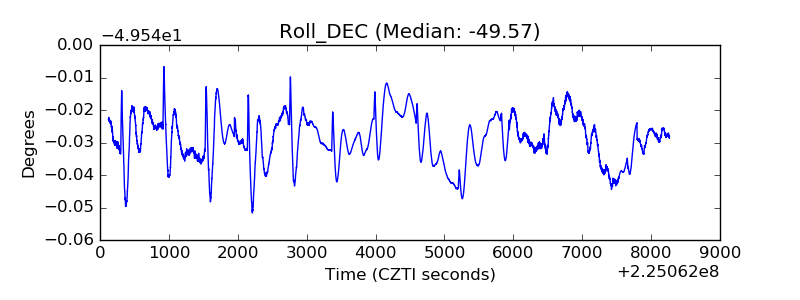 |
| _Roll_RA | 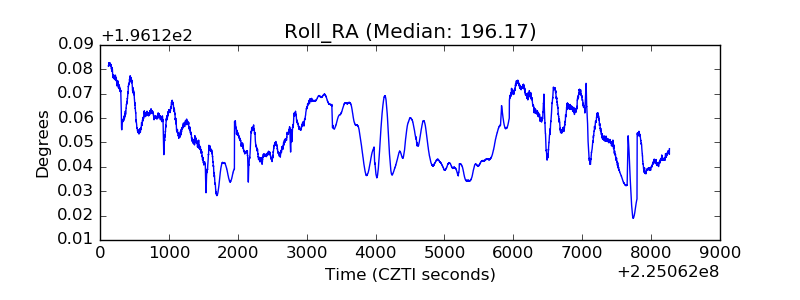 |
| Veto Counter | 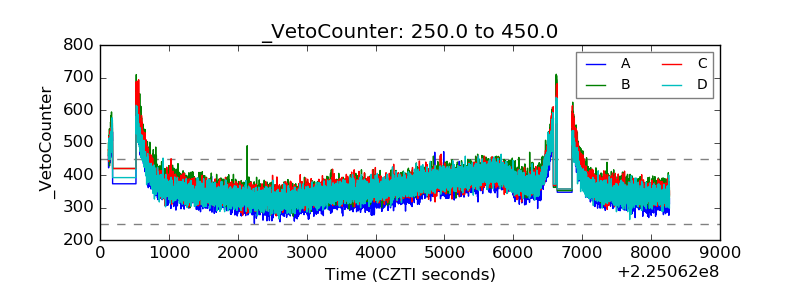 |