| Param | Original file | Final file |
|---|---|---|
| Filename | modeM0/AS1G06_076T01_9000001038_07534cztM0_level2.evt | modeM0/AS1G06_076T01_9000001038_07534cztM0_level2_quad_clean.evt |
| Size (bytes) | 295,683,840 | 66,533,760 |
| Size | 282.0 MB | 63.5 MB |
| Events in quadrant A | 2,047,730 | 425,870 |
| Events in quadrant B | 2,132,036 | 436,926 |
| Events in quadrant C | 2,082,175 | 420,623 |
| Events in quadrant D | 2,370,966 | 400,192 |
| Mode M9 | |||
|---|---|---|---|
| Quadrant | BADHDUFLAG | Total packets | Discarded packets |
| A | 0 | 3 | 0 |
| B | 0 | 3 | 0 |
| C | 0 | 3 | 0 |
| D | 0 | 3 | 0 |
| Mode M0 | |||
|---|---|---|---|
| Quadrant | BADHDUFLAG | Total packets | Discarded packets |
| A | 0 | 9612 | 2 |
| B | 0 | 9725 | 1 |
| C | 0 | 9640 | 1 |
| D | 0 | 10626 | 1 |
| Mode SS | |||
|---|---|---|---|
| Quadrant | BADHDUFLAG | Total packets | Discarded packets |
| A | 0 | 98 | 0 |
| B | 0 | 98 | 0 |
| C | 0 | 98 | 0 |
| D | 0 | 98 | 0 |
| Quadrant | Total seconds | Saturated seconds | Saturation percentage |
|---|---|---|---|
| A | 4714 | 27 | 0.572762% |
| B | 4714 | 43 | 0.912176% |
| C | 4714 | 19 | 0.403055% |
| D | 4714 | 77 | 1.633432% |
Noise dominated data is calculated using 1-second bins in cleaned event files. If a bin has >2000 counts, and if more than 50% of those come from <1% of pixels, then it is considered to be noise-dominated and hence unusable.
| Quadrant | # 1 sec bins | Bins with >0 counts | Bins with >2000 counts | High rate bins dominated by noise | Noise dominated (total time) | Noise dominated (detector-on time) | Marked lightcurve |
|---|---|---|---|---|---|---|---|
| A | 4964 | 4716 | 0 | 0 | 0.00% | 0.00% | 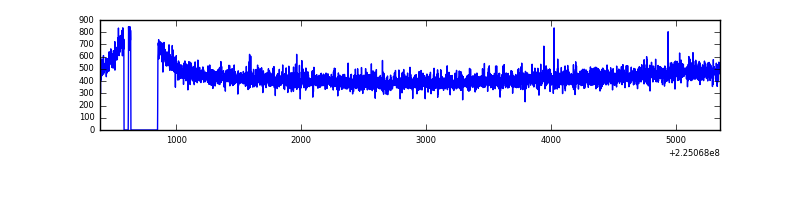 |
| B | 4964 | 4716 | 0 | 0 | 0.00% | 0.00% |  |
| C | 4964 | 4716 | 0 | 0 | 0.00% | 0.00% | 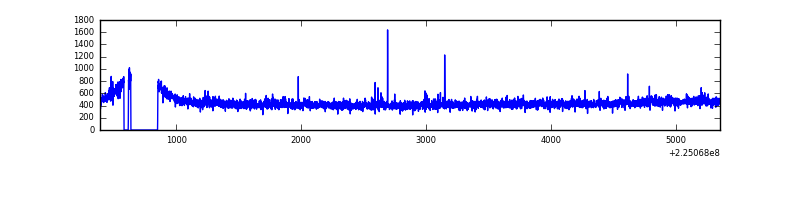 |
| D | 4964 | 4716 | 53 | 53 | 1.07% | 1.12% | 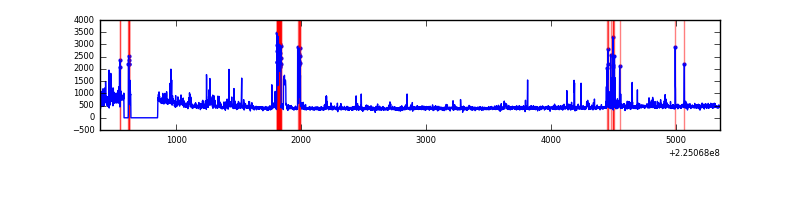 |
Top three noisy pixels from each quadrant. If the there are fewer than three noisy pixels in the level2.evt file, extra rows are filled as -1
| Pixel properties | Quadrant properties | ||||||
|---|---|---|---|---|---|---|---|
| Quadrant | DetID | PixID | Counts | Sigma | Mean | Median | Sigma |
| A | 13 | 14 | 8813 | 75.18 | 530 | 516 | 110.4 |
| A | 0 | 226 | 4999 | 40.62 | 530 | 516 | 110.4 |
| A | 12 | 194 | 4588 | 36.9 | 530 | 516 | 110.4 |
| B | 4 | 173 | 15225 | 140.67 | 539 | 525 | 104.5 |
| B | 0 | 214 | 10808 | 98.4 | 539 | 525 | 104.5 |
| B | 12 | 111 | 10557 | 96.0 | 539 | 525 | 104.5 |
| C | 8 | 229 | 18891 | 150.39 | 522 | 525 | 122.1 |
| C | 8 | 128 | 10799 | 84.13 | 522 | 525 | 122.1 |
| C | 8 | 112 | 4775 | 34.8 | 522 | 525 | 122.1 |
| D | 5 | 233 | 156279 | 1236.76 | 513 | 497 | 126.0 |
| D | 2 | 152 | 87851 | 693.51 | 513 | 497 | 126.0 |
| D | 14 | 34 | 74150 | 584.74 | 513 | 497 | 126.0 |
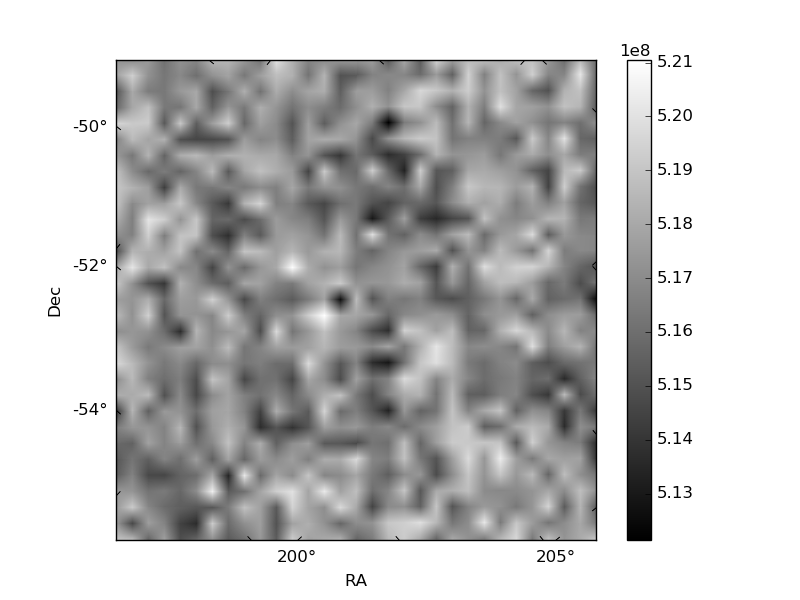
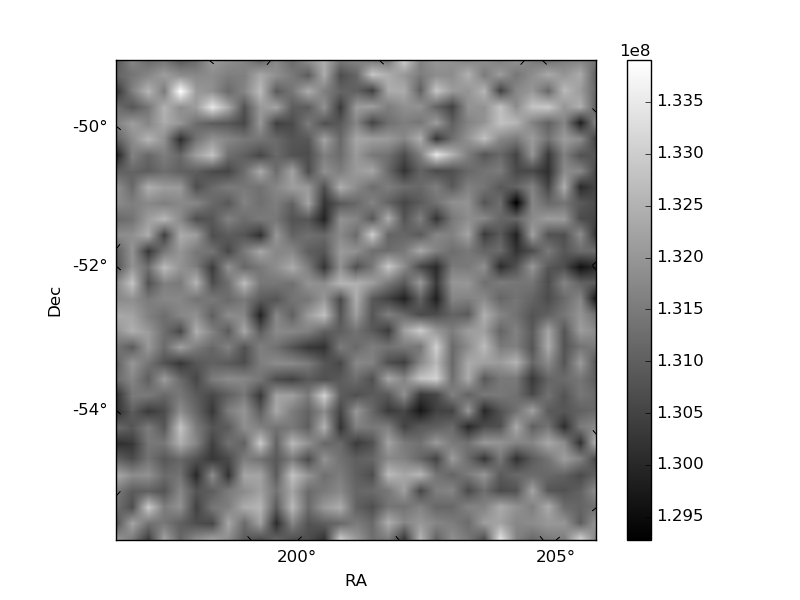
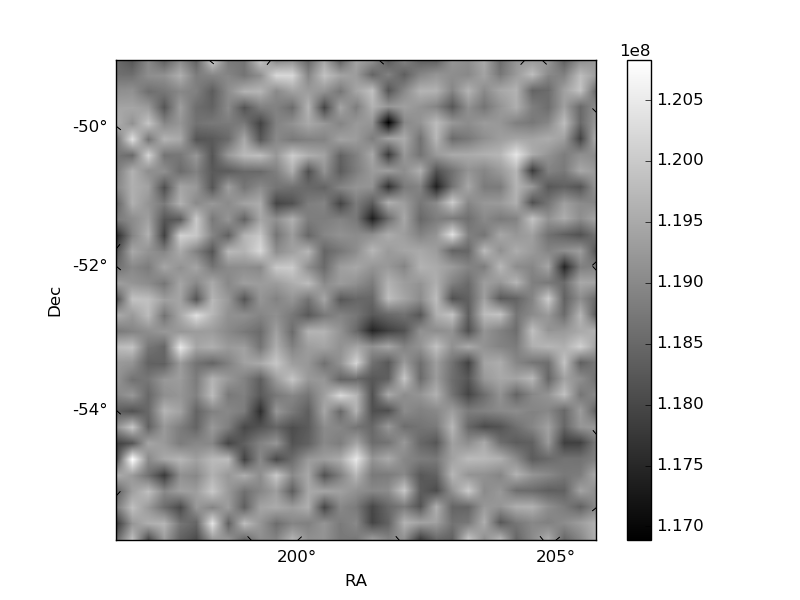
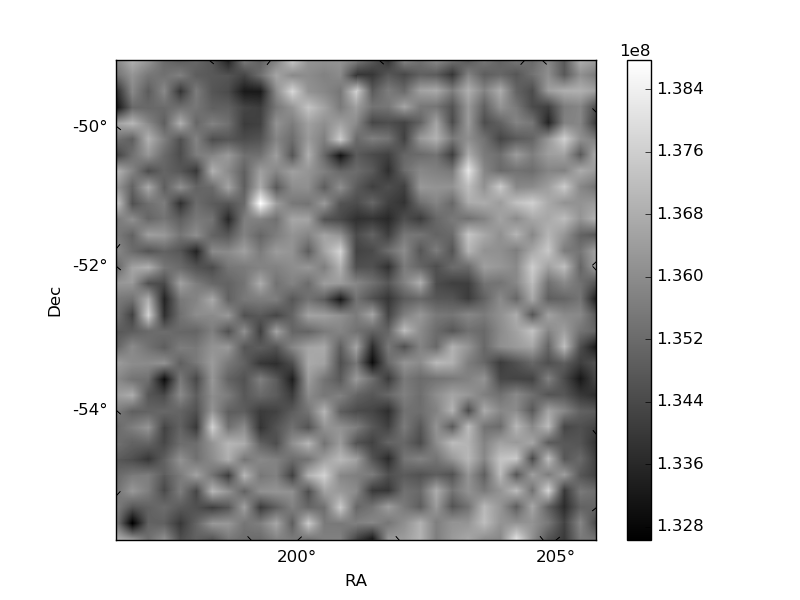
Histogram calculated using DETX and DETY for each event in the final _common_clean file
| Quadrant A |  |
 |
Quadrant B |
|---|---|---|---|
| Quadrant D | 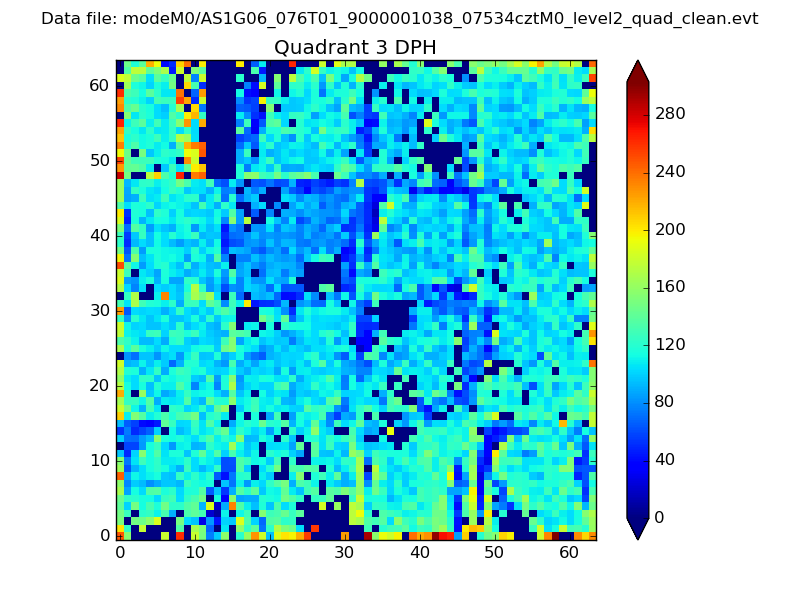 |
 |
Quadrant C |
| Plot type | Count rate plots | Images |
|---|---|---|
| Comparison with Poisson distribution Blue bars denote a histogram of data divided into 1 sec bins. Red curve is a Poisson curve with rate = median count rate of data. |
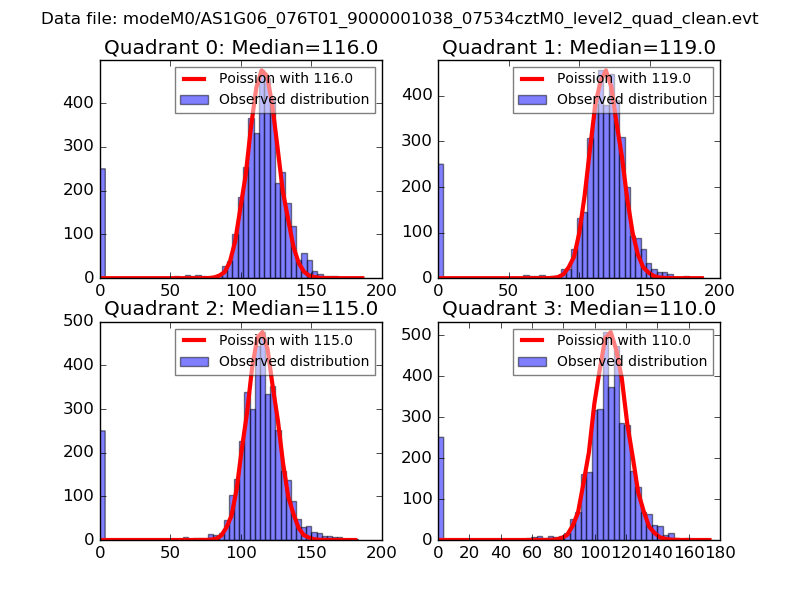 |
 |
| Quadrant-wise count rates Data is divided into 100 sec bins |
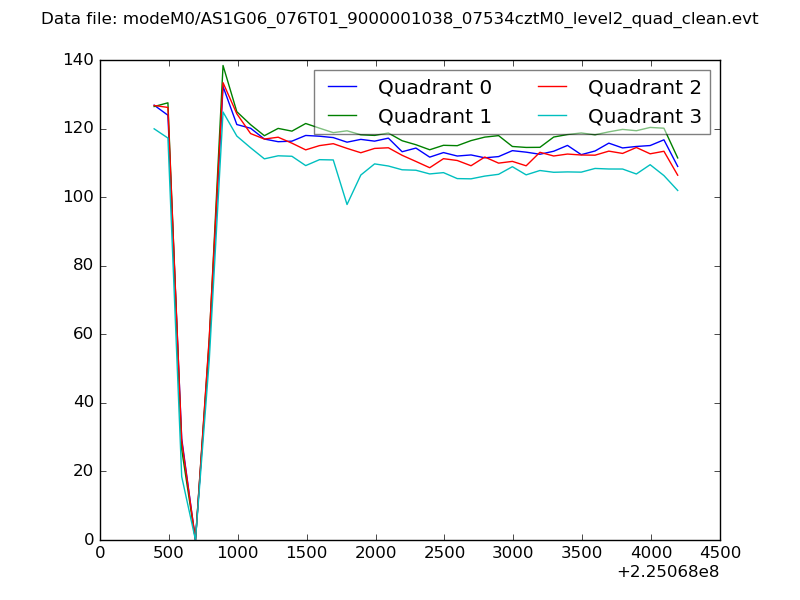 |
|
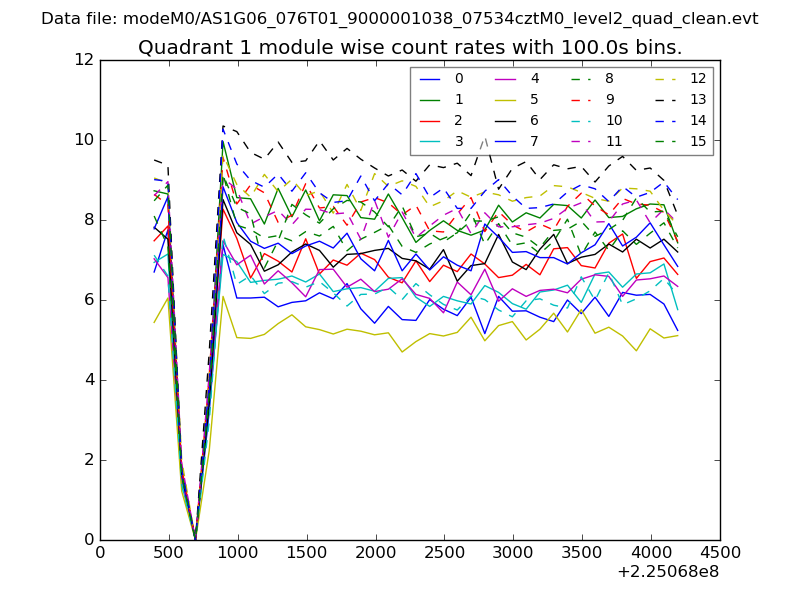
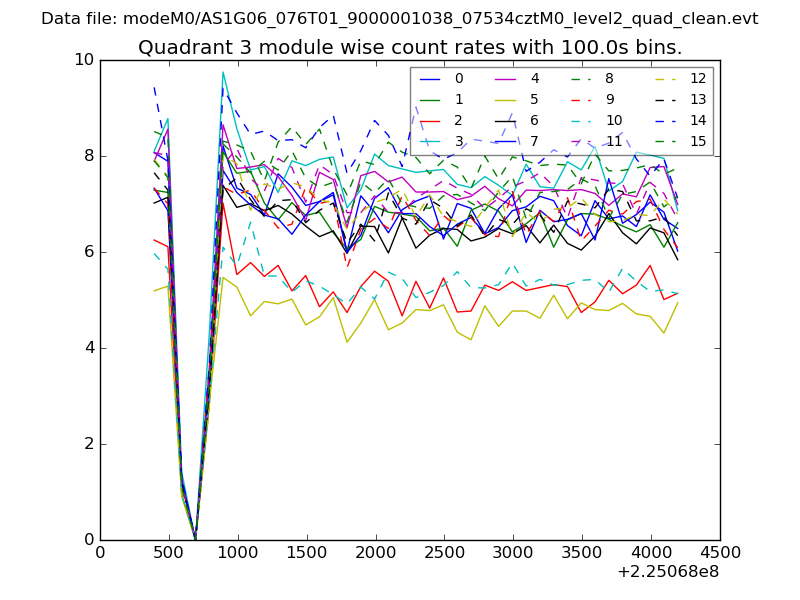
| Module-wise count rates for Quadrant A Data is divided into 100 sec bins |
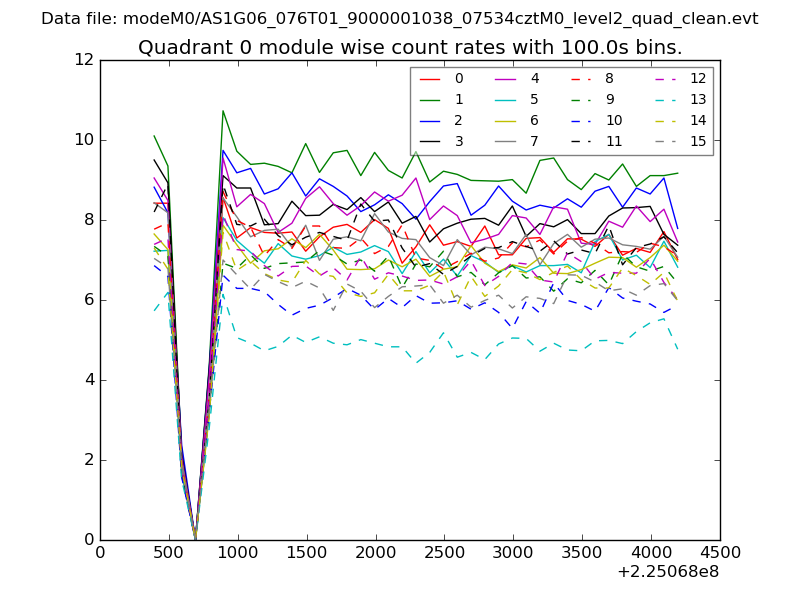 |
 |
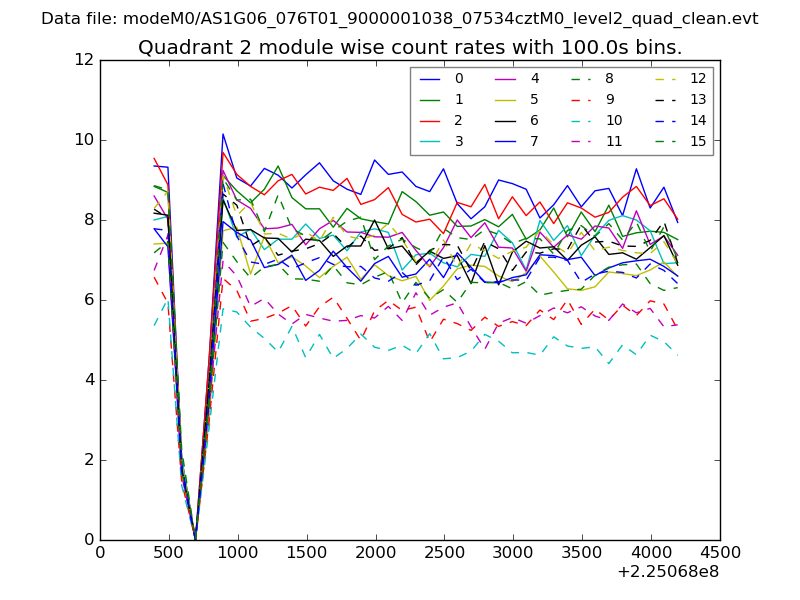
| Module-wise count rates for Quadrant B Data is divided into 100 sec bins |
 |
 |
| Module-wise count rates for Quadrant C Data is divided into 100 sec bins |
 |
 |
| Module-wise count rates for Quadrant D Data is divided into 100 sec bins |
 |
 |
| Parameter | Plot |
|---|---|
| CZT HV Monitor | 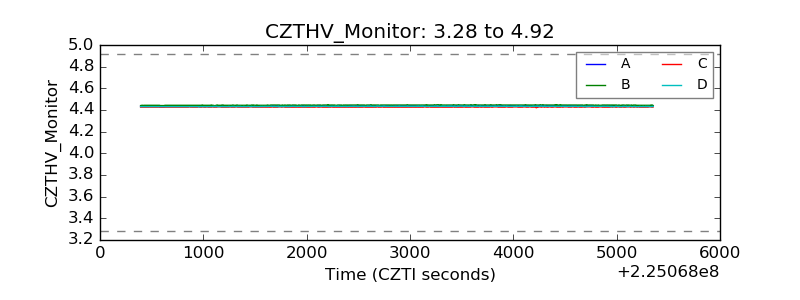 |
| D_VDD | 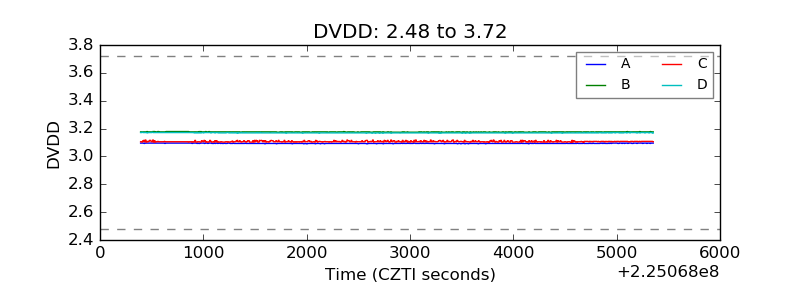 |
| Temperature 1 | 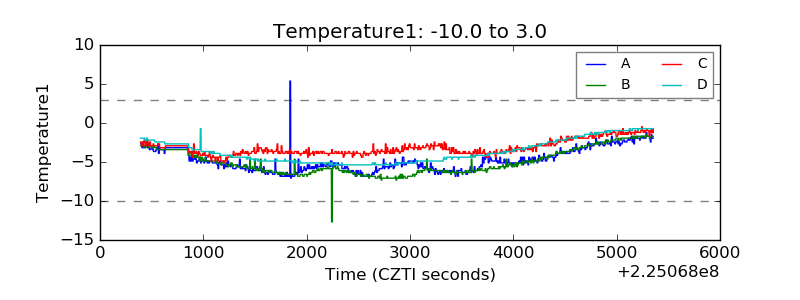 |
| Veto HV Monitor | 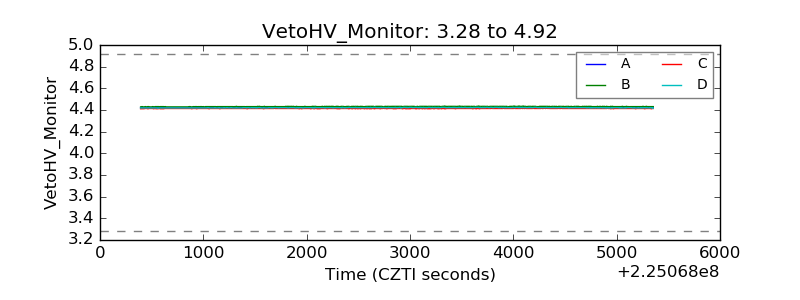 |
| Veto LLD | 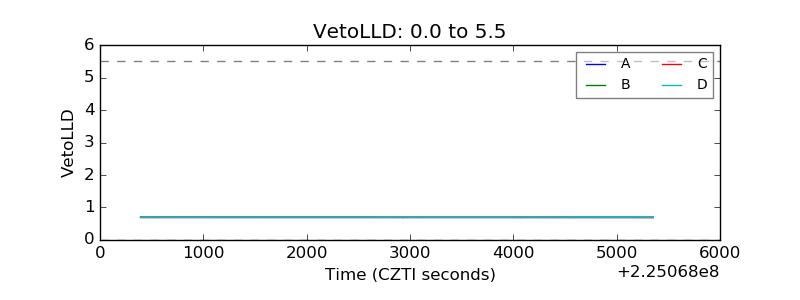 |
| Alpha Counter | 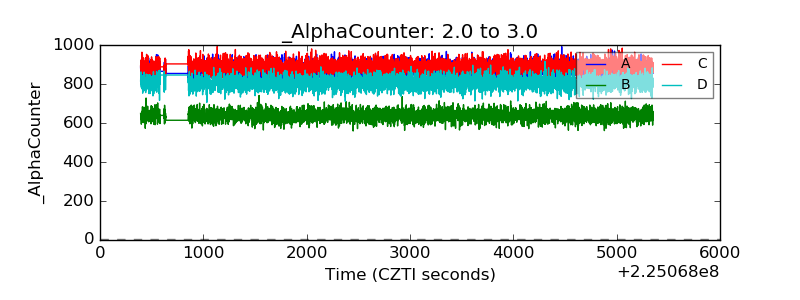 |
| _CPM_Rate | 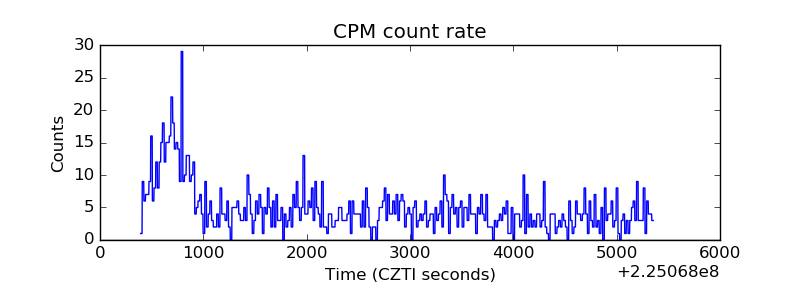 |
| CZT Counter | 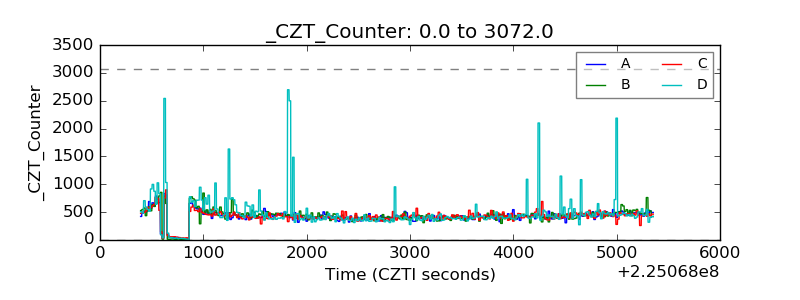 |
| +2.5 Volts monitor |  |
| +5 Volts monitor | 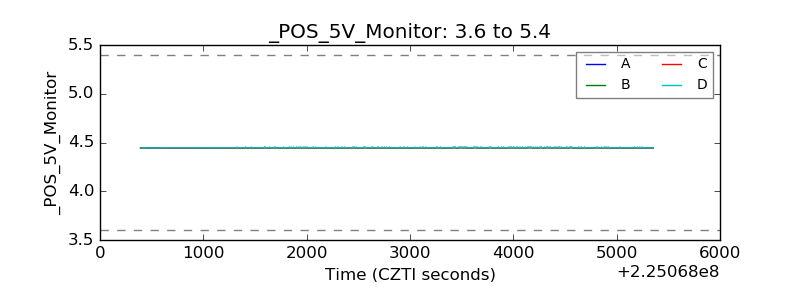 |
| _ROLL_ROT | 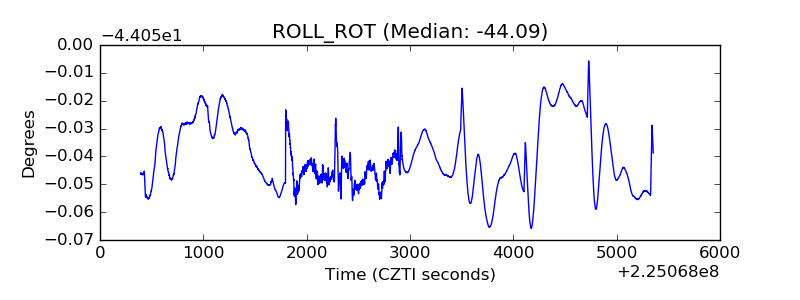 |
| _Roll_DEC | 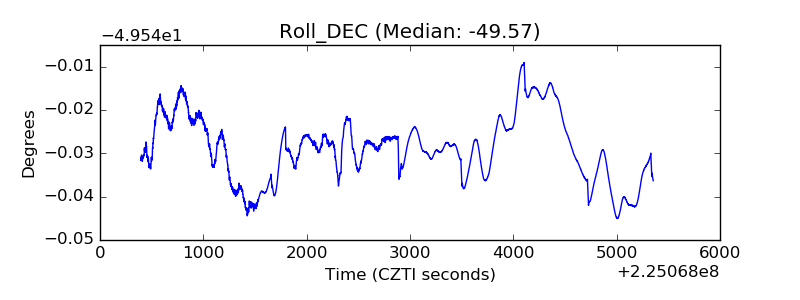 |
| _Roll_RA | 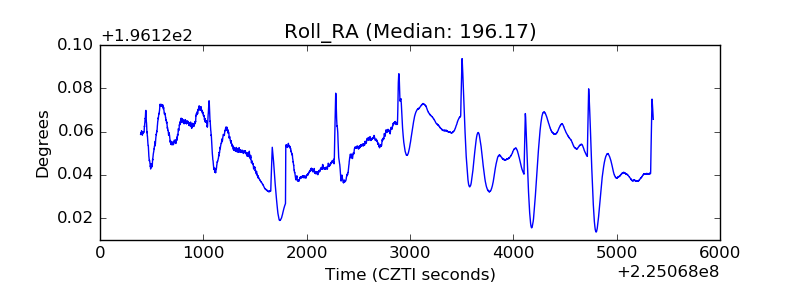 |
| Veto Counter | 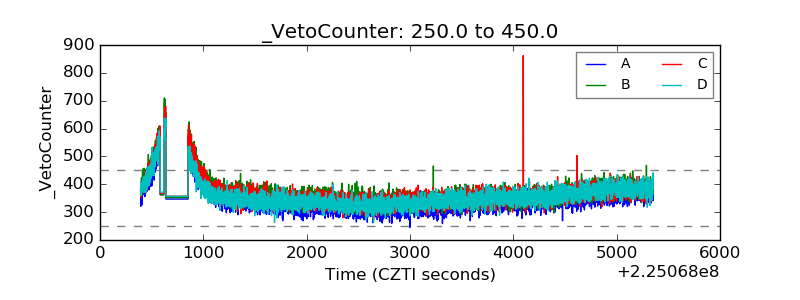 |