| Param | Original file | Final file |
|---|---|---|
| Filename | modeM0/AS1G06_076T01_9000001038_07535cztM0_level2.evt | modeM0/AS1G06_076T01_9000001038_07535cztM0_level2_quad_clean.evt |
| Size (bytes) | 1,368,624,960 | 252,685,440 |
| Size | 1.3 GB | 241.0 MB |
| Events in quadrant A | 9,399,856 | 1,584,256 |
| Events in quadrant B | 9,688,562 | 1,613,322 |
| Events in quadrant C | 10,646,282 | 1,531,217 |
| Events in quadrant D | 10,301,771 | 1,486,523 |
| Mode M9 | |||
|---|---|---|---|
| Quadrant | BADHDUFLAG | Total packets | Discarded packets |
| A | 0 | 24 | 0 |
| B | 0 | 24 | 0 |
| C | 0 | 24 | 0 |
| D | 0 | 24 | 0 |
| Mode M0 | |||
|---|---|---|---|
| Quadrant | BADHDUFLAG | Total packets | Discarded packets |
| A | 0 | 42251 | 9 |
| B | 0 | 42676 | 10 |
| C | 0 | 46032 | 8 |
| D | 0 | 45537 | 6 |
| Mode SS | |||
|---|---|---|---|
| Quadrant | BADHDUFLAG | Total packets | Discarded packets |
| A | 0 | 428 | 0 |
| B | 0 | 428 | 0 |
| C | 0 | 428 | 0 |
| D | 0 | 428 | 0 |
| Quadrant | Total seconds | Saturated seconds | Saturation percentage |
|---|---|---|---|
| A | 20870 | 67 | 0.321035% |
| B | 20869 | 111 | 0.531889% |
| C | 20870 | 654 | 3.133685% |
| D | 20871 | 320 | 1.533228% |
Noise dominated data is calculated using 1-second bins in cleaned event files. If a bin has >2000 counts, and if more than 50% of those come from <1% of pixels, then it is considered to be noise-dominated and hence unusable.
| Quadrant | # 1 sec bins | Bins with >0 counts | Bins with >2000 counts | High rate bins dominated by noise | Noise dominated (total time) | Noise dominated (detector-on time) | Marked lightcurve |
|---|---|---|---|---|---|---|---|
| A | 23422 | 20876 | 2 | 2 | 0.01% | 0.01% | 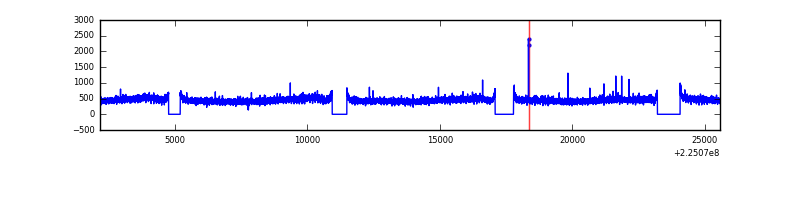 |
| B | 23422 | 20875 | 5 | 5 | 0.02% | 0.02% | 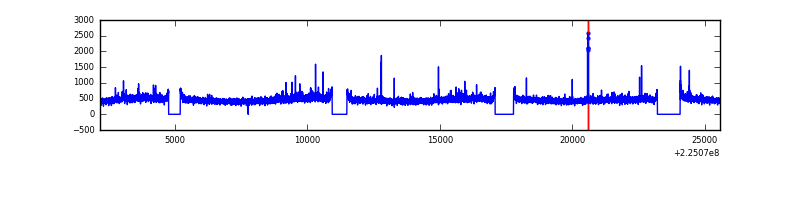 |
| C | 23422 | 20876 | 575 | 575 | 2.45% | 2.75% | 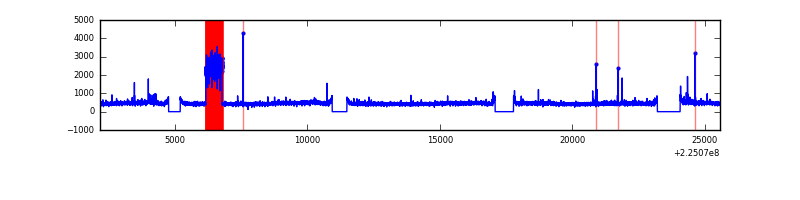 |
| D | 23422 | 20876 | 221 | 221 | 0.94% | 1.06% | 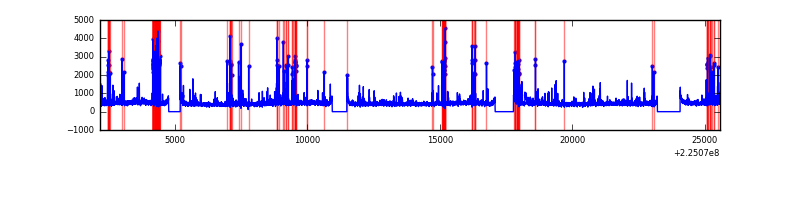 |
Top three noisy pixels from each quadrant. If the there are fewer than three noisy pixels in the level2.evt file, extra rows are filled as -1
| Pixel properties | Quadrant properties | ||||||
|---|---|---|---|---|---|---|---|
| Quadrant | DetID | PixID | Counts | Sigma | Mean | Median | Sigma |
| A | 13 | 14 | 36052 | 67.61 | 2432 | 2371 | 498.2 |
| A | 0 | 226 | 23170 | 41.75 | 2432 | 2371 | 498.2 |
| A | 12 | 194 | 21090 | 37.57 | 2432 | 2371 | 498.2 |
| B | 12 | 111 | 47631 | 97.67 | 2451 | 2389 | 463.2 |
| B | 0 | 219 | 47397 | 97.16 | 2451 | 2389 | 463.2 |
| B | 11 | 111 | 38427 | 77.8 | 2451 | 2389 | 463.2 |
| C | 9 | 68 | 1311489 | 2400.31 | 2354 | 2359 | 545.4 |
| C | 1 | 16 | 79459 | 141.36 | 2354 | 2359 | 545.4 |
| C | 8 | 229 | 25590 | 42.59 | 2354 | 2359 | 545.4 |
| D | 2 | 152 | 599681 | 1038.13 | 2356 | 2277 | 575.5 |
| D | 12 | 221 | 243871 | 419.83 | 2356 | 2277 | 575.5 |
| D | 2 | 14 | 196525 | 337.55 | 2356 | 2277 | 575.5 |
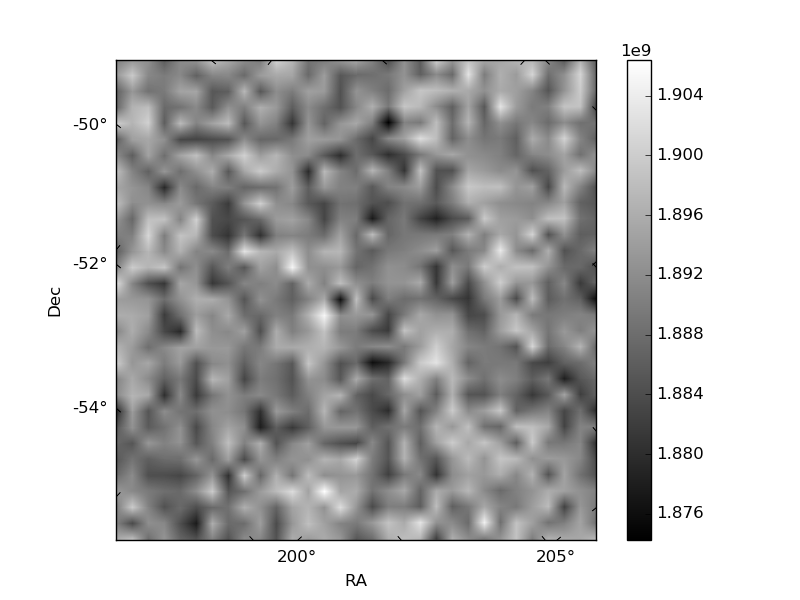
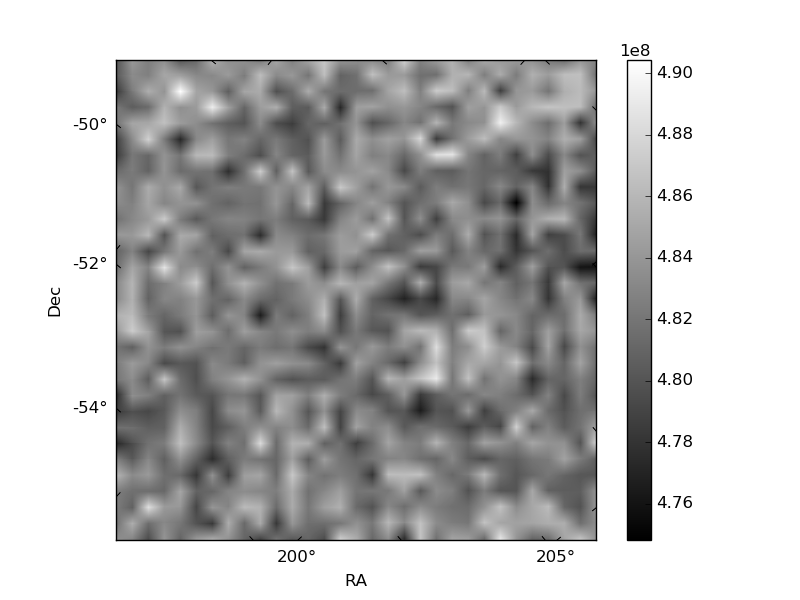
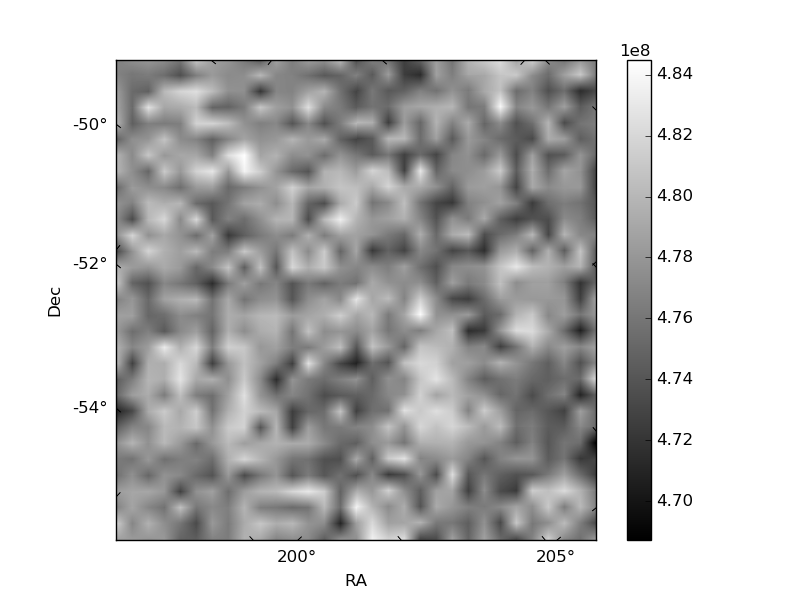
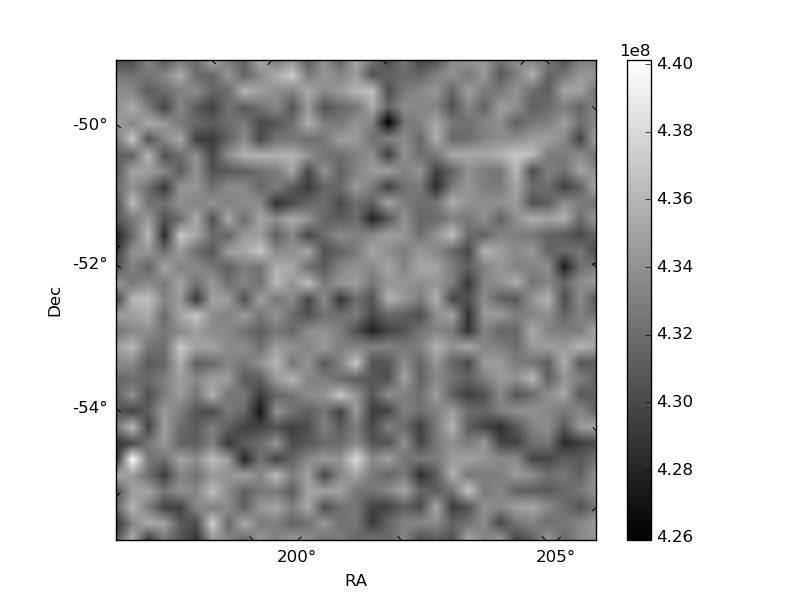
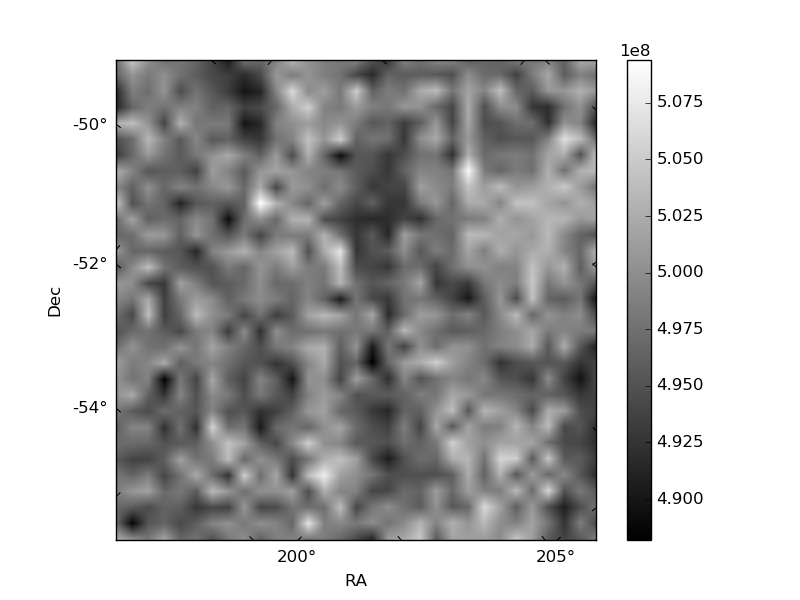
Histogram calculated using DETX and DETY for each event in the final _common_clean file
| Quadrant A | 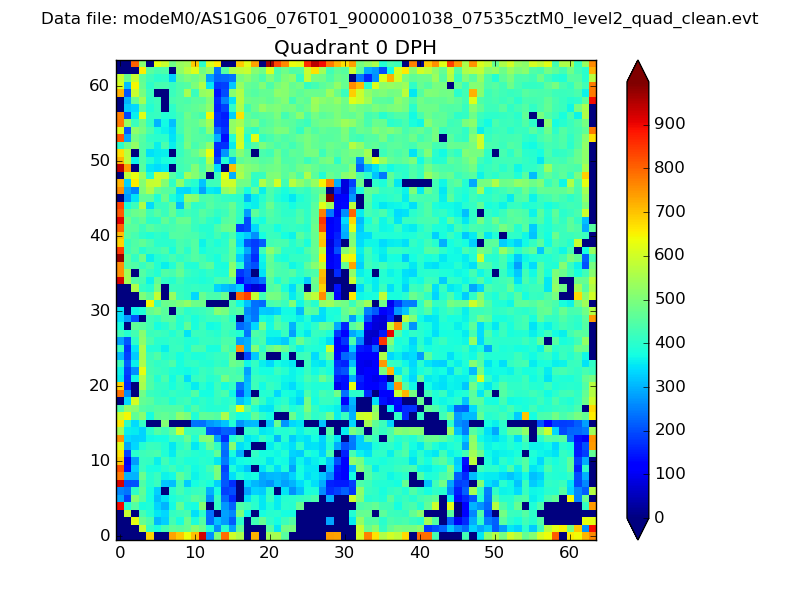 |
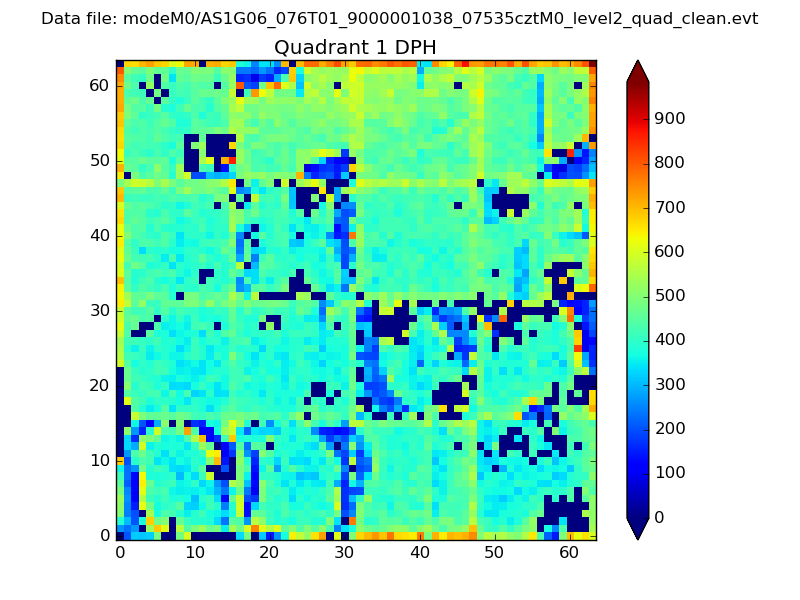 |
Quadrant B |
|---|---|---|---|
| Quadrant D | 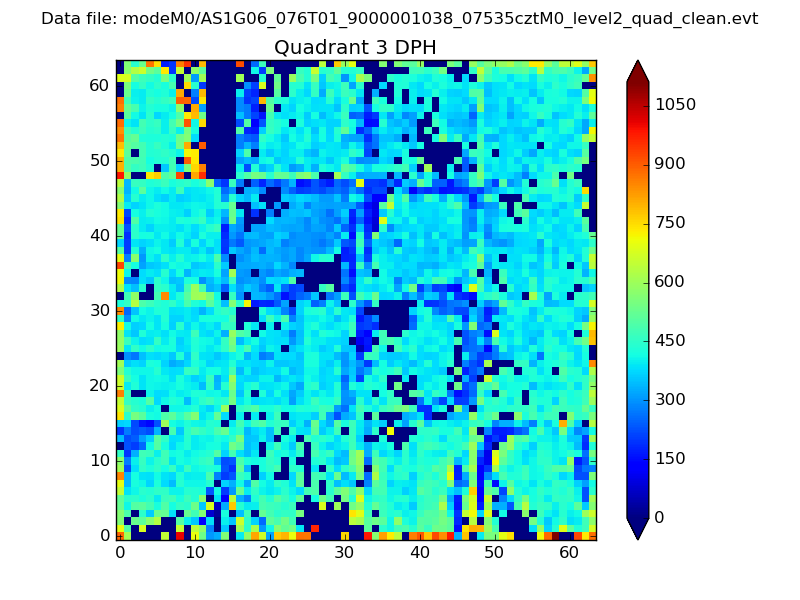 |
 |
Quadrant C |
| Plot type | Count rate plots | Images |
|---|---|---|
| Comparison with Poisson distribution Blue bars denote a histogram of data divided into 1 sec bins. Red curve is a Poisson curve with rate = median count rate of data. |
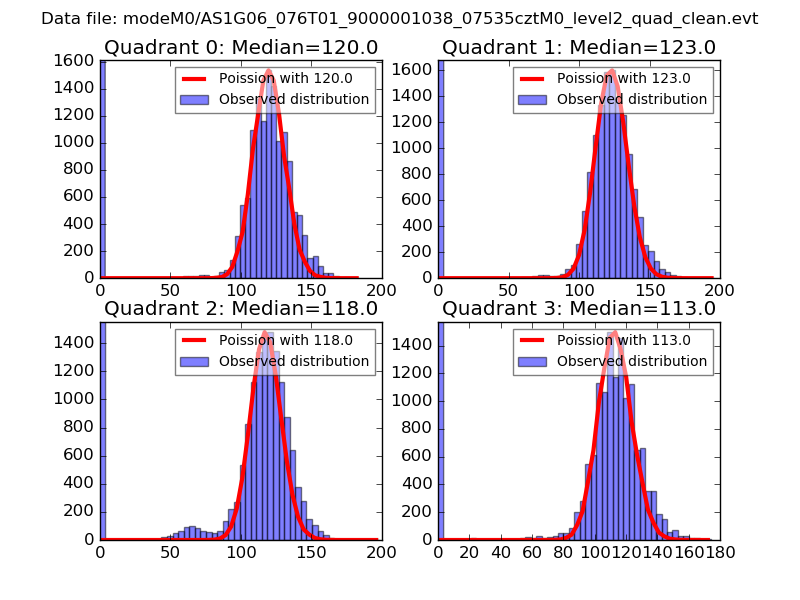 |
 |
| Quadrant-wise count rates Data is divided into 100 sec bins |
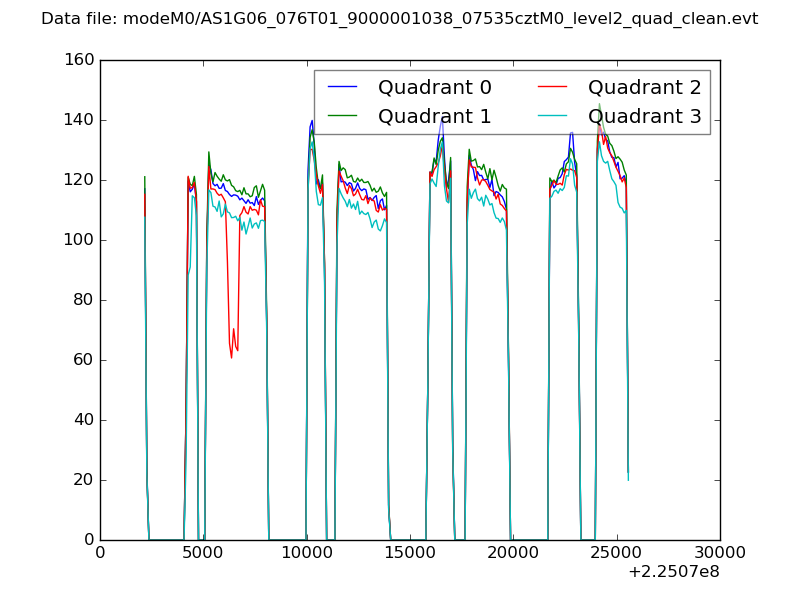 |
|
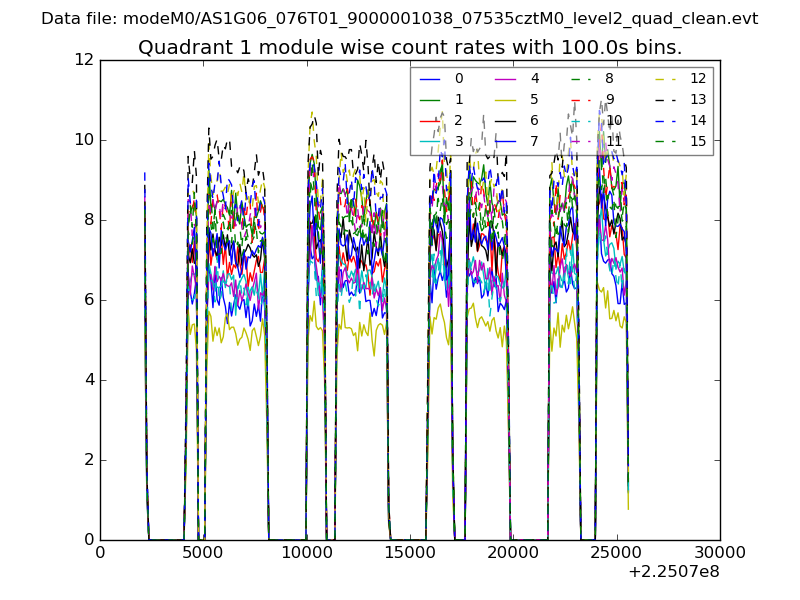
| Module-wise count rates for Quadrant A Data is divided into 100 sec bins |
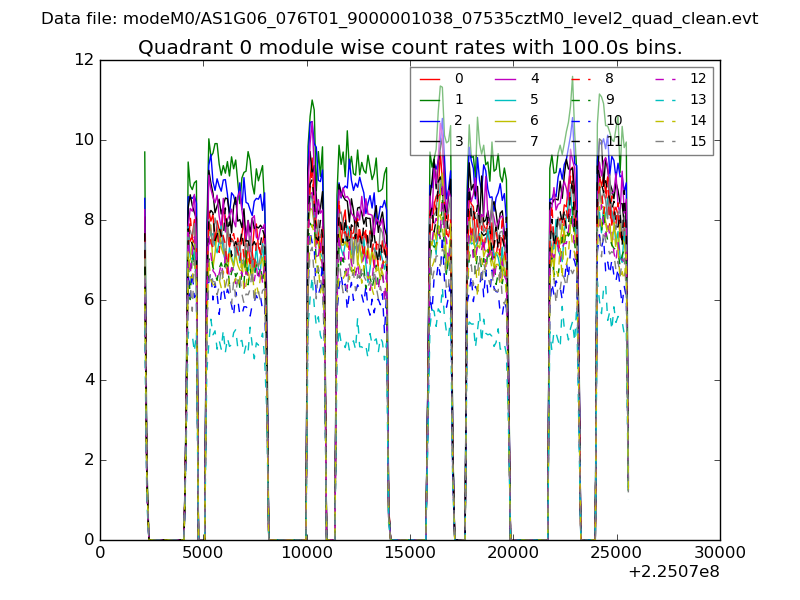 |
 |
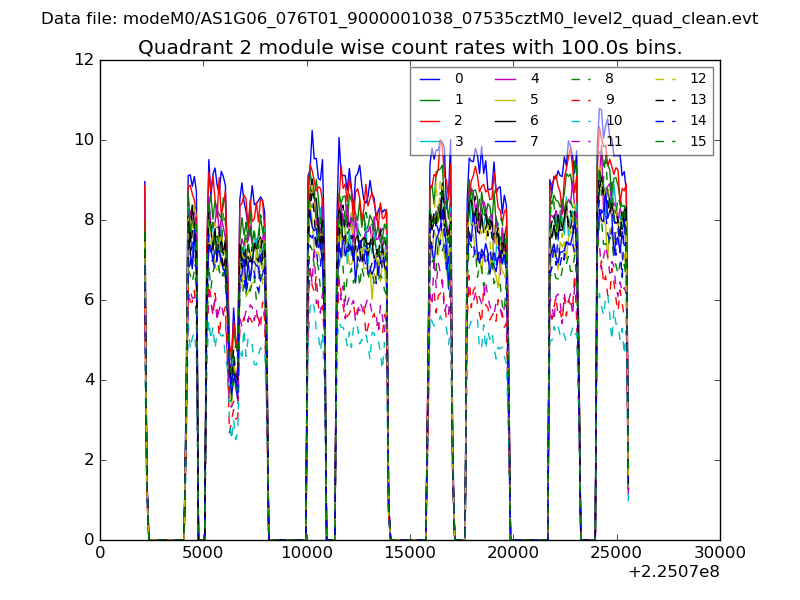
| Module-wise count rates for Quadrant B Data is divided into 100 sec bins |
 |
 |
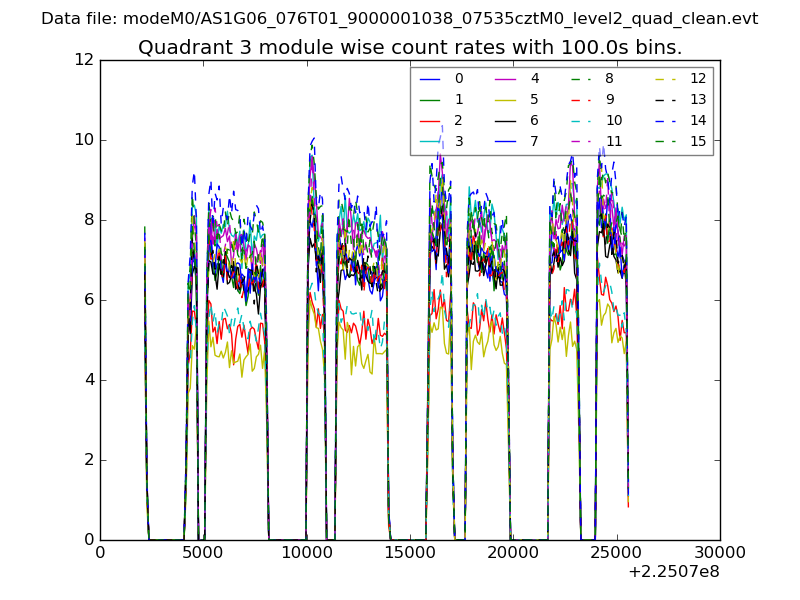
| Module-wise count rates for Quadrant C Data is divided into 100 sec bins |
 |
 |
| Module-wise count rates for Quadrant D Data is divided into 100 sec bins |
 |
 |
| Parameter | Plot |
|---|---|
| CZT HV Monitor | 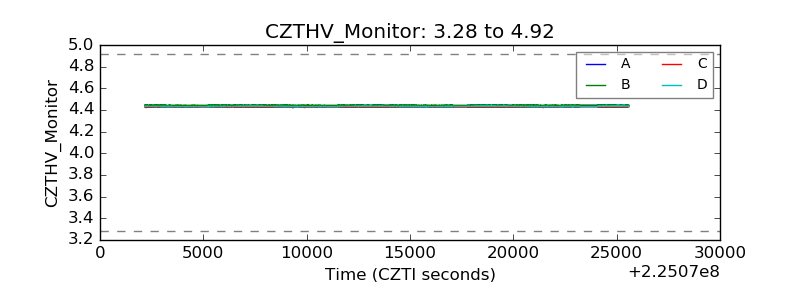 |
| D_VDD | 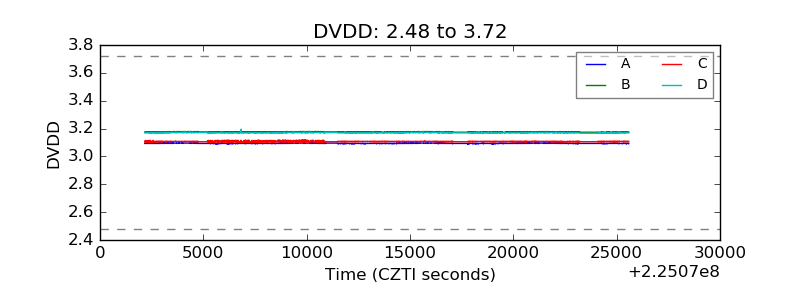 |
| Temperature 1 | 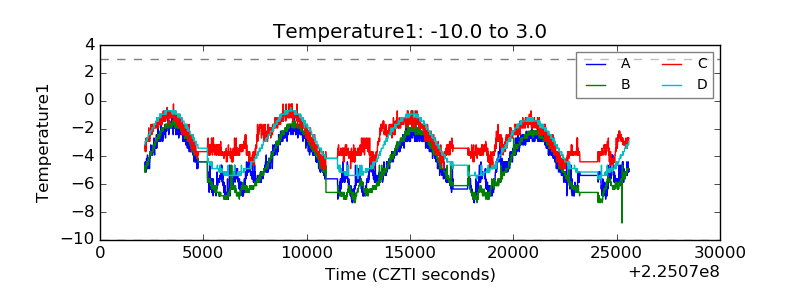 |
| Veto HV Monitor | 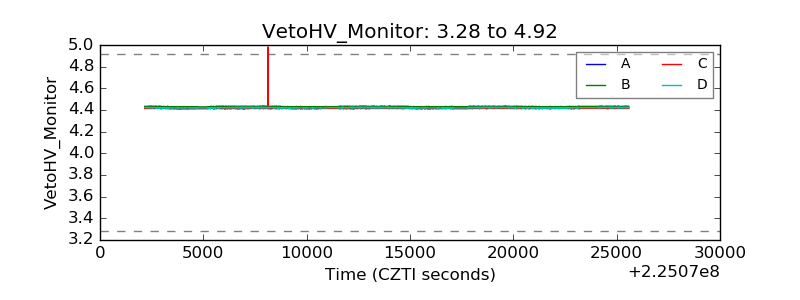 |
| Veto LLD | 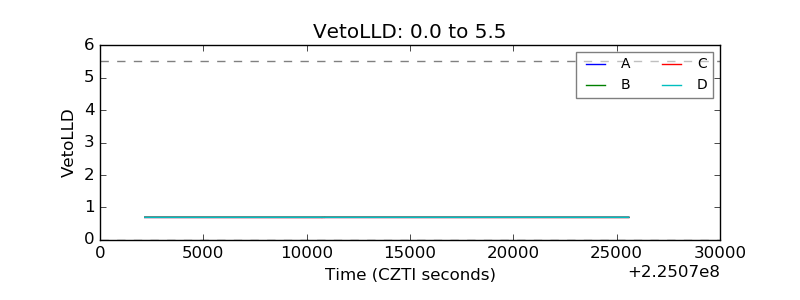 |
| Alpha Counter | 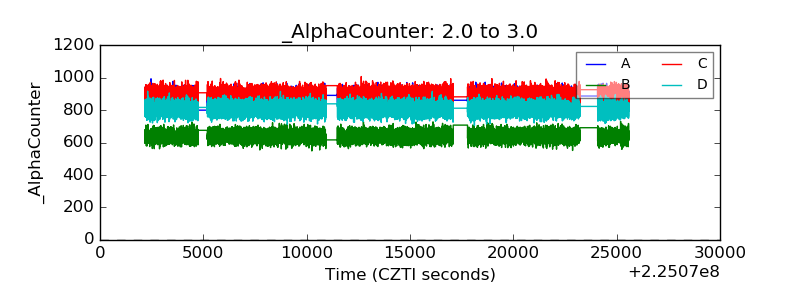 |
| _CPM_Rate | 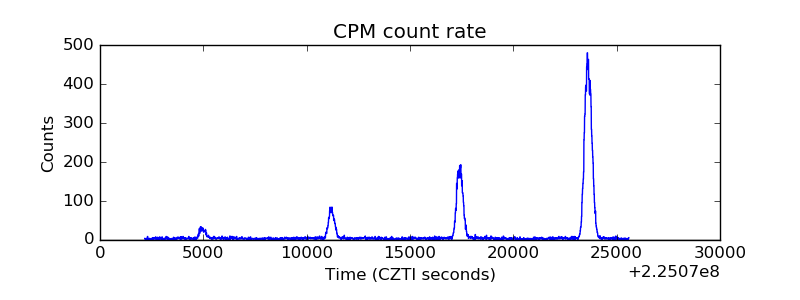 |
| CZT Counter |  |
| +2.5 Volts monitor | 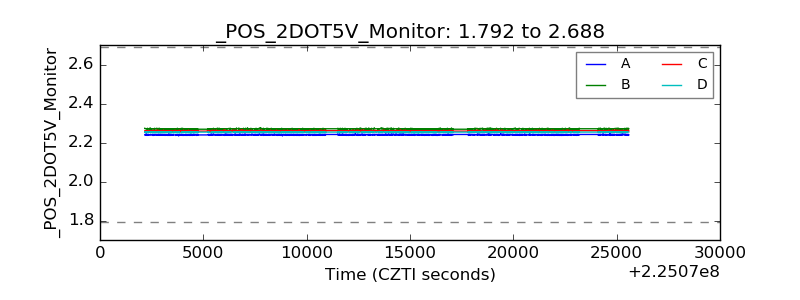 |
| +5 Volts monitor |  |
| _ROLL_ROT | 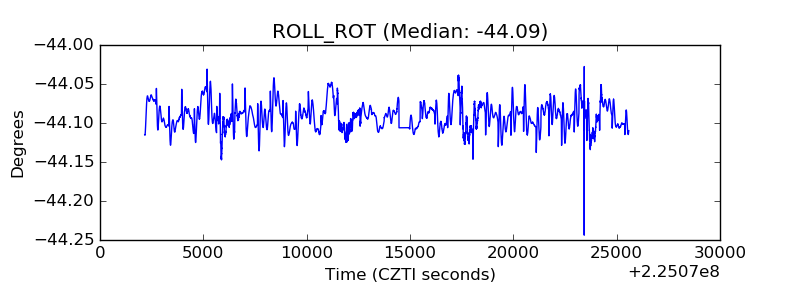 |
| _Roll_DEC | 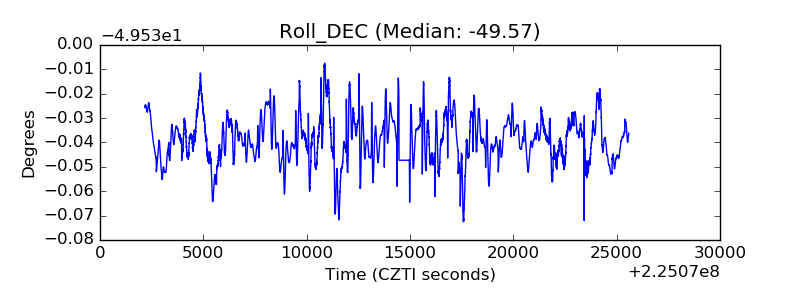 |
| _Roll_RA | 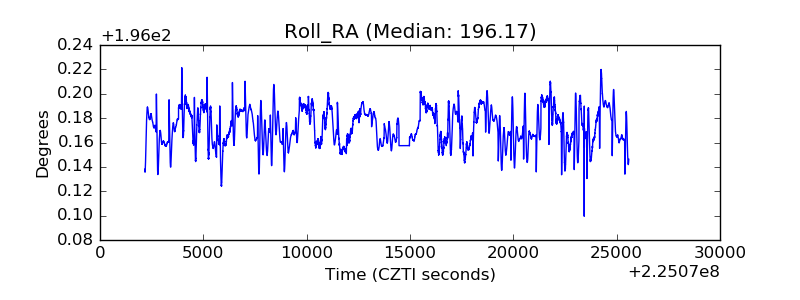 |
| Veto Counter | 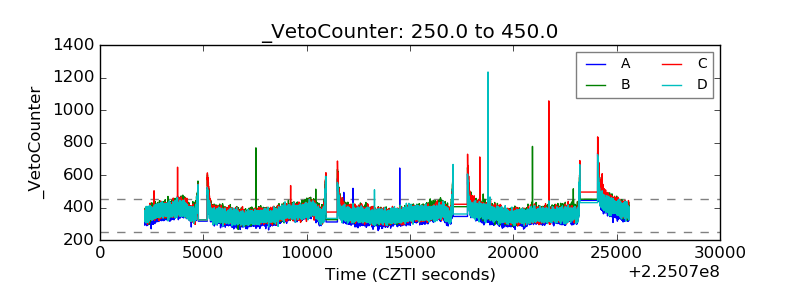 |