| Param | Original file | Final file |
|---|---|---|
| Filename | modeM0/AS1G06_076T01_9000001038_07536cztM0_level2.evt | modeM0/AS1G06_076T01_9000001038_07536cztM0_level2_quad_clean.evt |
| Size (bytes) | 412,701,120 | 81,630,720 |
| Size | 393.6 MB | 77.8 MB |
| Events in quadrant A | 2,824,249 | 519,992 |
| Events in quadrant B | 2,902,669 | 522,547 |
| Events in quadrant C | 2,807,620 | 508,690 |
| Events in quadrant D | 3,544,468 | 490,042 |
| Mode M9 | |||
|---|---|---|---|
| Quadrant | BADHDUFLAG | Total packets | Discarded packets |
| A | 0 | 11 | 0 |
| B | 0 | 11 | 0 |
| C | 0 | 11 | 0 |
| D | 0 | 11 | 0 |
| Mode M0 | |||
|---|---|---|---|
| Quadrant | BADHDUFLAG | Total packets | Discarded packets |
| A | 0 | 12535 | 2 |
| B | 0 | 12669 | 1 |
| C | 0 | 12586 | 1 |
| D | 0 | 14821 | 1 |
| Mode SS | |||
|---|---|---|---|
| Quadrant | BADHDUFLAG | Total packets | Discarded packets |
| A | 0 | 124 | 0 |
| B | 0 | 124 | 0 |
| C | 0 | 124 | 0 |
| D | 0 | 124 | 0 |
| Quadrant | Total seconds | Saturated seconds | Saturation percentage |
|---|---|---|---|
| A | 6173 | 36 | 0.583185% |
| B | 6173 | 36 | 0.583185% |
| C | 6173 | 35 | 0.566985% |
| D | 6173 | 172 | 2.786328% |
Noise dominated data is calculated using 1-second bins in cleaned event files. If a bin has >2000 counts, and if more than 50% of those come from <1% of pixels, then it is considered to be noise-dominated and hence unusable.
| Quadrant | # 1 sec bins | Bins with >0 counts | Bins with >2000 counts | High rate bins dominated by noise | Noise dominated (total time) | Noise dominated (detector-on time) | Marked lightcurve |
|---|---|---|---|---|---|---|---|
| A | 7208 | 6173 | 0 | 0 | 0.00% | 0.00% | 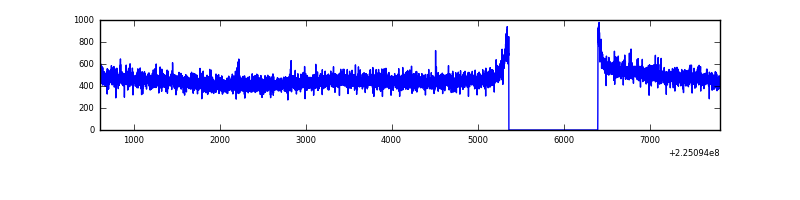 |
| B | 7208 | 6174 | 2 | 2 | 0.03% | 0.03% | 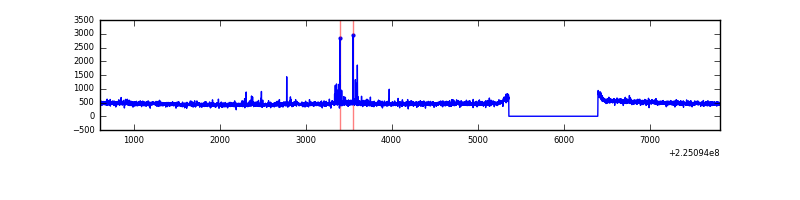 |
| C | 7208 | 6174 | 1 | 1 | 0.01% | 0.02% | 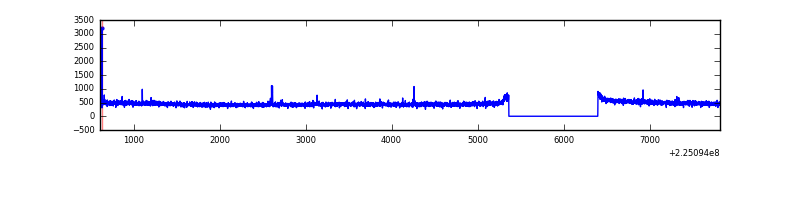 |
| D | 7208 | 6173 | 126 | 126 | 1.75% | 2.04% | 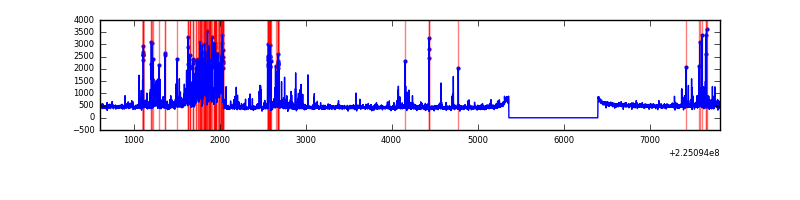 |
Top three noisy pixels from each quadrant. If the there are fewer than three noisy pixels in the level2.evt file, extra rows are filled as -1
| Pixel properties | Quadrant properties | ||||||
|---|---|---|---|---|---|---|---|
| Quadrant | DetID | PixID | Counts | Sigma | Mean | Median | Sigma |
| A | 13 | 14 | 13348 | 84.43 | 731 | 715 | 149.6 |
| A | 0 | 226 | 6861 | 41.08 | 731 | 715 | 149.6 |
| A | 12 | 194 | 6310 | 37.39 | 731 | 715 | 149.6 |
| B | 0 | 213 | 39530 | 281.11 | 731 | 713 | 138.1 |
| B | 12 | 111 | 14082 | 96.82 | 731 | 713 | 138.1 |
| B | 11 | 111 | 11433 | 77.63 | 731 | 713 | 138.1 |
| C | 8 | 229 | 11086 | 62.7 | 713 | 716 | 165.4 |
| C | 1 | 16 | 11010 | 62.24 | 713 | 716 | 165.4 |
| C | 13 | 61 | 5565 | 29.32 | 713 | 716 | 165.4 |
| D | 5 | 184 | 389701 | 2257.24 | 708 | 685 | 172.3 |
| D | 2 | 152 | 236524 | 1368.44 | 708 | 685 | 172.3 |
| D | 12 | 233 | 89458 | 515.1 | 708 | 685 | 172.3 |
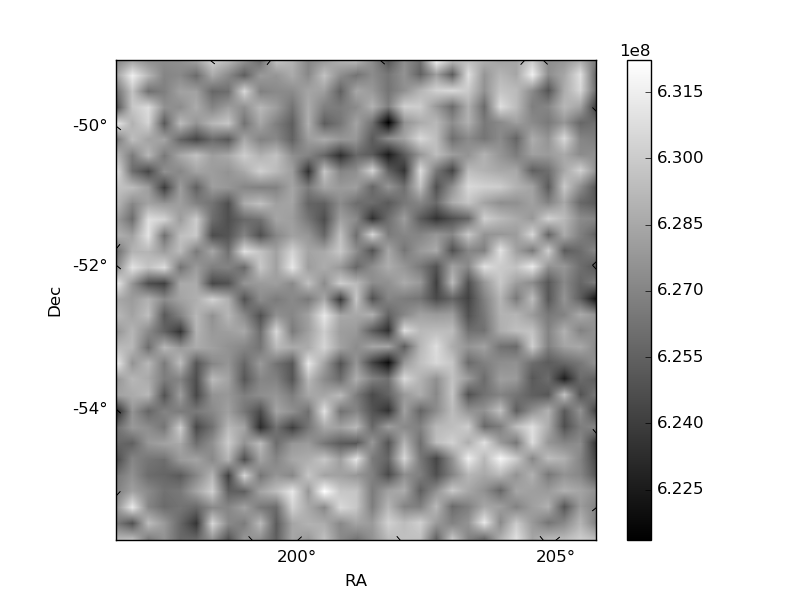
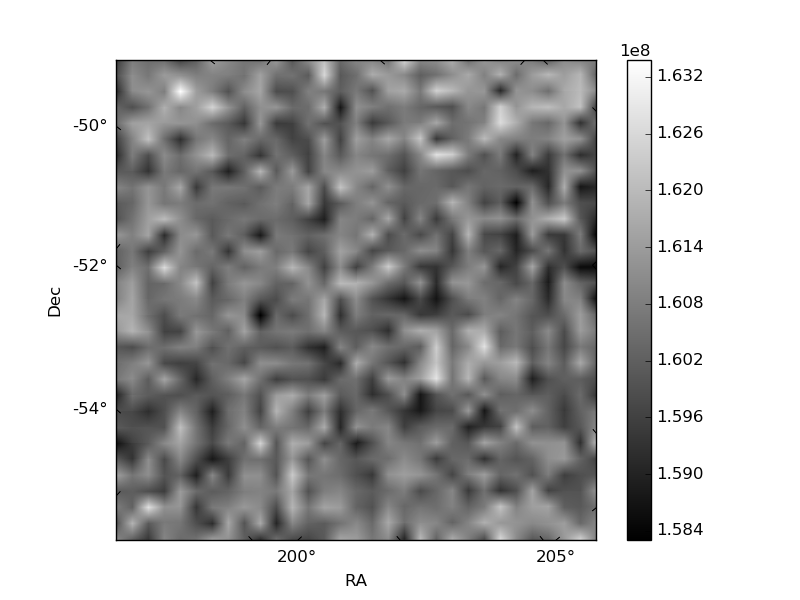
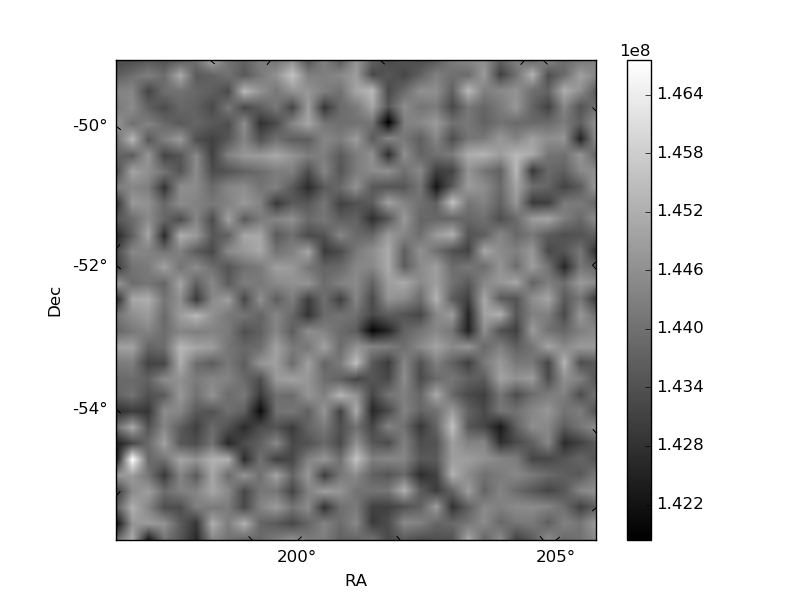
Histogram calculated using DETX and DETY for each event in the final _common_clean file
| Quadrant A | 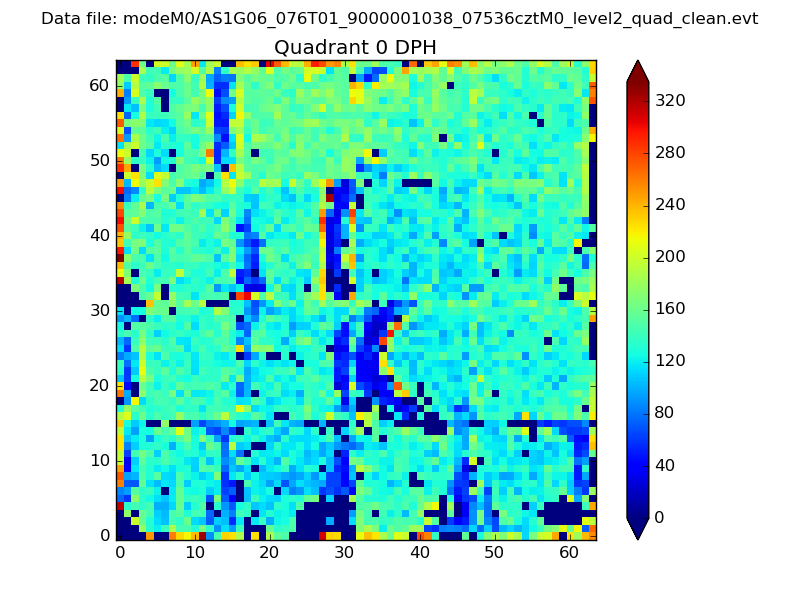 |
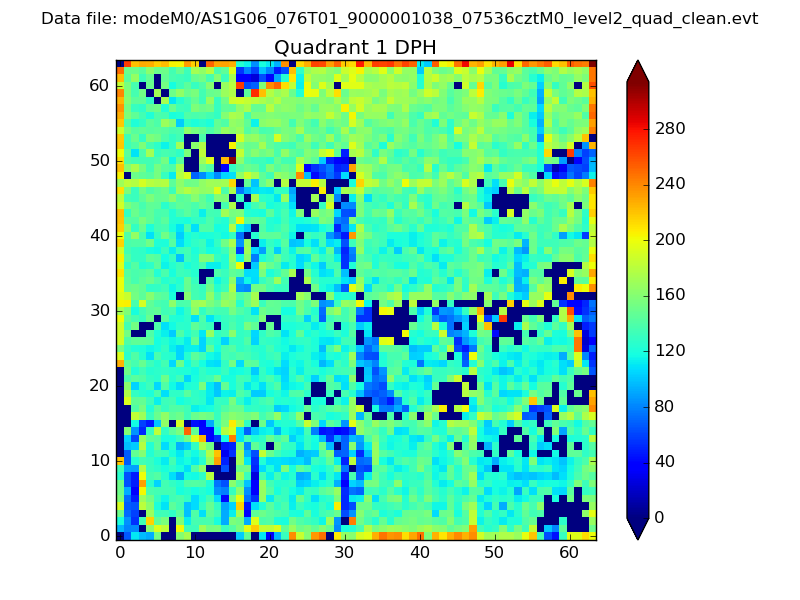 |
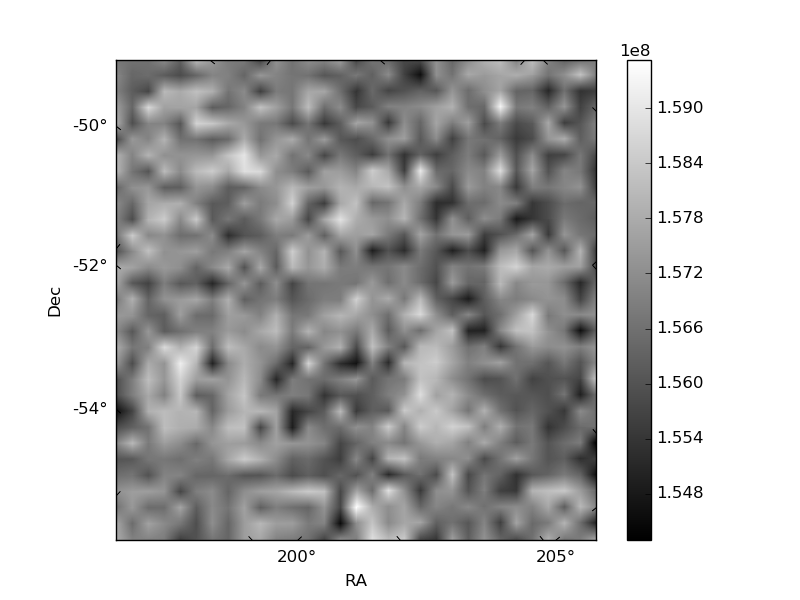
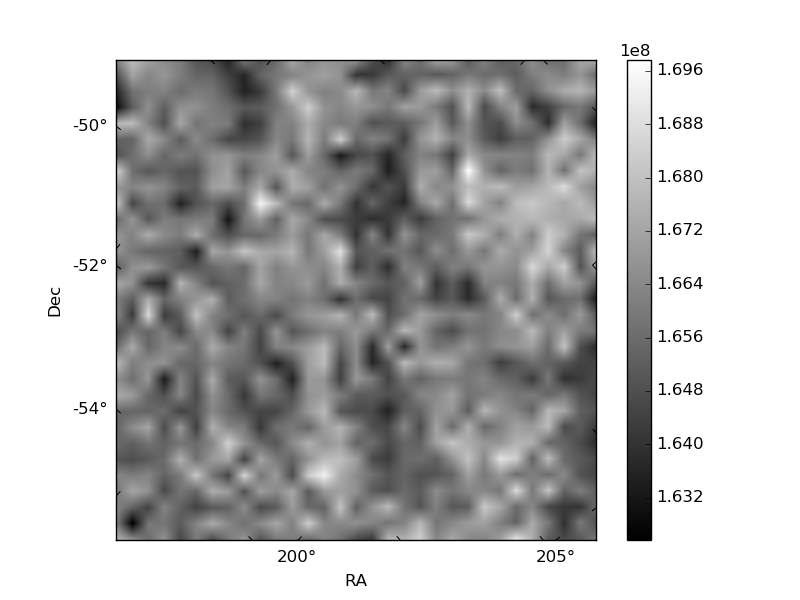
Quadrant B |
|---|---|---|---|
| Quadrant D | 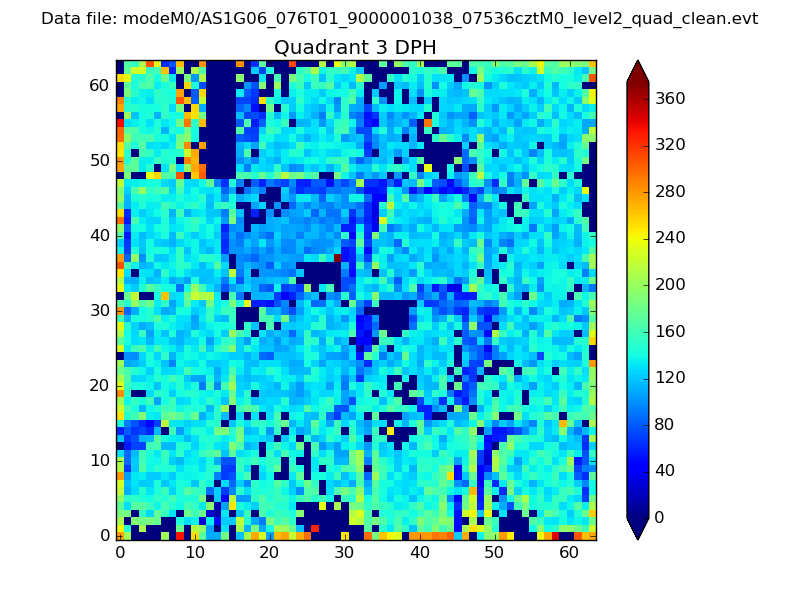 |
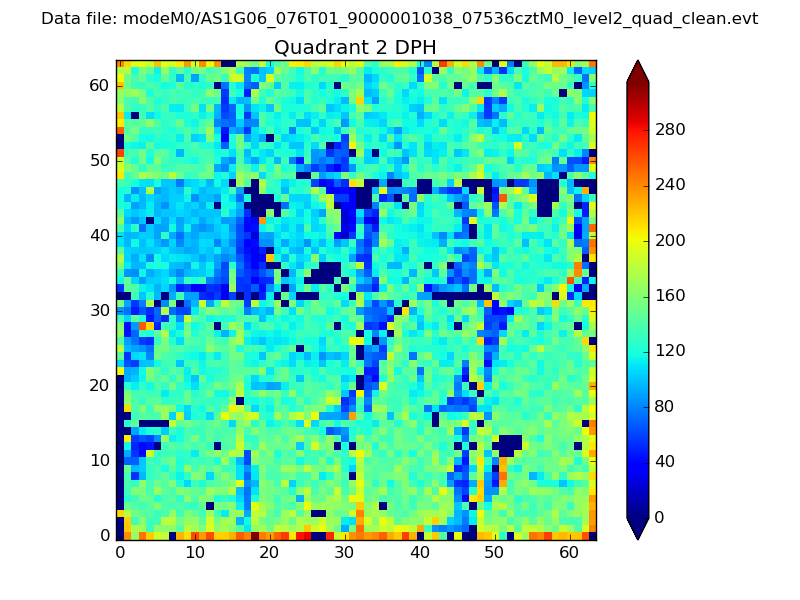 |
Quadrant C |
| Plot type | Count rate plots | Images |
|---|---|---|
| Comparison with Poisson distribution Blue bars denote a histogram of data divided into 1 sec bins. Red curve is a Poisson curve with rate = median count rate of data. |
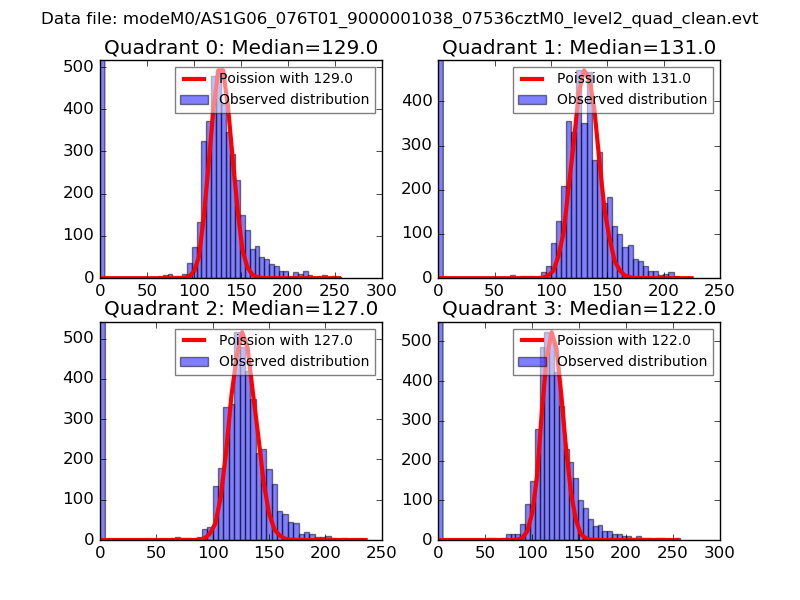 |
 |
| Quadrant-wise count rates Data is divided into 100 sec bins |
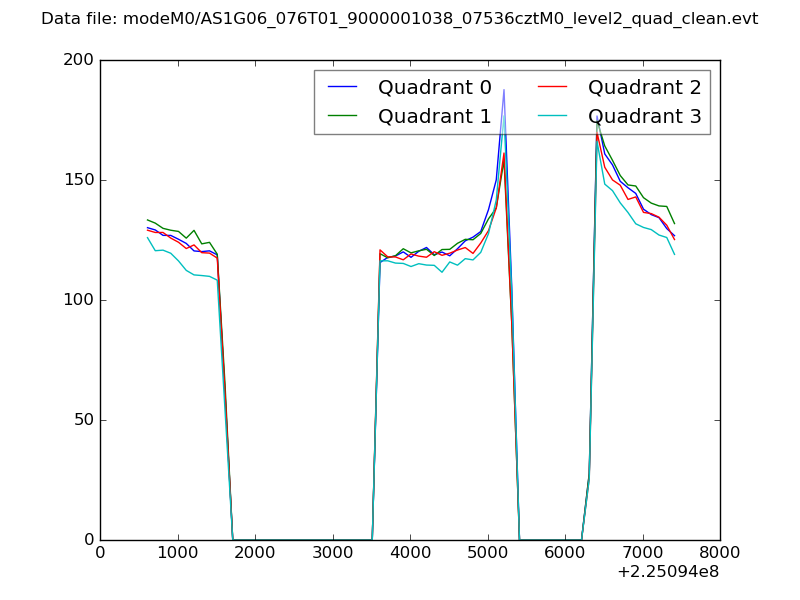 |
|
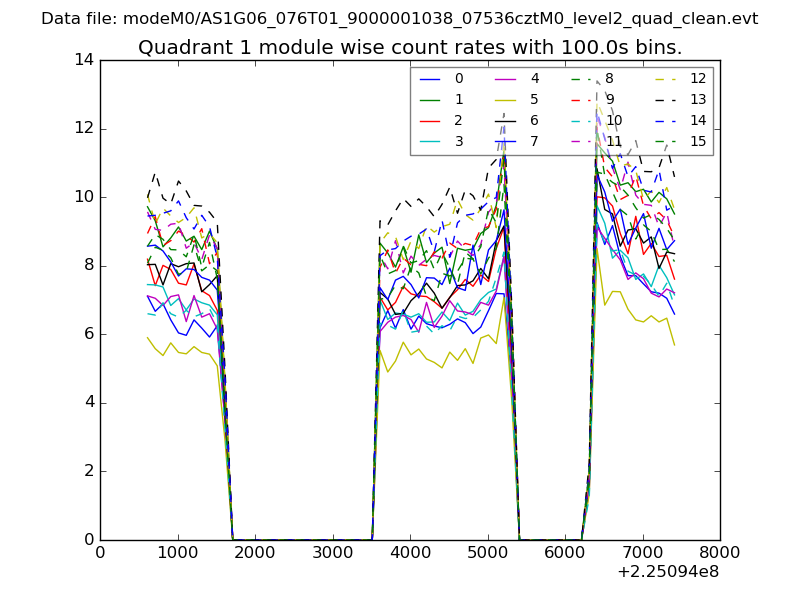
| Module-wise count rates for Quadrant A Data is divided into 100 sec bins |
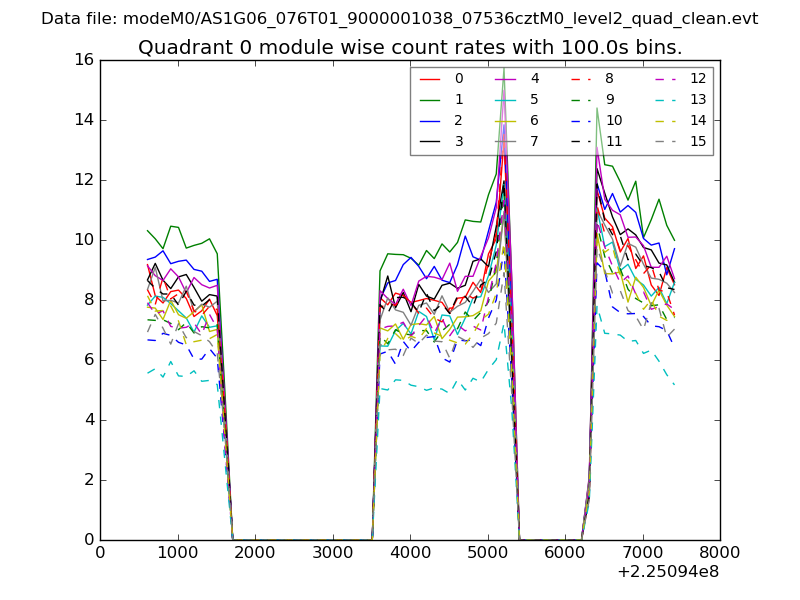 |
 |
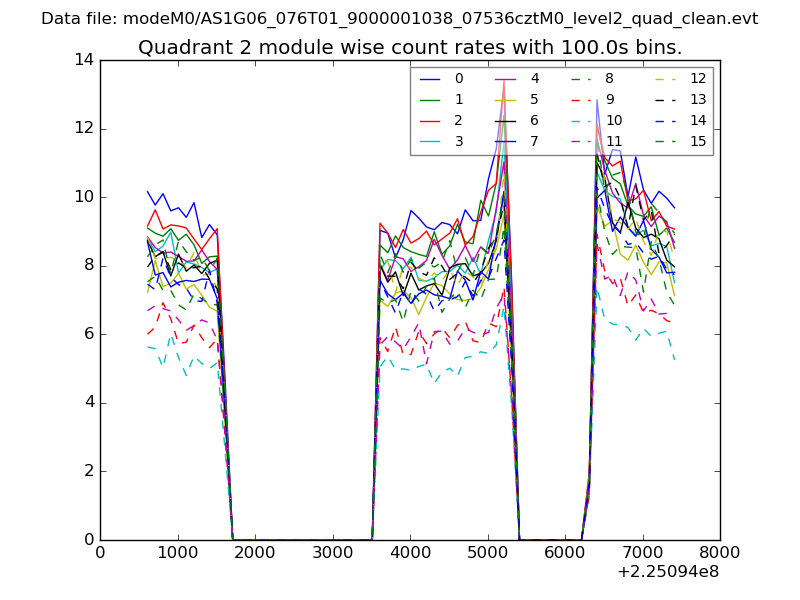
| Module-wise count rates for Quadrant B Data is divided into 100 sec bins |
 |
 |
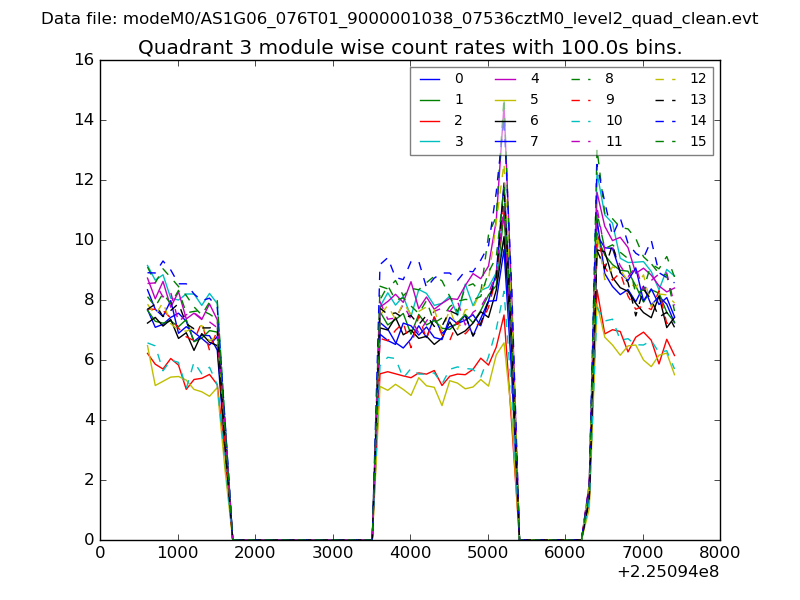
| Module-wise count rates for Quadrant C Data is divided into 100 sec bins |
 |
 |
| Module-wise count rates for Quadrant D Data is divided into 100 sec bins |
 |
 |
| Parameter | Plot |
|---|---|
| CZT HV Monitor | 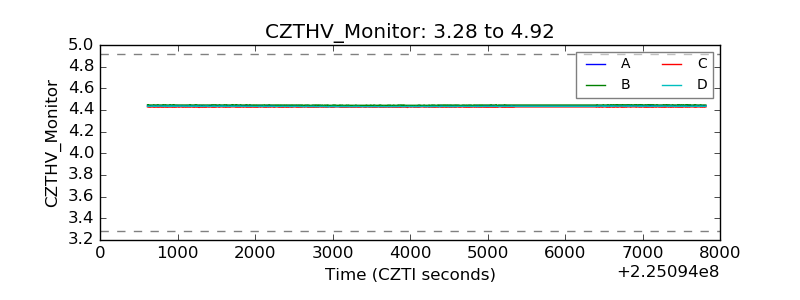 |
| D_VDD | 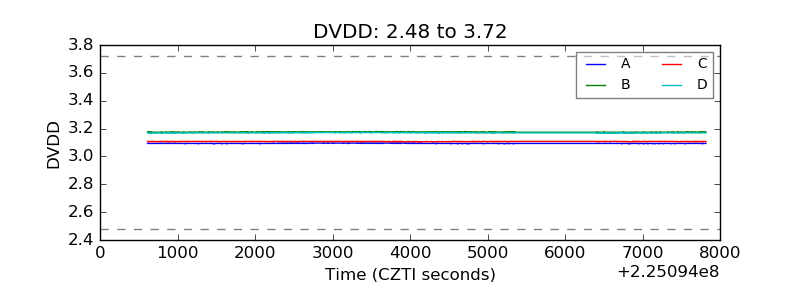 |
| Temperature 1 | 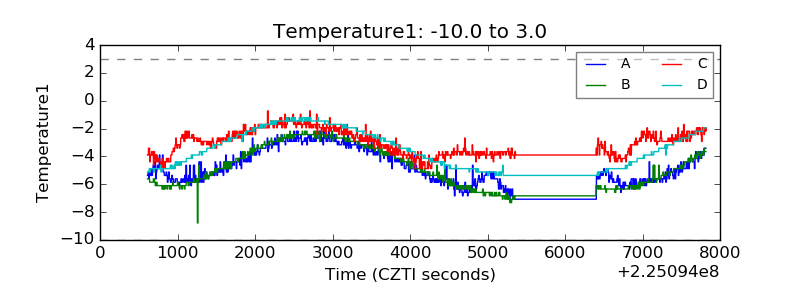 |
| Veto HV Monitor | 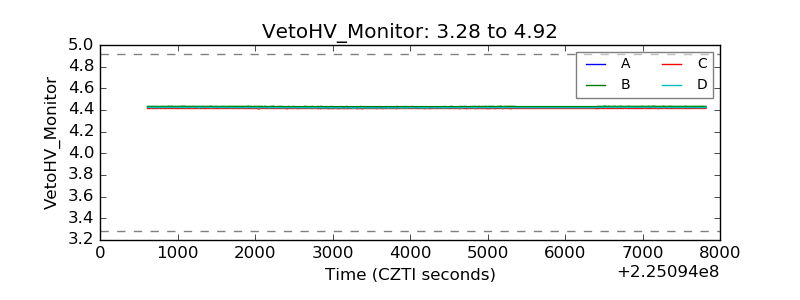 |
| Veto LLD | 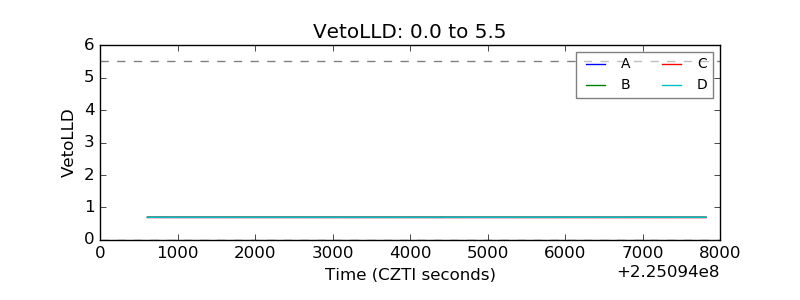 |
| Alpha Counter | 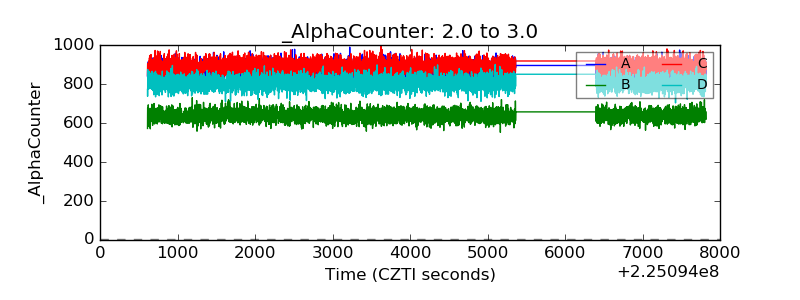 |
| _CPM_Rate | 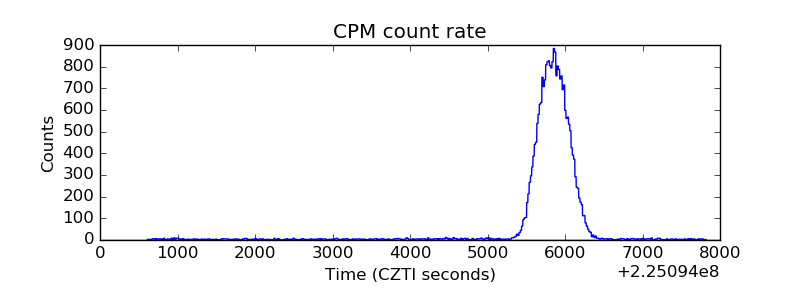 |
| CZT Counter | 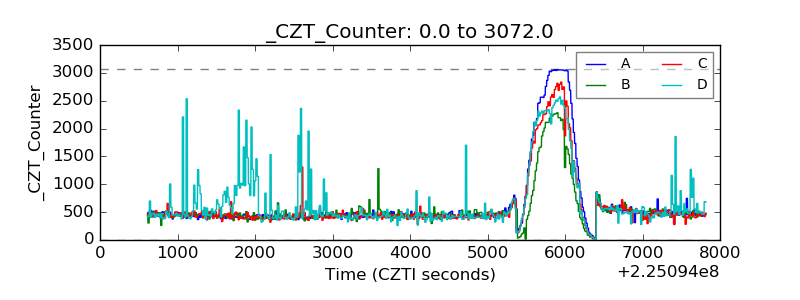 |
| +2.5 Volts monitor |  |
| +5 Volts monitor |  |
| _ROLL_ROT | 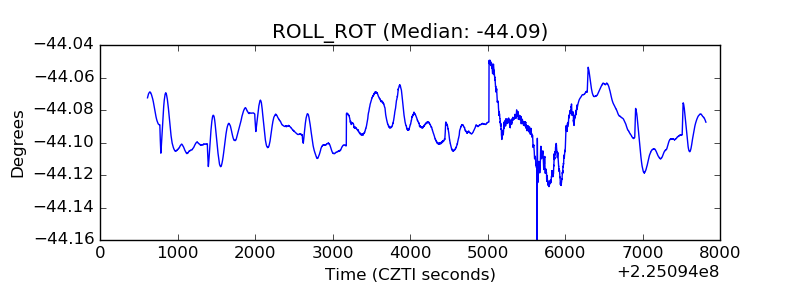 |
| _Roll_DEC | 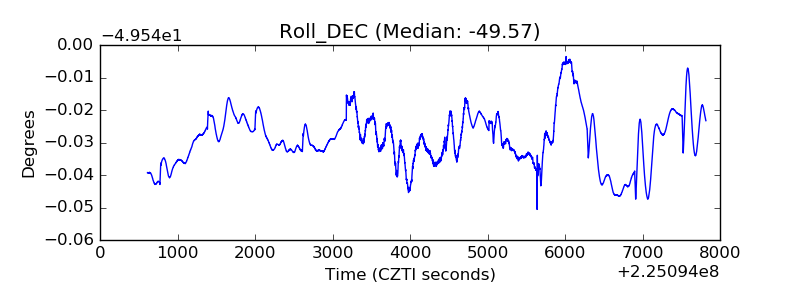 |
| _Roll_RA | 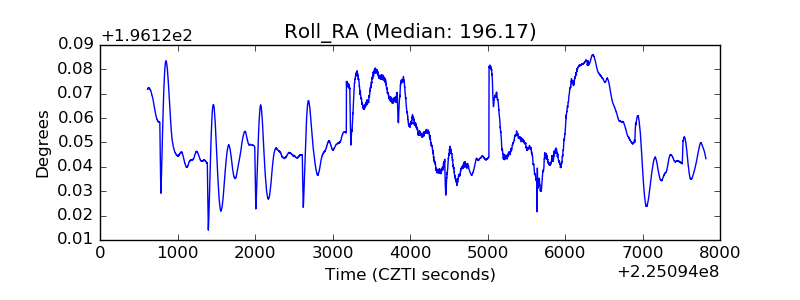 |
| Veto Counter | 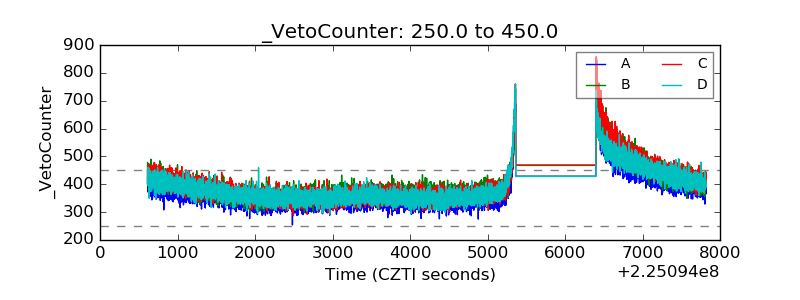 |