| Param | Original file | Final file |
|---|---|---|
| Filename | modeM0/AS1G06_076T01_9000001038_07538cztM0_level2.evt | modeM0/AS1G06_076T01_9000001038_07538cztM0_level2_quad_clean.evt |
| Size (bytes) | 397,820,160 | 77,287,680 |
| Size | 379.4 MB | 73.7 MB |
| Events in quadrant A | 2,867,858 | 487,691 |
| Events in quadrant B | 2,885,850 | 494,775 |
| Events in quadrant C | 2,789,008 | 479,543 |
| Events in quadrant D | 3,097,912 | 460,157 |
| Mode M9 | |||
|---|---|---|---|
| Quadrant | BADHDUFLAG | Total packets | Discarded packets |
| A | 0 | 11 | 0 |
| B | 0 | 11 | 0 |
| C | 0 | 11 | 0 |
| D | 0 | 11 | 0 |
| Mode M0 | |||
|---|---|---|---|
| Quadrant | BADHDUFLAG | Total packets | Discarded packets |
| A | 0 | 12529 | 2 |
| B | 0 | 12447 | 1 |
| C | 0 | 12363 | 1 |
| D | 0 | 13278 | 1 |
| Mode SS | |||
|---|---|---|---|
| Quadrant | BADHDUFLAG | Total packets | Discarded packets |
| A | 0 | 122 | 0 |
| B | 0 | 122 | 0 |
| C | 0 | 122 | 0 |
| D | 0 | 122 | 0 |
| Quadrant | Total seconds | Saturated seconds | Saturation percentage |
|---|---|---|---|
| A | 5985 | 69 | 1.152882% |
| B | 5985 | 57 | 0.952381% |
| C | 5985 | 53 | 0.885547% |
| D | 5985 | 84 | 1.403509% |
Noise dominated data is calculated using 1-second bins in cleaned event files. If a bin has >2000 counts, and if more than 50% of those come from <1% of pixels, then it is considered to be noise-dominated and hence unusable.
| Quadrant | # 1 sec bins | Bins with >0 counts | Bins with >2000 counts | High rate bins dominated by noise | Noise dominated (total time) | Noise dominated (detector-on time) | Marked lightcurve |
|---|---|---|---|---|---|---|---|
| A | 7115 | 5985 | 2 | 2 | 0.03% | 0.03% | 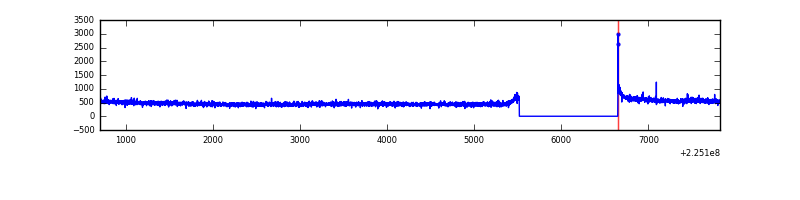 |
| B | 7115 | 5985 | 1 | 1 | 0.01% | 0.02% | 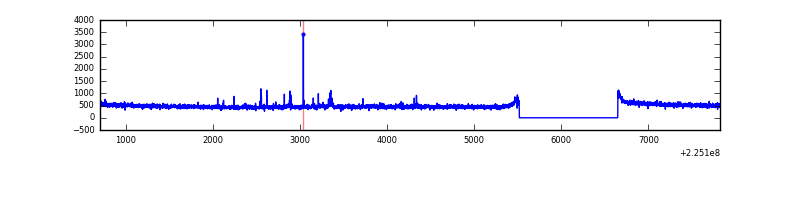 |
| C | 7115 | 5985 | 0 | 0 | 0.00% | 0.00% | 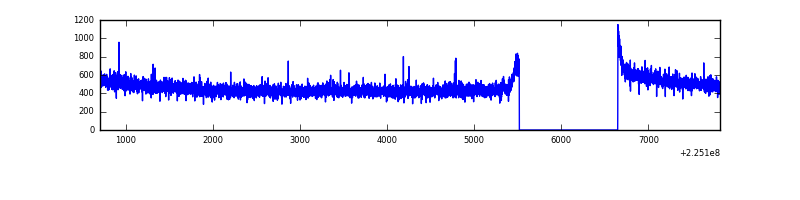 |
| D | 7115 | 5985 | 27 | 27 | 0.38% | 0.45% | 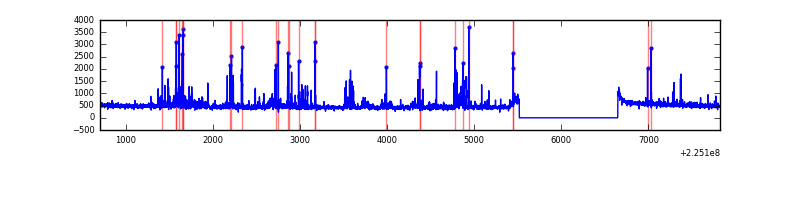 |
Top three noisy pixels from each quadrant. If the there are fewer than three noisy pixels in the level2.evt file, extra rows are filled as -1
| Pixel properties | Quadrant properties | ||||||
|---|---|---|---|---|---|---|---|
| Quadrant | DetID | PixID | Counts | Sigma | Mean | Median | Sigma |
| A | 14 | 111 | 45129 | 298.14 | 732 | 716 | 149.0 |
| A | 13 | 14 | 8721 | 53.74 | 732 | 716 | 149.0 |
| A | 0 | 226 | 6773 | 40.66 | 732 | 716 | 149.0 |
| B | 4 | 81 | 32136 | 226.82 | 732 | 715 | 138.5 |
| B | 12 | 111 | 13945 | 95.51 | 732 | 715 | 138.5 |
| B | 11 | 111 | 11287 | 76.32 | 732 | 715 | 138.5 |
| C | 8 | 229 | 6467 | 34.83 | 713 | 716 | 165.1 |
| C | 13 | 61 | 5587 | 29.5 | 713 | 716 | 165.1 |
| C | 8 | 222 | 2876 | 13.08 | 713 | 716 | 165.1 |
| D | 2 | 136 | 164972 | 944.77 | 711 | 690 | 173.9 |
| D | 2 | 152 | 102620 | 586.19 | 711 | 690 | 173.9 |
| D | 2 | 14 | 93615 | 534.41 | 711 | 690 | 173.9 |
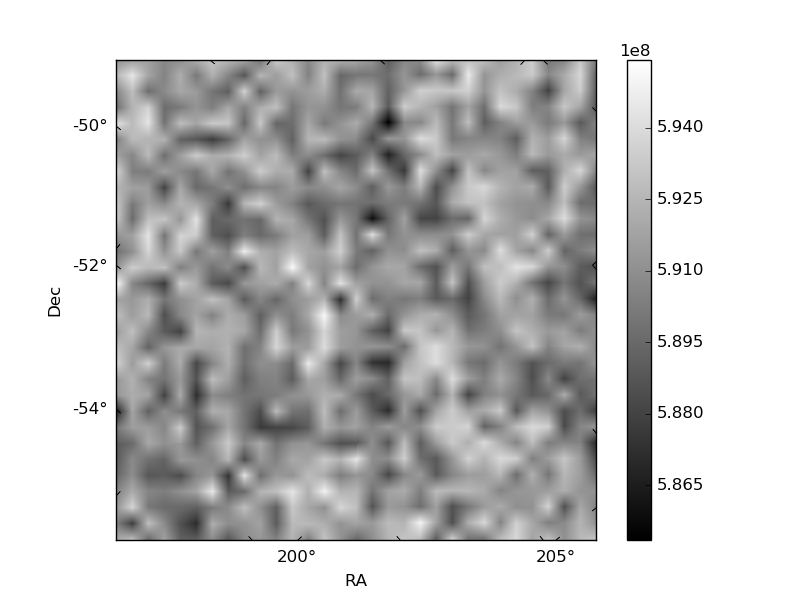
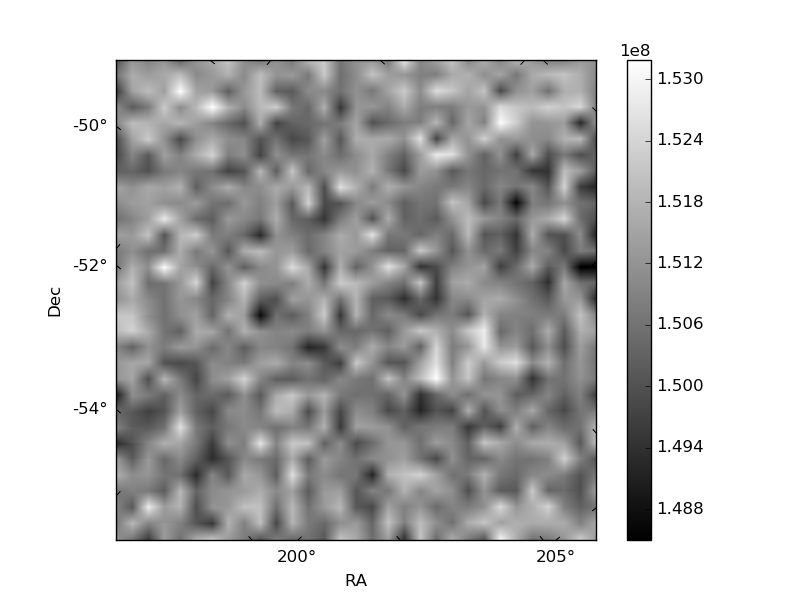
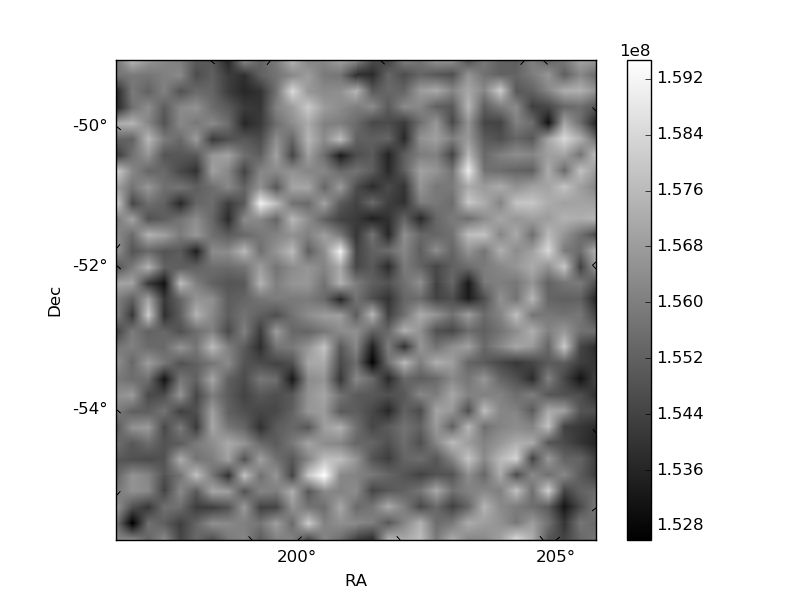
Histogram calculated using DETX and DETY for each event in the final _common_clean file
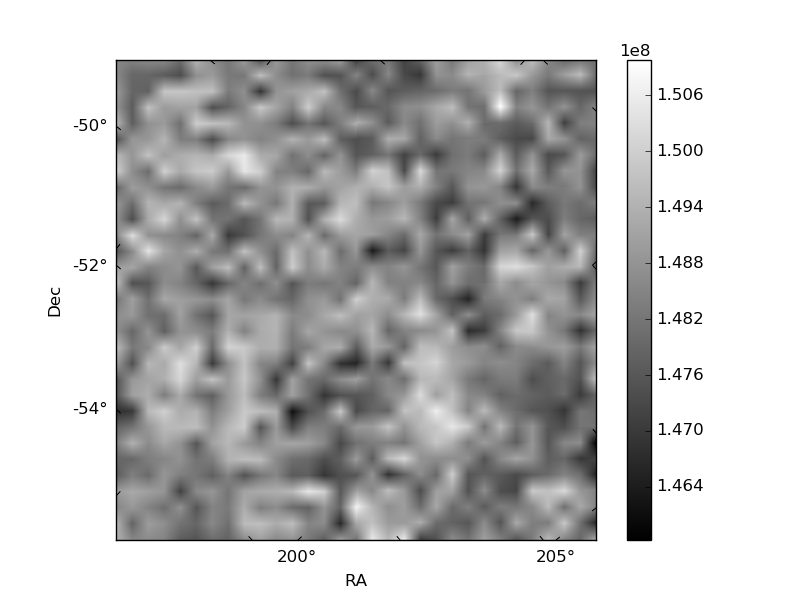
| Quadrant A | 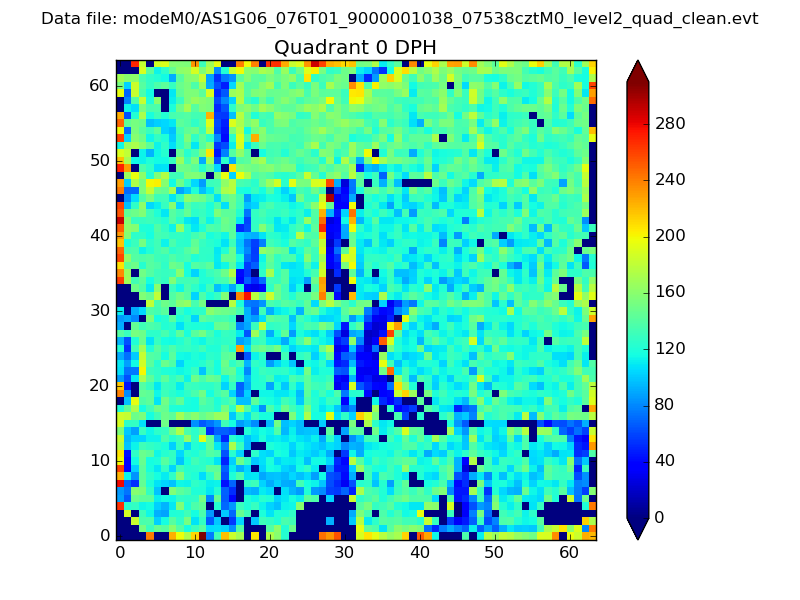 |
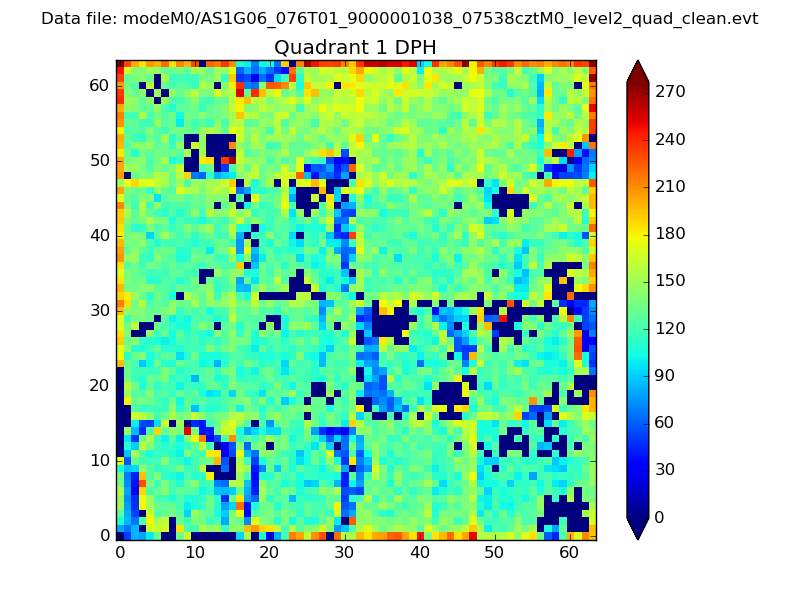 |
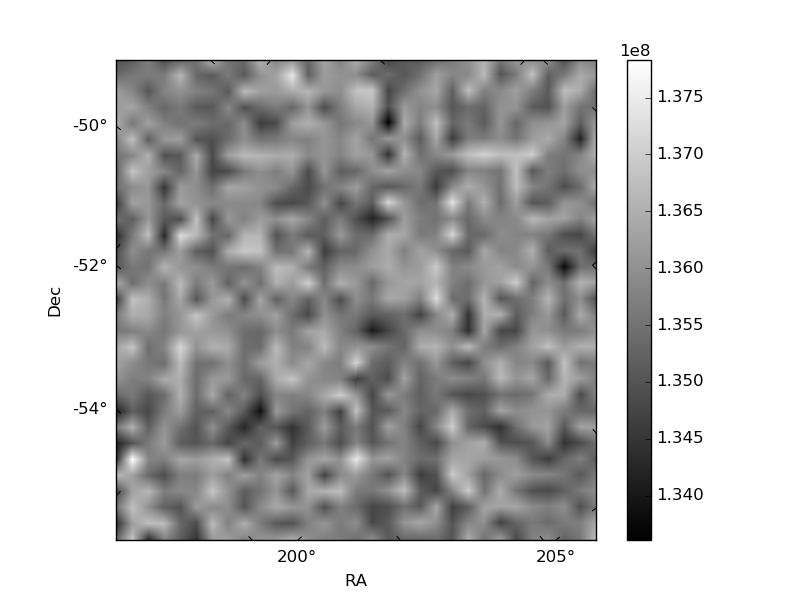
Quadrant B |
|---|---|---|---|
| Quadrant D |  |
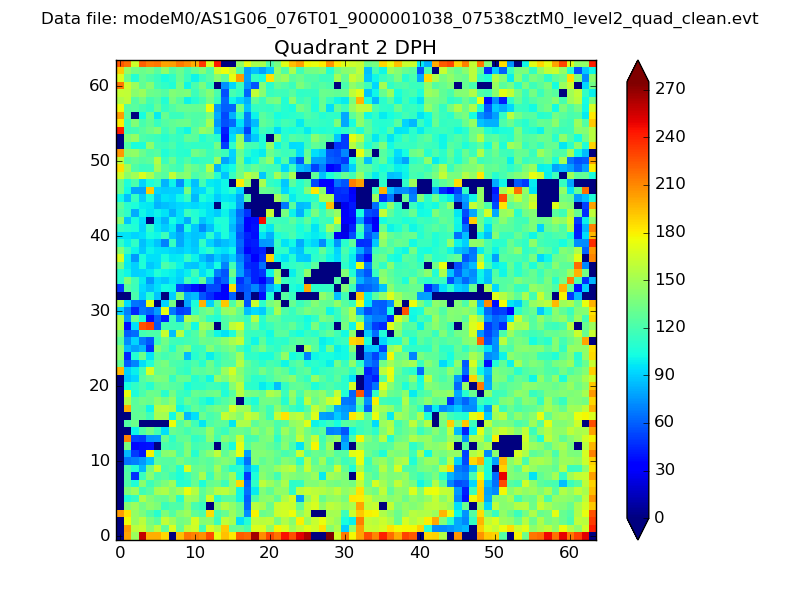 |
Quadrant C |
| Plot type | Count rate plots | Images |
|---|---|---|
| Comparison with Poisson distribution Blue bars denote a histogram of data divided into 1 sec bins. Red curve is a Poisson curve with rate = median count rate of data. |
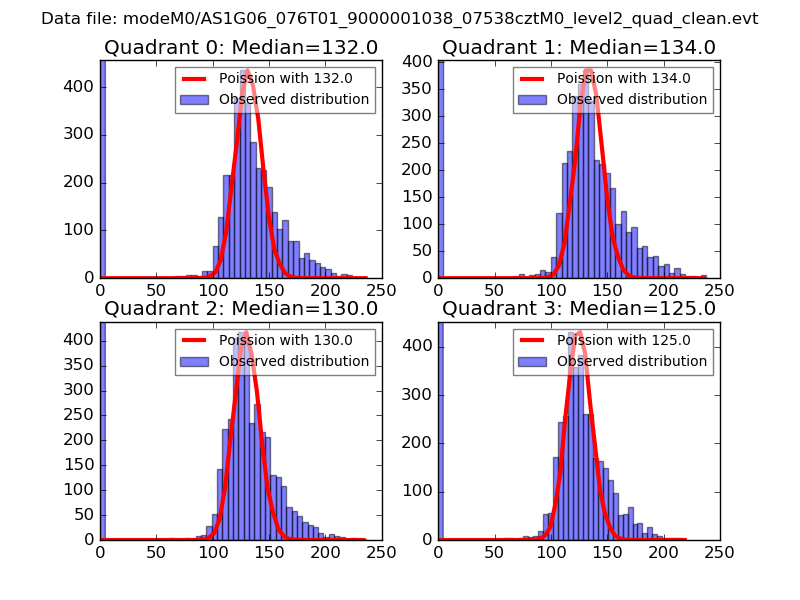 |
 |
| Quadrant-wise count rates Data is divided into 100 sec bins |
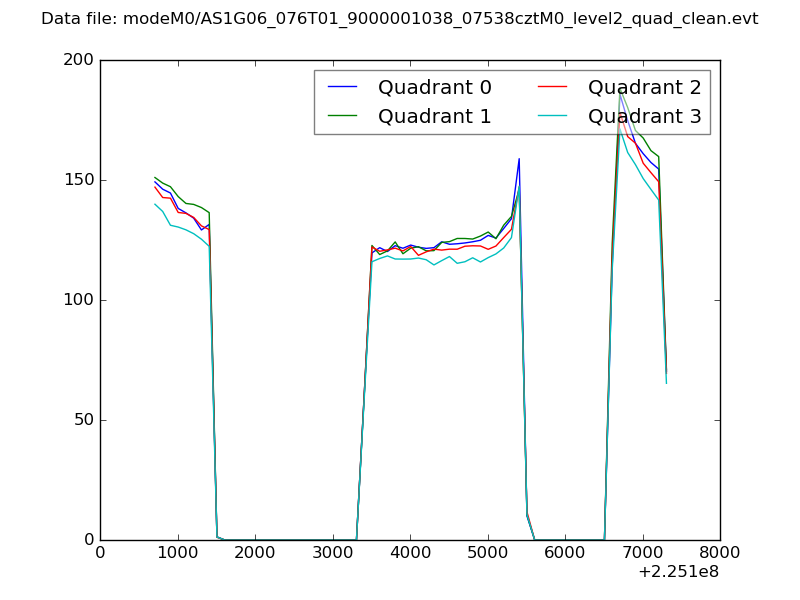 |
|
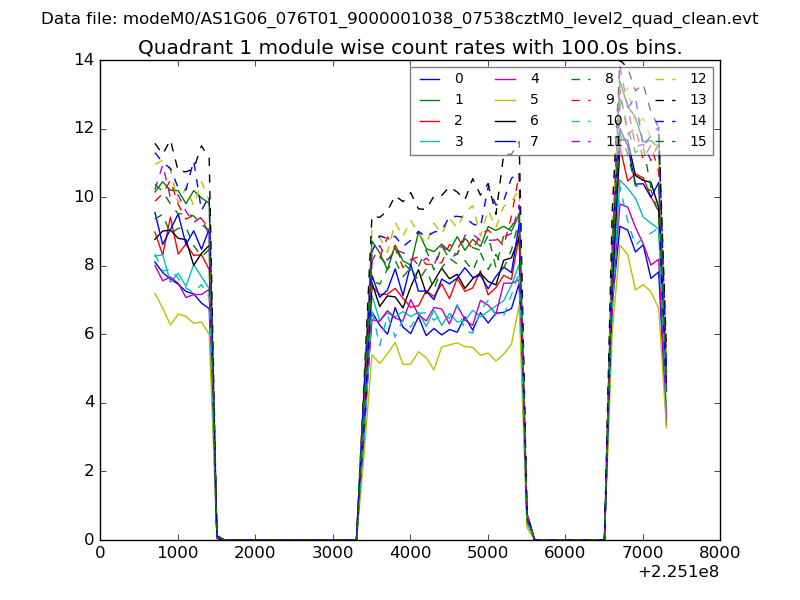
| Module-wise count rates for Quadrant A Data is divided into 100 sec bins |
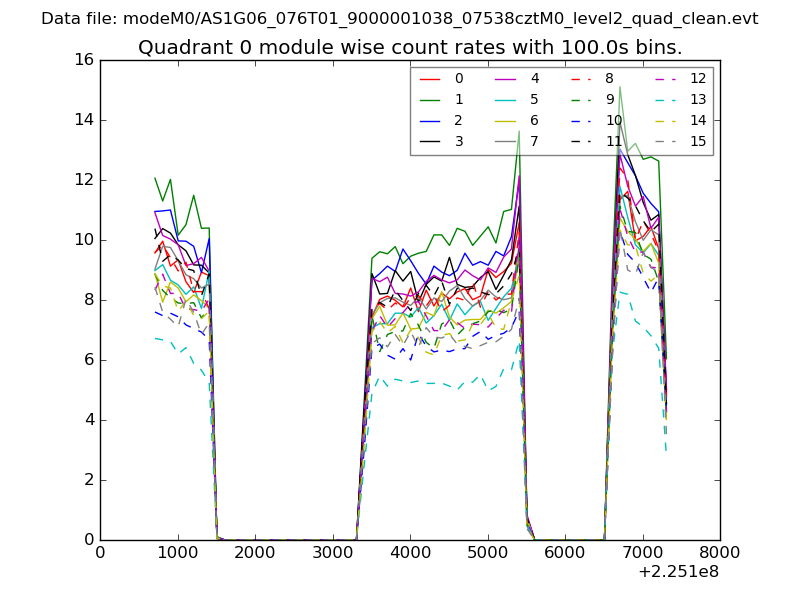 |
 |
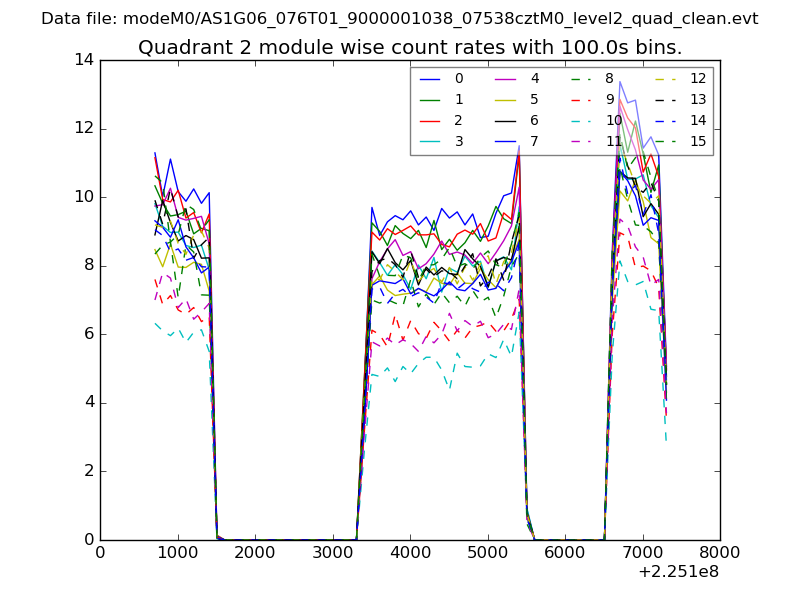
| Module-wise count rates for Quadrant B Data is divided into 100 sec bins |
 |
 |
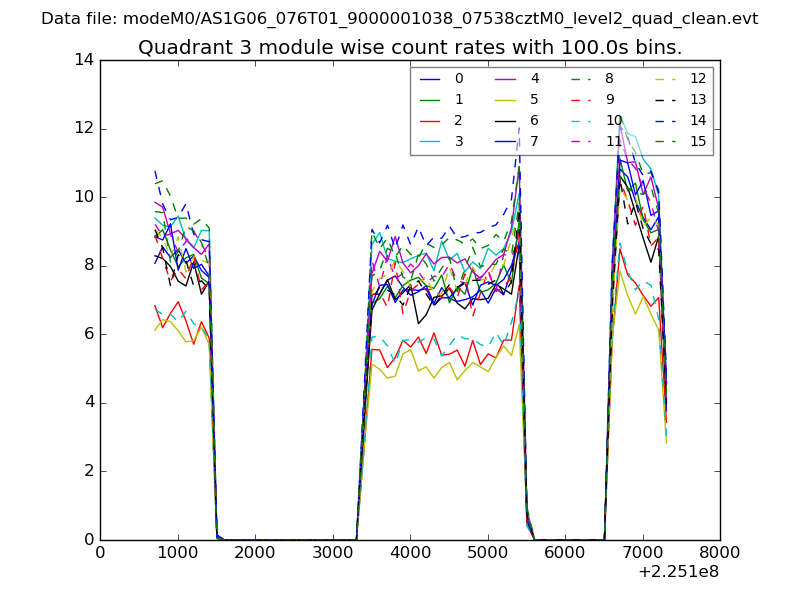
| Module-wise count rates for Quadrant C Data is divided into 100 sec bins |
 |
 |
| Module-wise count rates for Quadrant D Data is divided into 100 sec bins |
 |
 |
| Parameter | Plot |
|---|---|
| CZT HV Monitor | 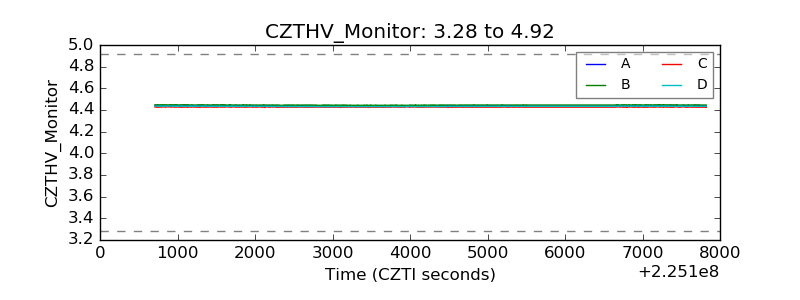 |
| D_VDD | 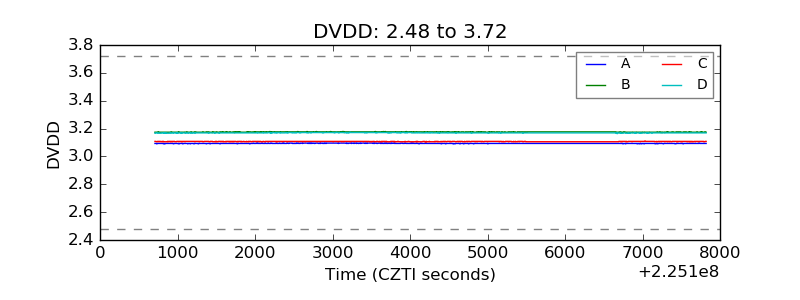 |
| Temperature 1 | 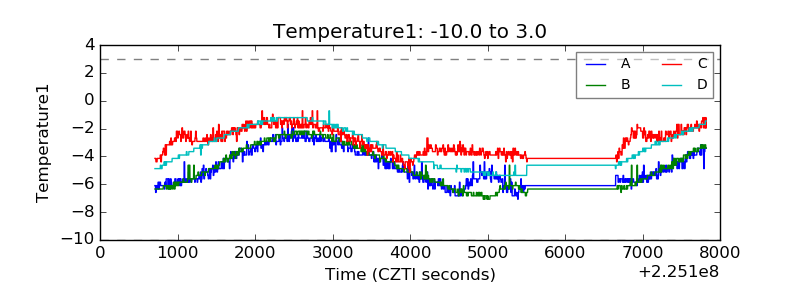 |
| Veto HV Monitor | 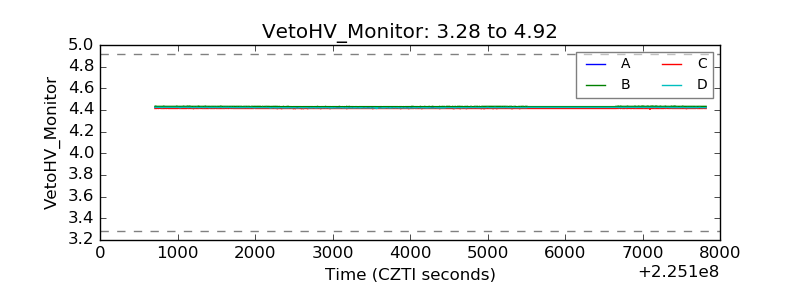 |
| Veto LLD | 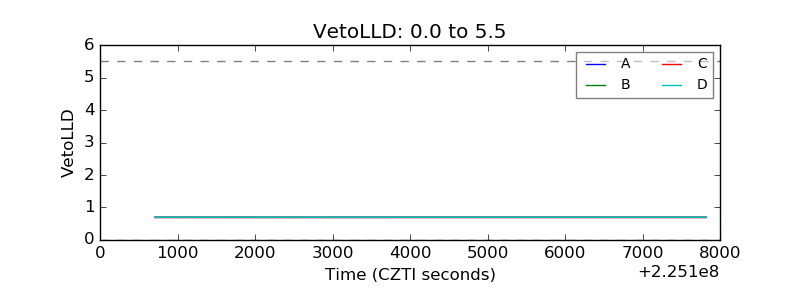 |
| Alpha Counter | 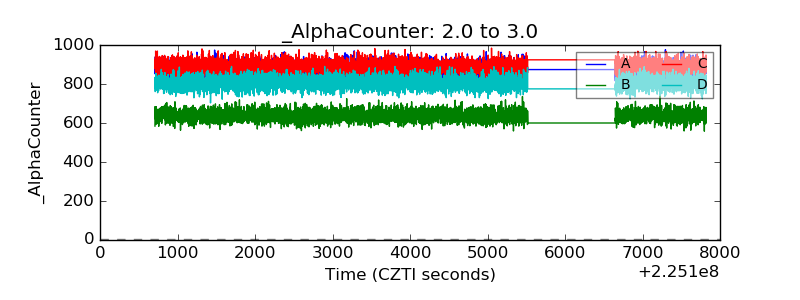 |
| _CPM_Rate | 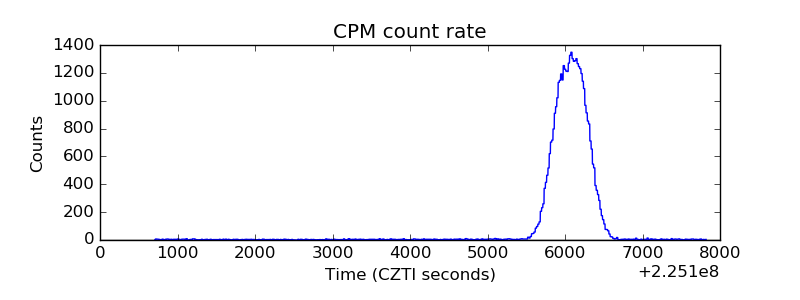 |
| CZT Counter | 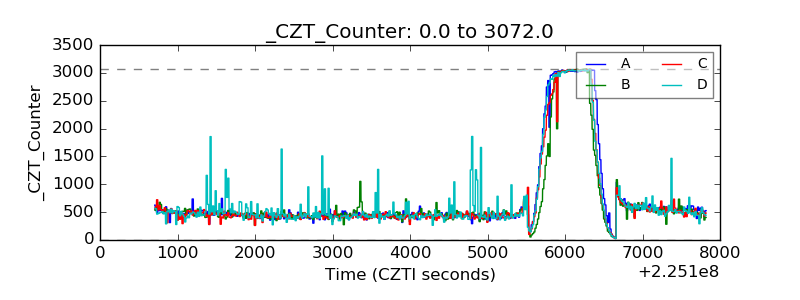 |
| +2.5 Volts monitor |  |
| +5 Volts monitor |  |
| _ROLL_ROT | 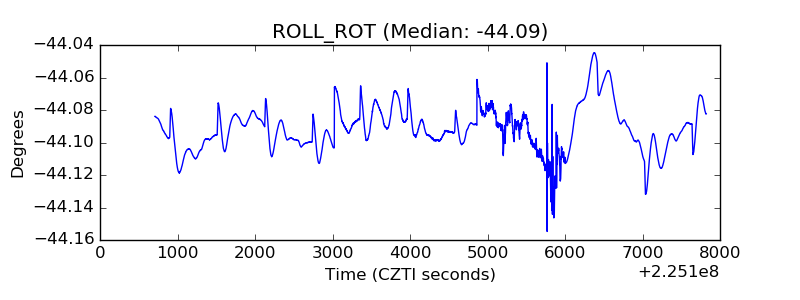 |
| _Roll_DEC | 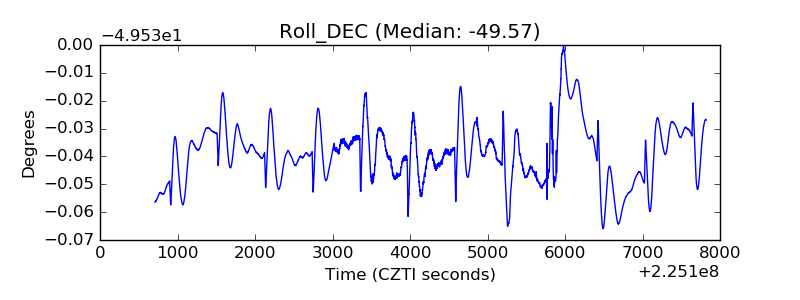 |
| _Roll_RA | 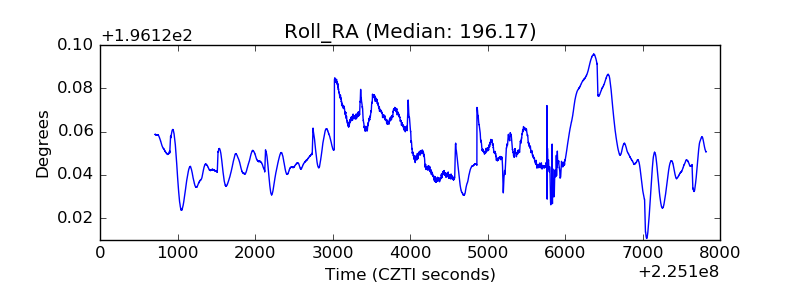 |
| Veto Counter | 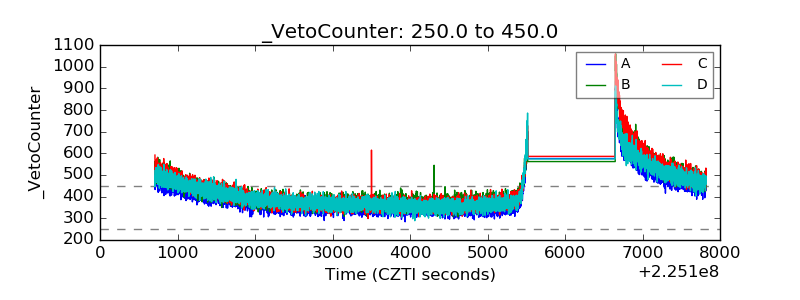 |