| Param | Original file | Final file |
|---|---|---|
| Filename | modeM0/AS1G06_076T01_9000001038_07540cztM0_level2.evt | modeM0/AS1G06_076T01_9000001038_07540cztM0_level2_quad_clean.evt |
| Size (bytes) | 463,795,200 | 69,304,320 |
| Size | 442.3 MB | 66.1 MB |
| Events in quadrant A | 3,367,912 | 414,951 |
| Events in quadrant B | 3,437,677 | 422,136 |
| Events in quadrant C | 3,274,532 | 406,676 |
| Events in quadrant D | 3,514,929 | 392,026 |
| Mode M9 | |||
|---|---|---|---|
| Quadrant | BADHDUFLAG | Total packets | Discarded packets |
| A | 0 | 16 | 0 |
| B | 0 | 16 | 0 |
| C | 0 | 16 | 0 |
| D | 0 | 17 | 0 |
| Mode M0 | |||
|---|---|---|---|
| Quadrant | BADHDUFLAG | Total packets | Discarded packets |
| A | 0 | 14232 | 3 |
| B | 0 | 14353 | 2 |
| C | 0 | 14036 | 2 |
| D | 0 | 14832 | 2 |
| Mode SS | |||
|---|---|---|---|
| Quadrant | BADHDUFLAG | Total packets | Discarded packets |
| A | 0 | 134 | 0 |
| B | 0 | 134 | 0 |
| C | 0 | 134 | 0 |
| D | 0 | 134 | 0 |
| Quadrant | Total seconds | Saturated seconds | Saturation percentage |
|---|---|---|---|
| A | 6639 | 110 | 1.656876% |
| B | 6639 | 119 | 1.792439% |
| C | 6639 | 88 | 1.325501% |
| D | 6639 | 135 | 2.033439% |
Noise dominated data is calculated using 1-second bins in cleaned event files. If a bin has >2000 counts, and if more than 50% of those come from <1% of pixels, then it is considered to be noise-dominated and hence unusable.
| Quadrant | # 1 sec bins | Bins with >0 counts | Bins with >2000 counts | High rate bins dominated by noise | Noise dominated (total time) | Noise dominated (detector-on time) | Marked lightcurve |
|---|---|---|---|---|---|---|---|
| A | 7909 | 6639 | 0 | 0 | 0.00% | 0.00% | 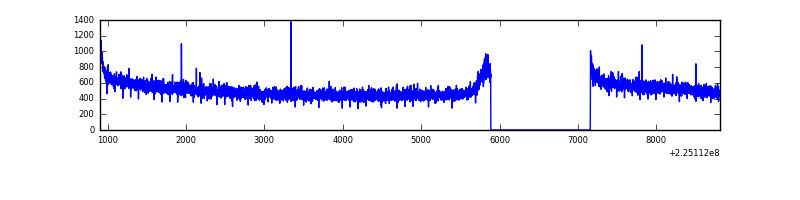 |
| B | 7909 | 6639 | 2 | 2 | 0.03% | 0.03% | 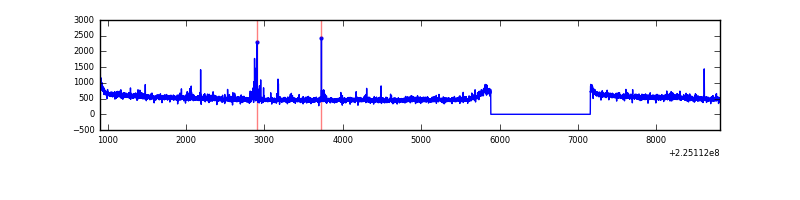 |
| C | 7909 | 6639 | 0 | 0 | 0.00% | 0.00% | 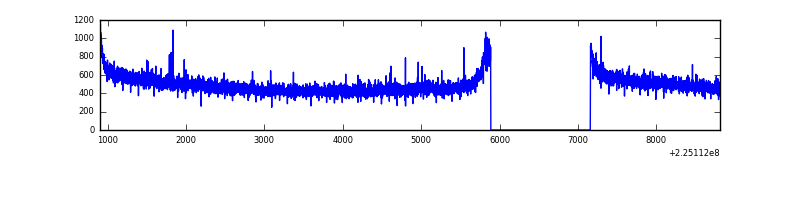 |
| D | 7909 | 6639 | 28 | 28 | 0.35% | 0.42% | 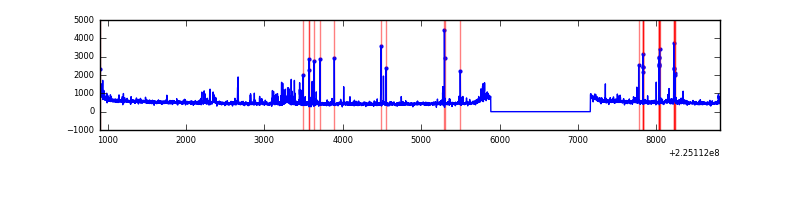 |
Top three noisy pixels from each quadrant. If the there are fewer than three noisy pixels in the level2.evt file, extra rows are filled as -1
| Pixel properties | Quadrant properties | ||||||
|---|---|---|---|---|---|---|---|
| Quadrant | DetID | PixID | Counts | Sigma | Mean | Median | Sigma |
| A | 13 | 14 | 12071 | 64.68 | 869 | 853 | 173.4 |
| A | 0 | 226 | 8404 | 43.54 | 869 | 853 | 173.4 |
| A | 12 | 194 | 7901 | 40.64 | 869 | 853 | 173.4 |
| B | 0 | 213 | 28900 | 175.31 | 868 | 850 | 160.0 |
| B | 0 | 214 | 21793 | 130.89 | 868 | 850 | 160.0 |
| B | 12 | 111 | 15795 | 93.41 | 868 | 850 | 160.0 |
| C | 8 | 229 | 7570 | 35.32 | 836 | 839 | 190.6 |
| C | 13 | 61 | 6521 | 29.82 | 836 | 839 | 190.6 |
| C | 12 | 4 | 2785 | 10.21 | 836 | 839 | 190.6 |
| D | 2 | 14 | 87627 | 436.77 | 836 | 812 | 198.8 |
| D | 2 | 152 | 86049 | 428.83 | 836 | 812 | 198.8 |
| D | 2 | 136 | 68494 | 340.51 | 836 | 812 | 198.8 |
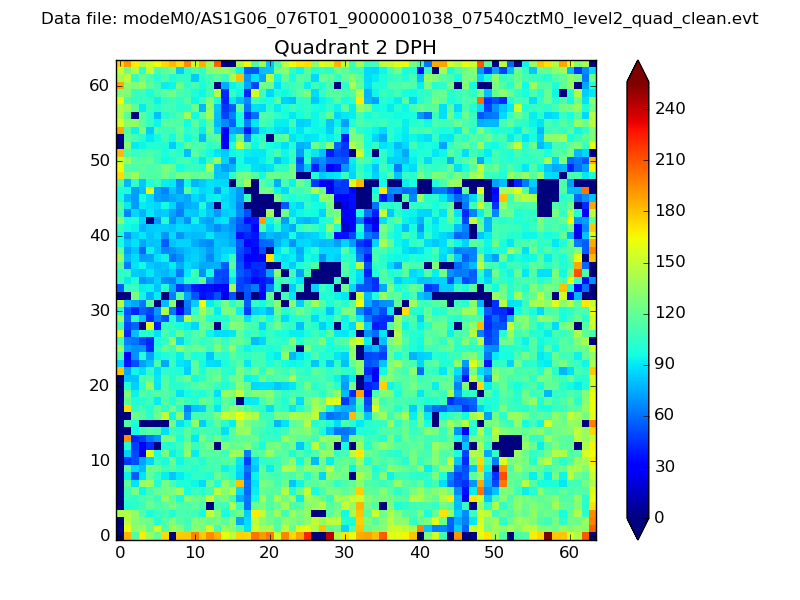
Histogram calculated using DETX and DETY for each event in the final _common_clean file
| Quadrant A |  |
 |
Quadrant B |
|---|---|---|---|
| Quadrant D | 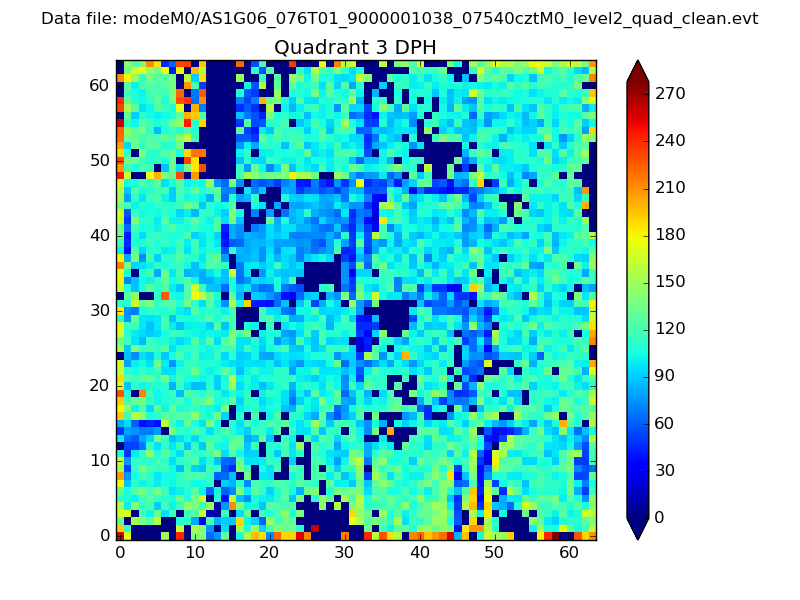 |
 |
Quadrant C |
| Plot type | Count rate plots | Images |
|---|---|---|
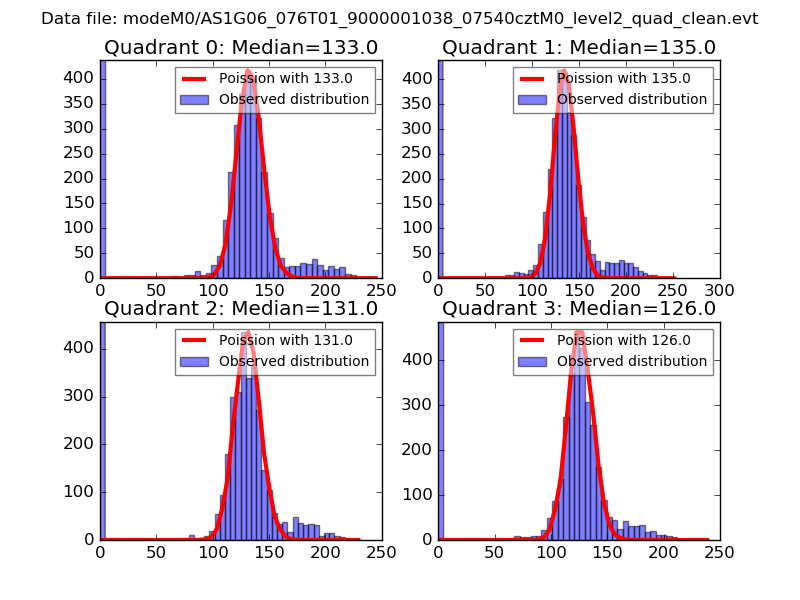
| Comparison with Poisson distribution Blue bars denote a histogram of data divided into 1 sec bins. Red curve is a Poisson curve with rate = median count rate of data. |
 |
 |
| Quadrant-wise count rates Data is divided into 100 sec bins |
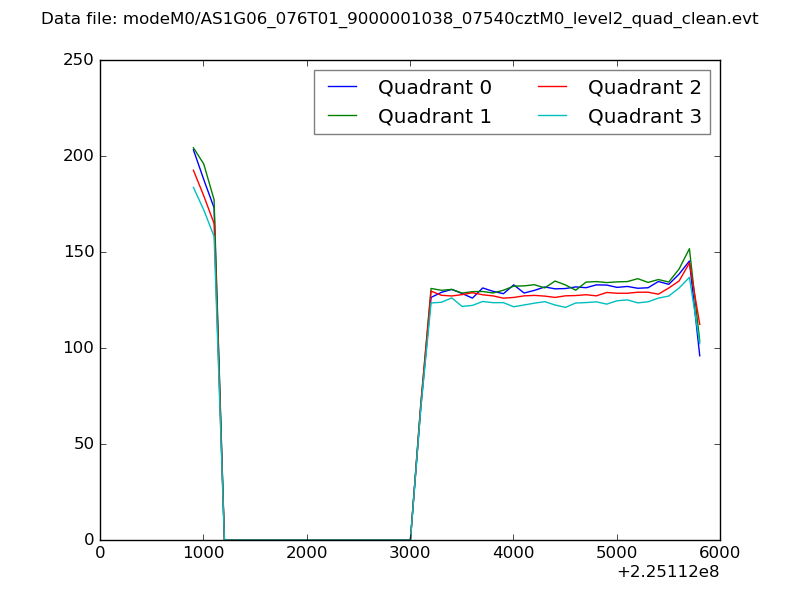 |
|
| Module-wise count rates for Quadrant A Data is divided into 100 sec bins |
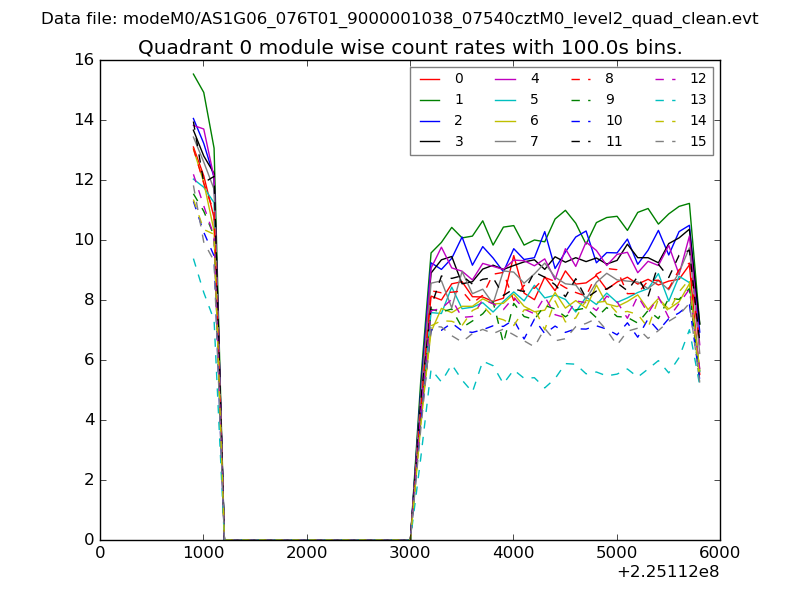 |
 |
| Module-wise count rates for Quadrant B Data is divided into 100 sec bins |
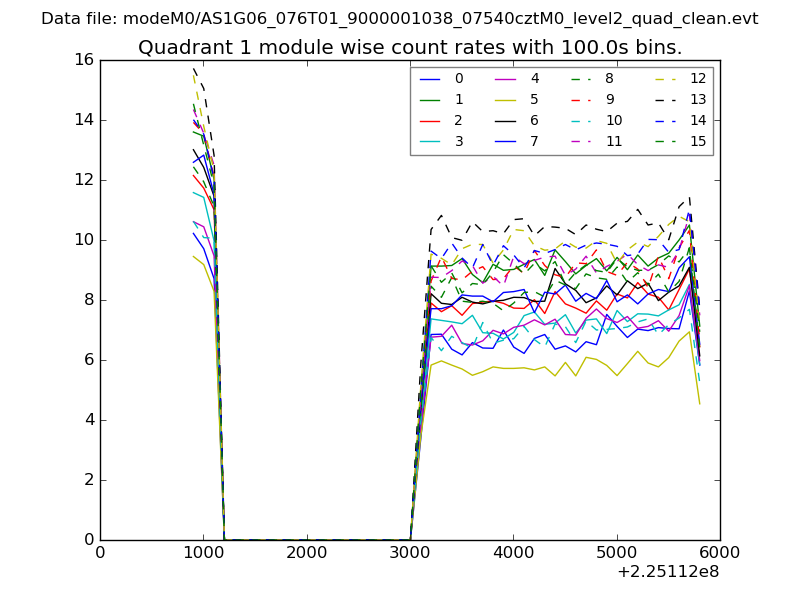 |
 |
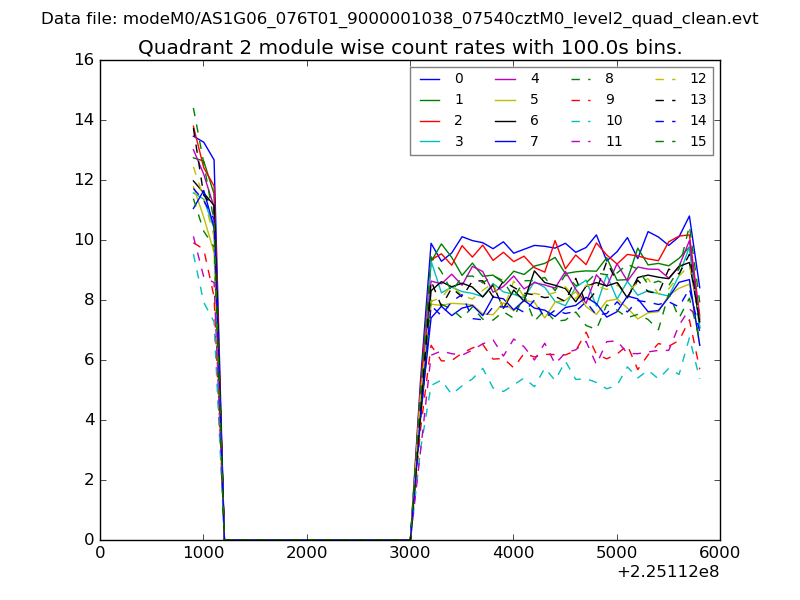
| Module-wise count rates for Quadrant C Data is divided into 100 sec bins |
 |
 |
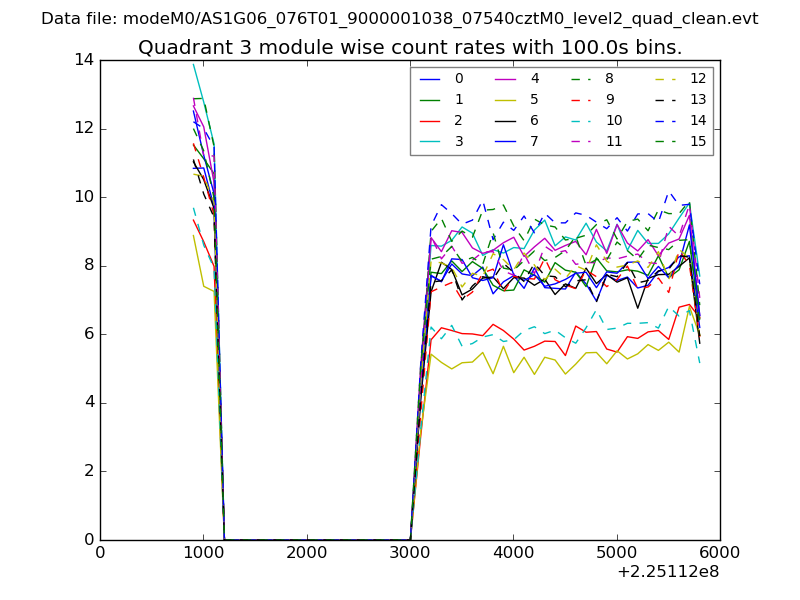
| Module-wise count rates for Quadrant D Data is divided into 100 sec bins |
 |
 |
| Parameter | Plot |
|---|---|
| CZT HV Monitor | 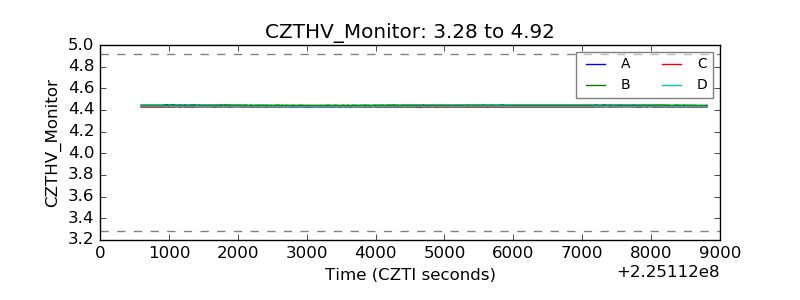 |
| D_VDD | 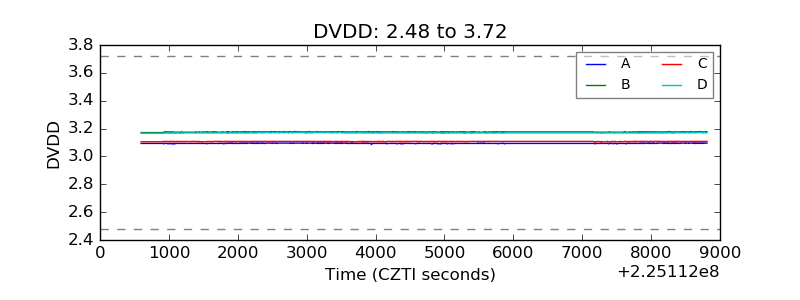 |
| Temperature 1 | 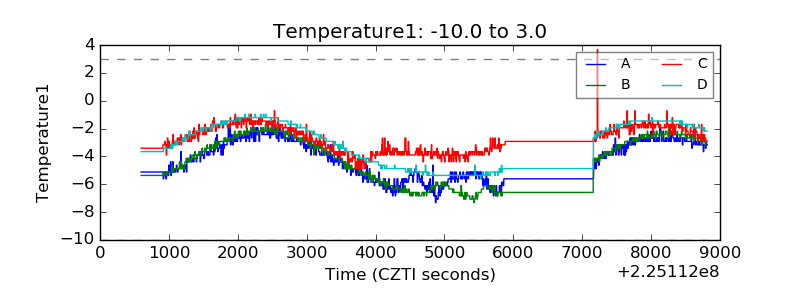 |
| Veto HV Monitor | 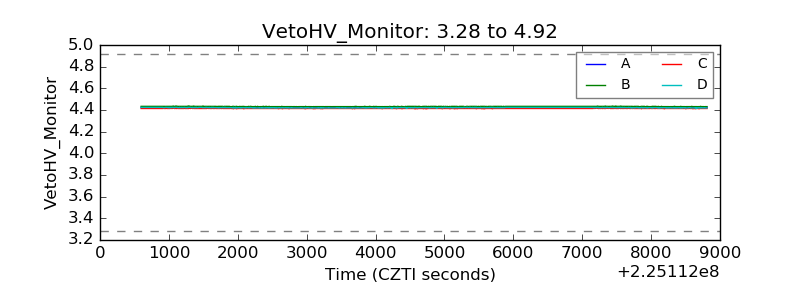 |
| Veto LLD | 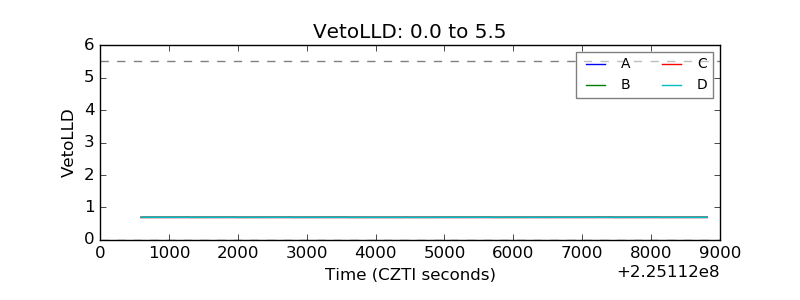 |
| Alpha Counter | 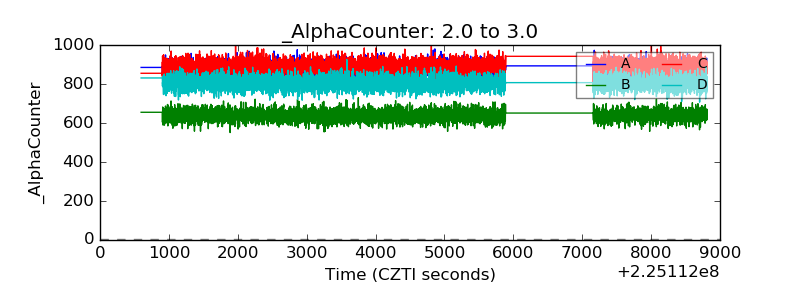 |
| _CPM_Rate | 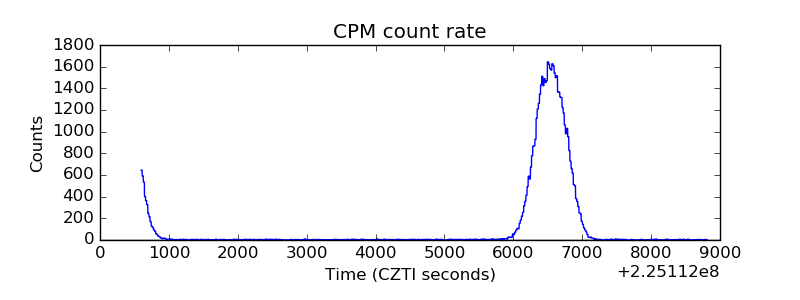 |
| CZT Counter | 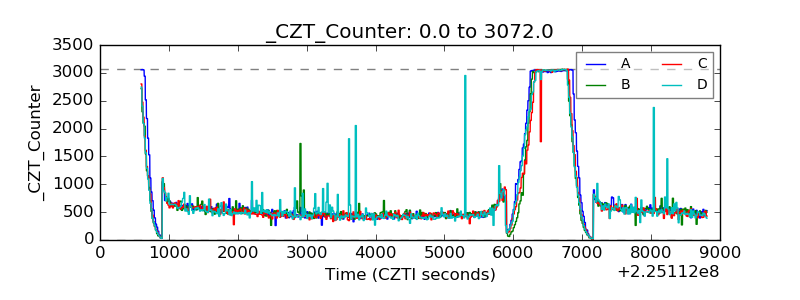 |
| +2.5 Volts monitor |  |
| +5 Volts monitor | 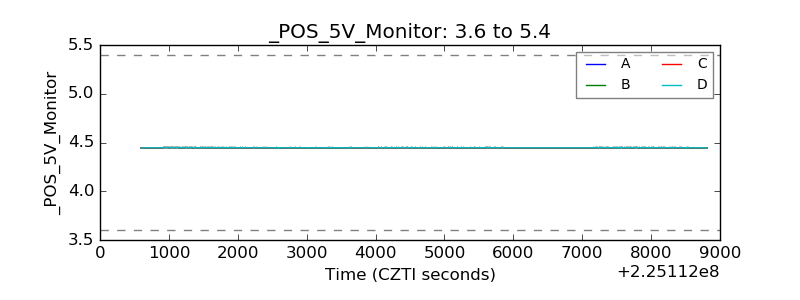 |
| _ROLL_ROT | 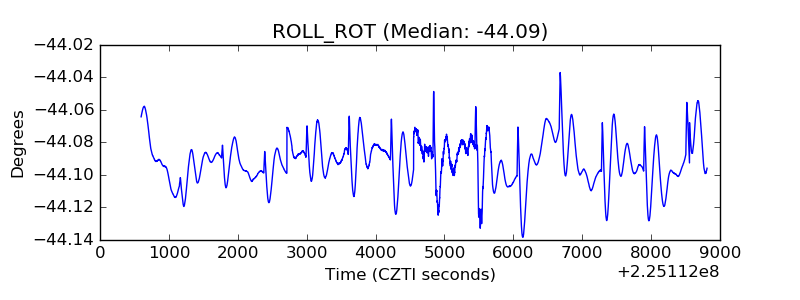 |
| _Roll_DEC | 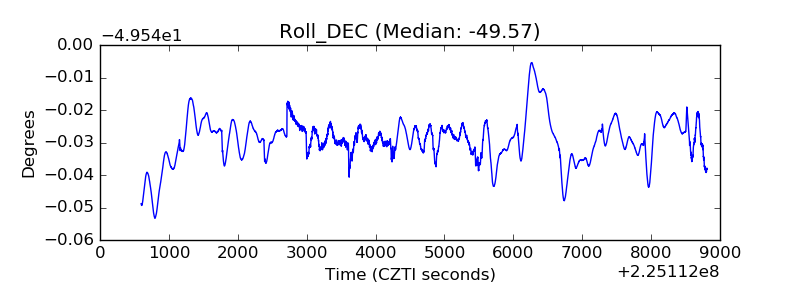 |
| _Roll_RA | 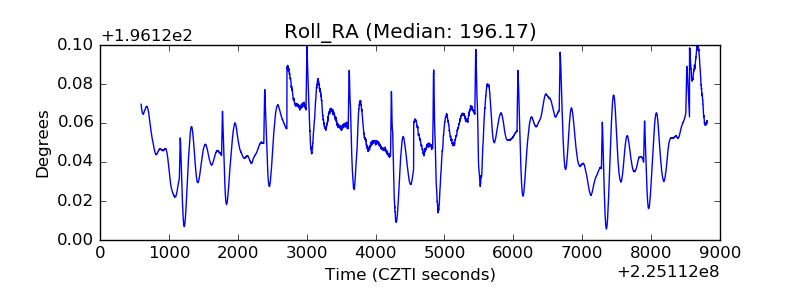 |
| Veto Counter | 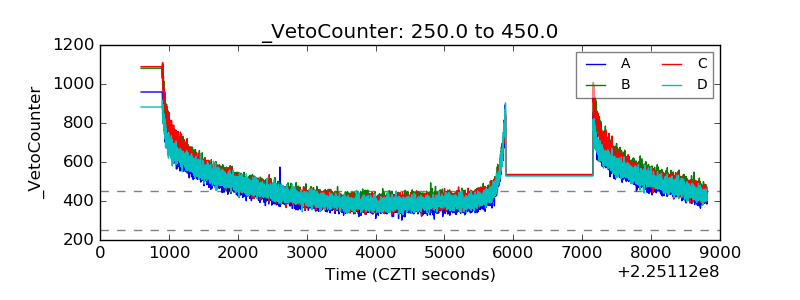 |