| Param | Original file | Final file |
|---|---|---|
| Filename | modeM0/AS1G06_076T01_9000001038_07545cztM0_level2.evt | modeM0/AS1G06_076T01_9000001038_07545cztM0_level2_quad_clean.evt |
| Size (bytes) | 573,117,120 | 103,798,080 |
| Size | 546.6 MB | 99.0 MB |
| Events in quadrant A | 3,939,338 | 647,211 |
| Events in quadrant B | 4,080,347 | 657,003 |
| Events in quadrant C | 4,364,660 | 635,828 |
| Events in quadrant D | 4,392,331 | 609,700 |
| Mode M9 | |||
|---|---|---|---|
| Quadrant | BADHDUFLAG | Total packets | Discarded packets |
| A | 0 | 7 | 0 |
| B | 0 | 7 | 0 |
| C | 0 | 7 | 0 |
| D | 0 | 7 | 0 |
| Mode M0 | |||
|---|---|---|---|
| Quadrant | BADHDUFLAG | Total packets | Discarded packets |
| A | 0 | 17662 | 3 |
| B | 0 | 17852 | 2 |
| C | 0 | 19079 | 2 |
| D | 0 | 19267 | 2 |
| Mode SS | |||
|---|---|---|---|
| Quadrant | BADHDUFLAG | Total packets | Discarded packets |
| A | 0 | 176 | 0 |
| B | 0 | 176 | 0 |
| C | 0 | 176 | 0 |
| D | 0 | 176 | 0 |
| Quadrant | Total seconds | Saturated seconds | Saturation percentage |
|---|---|---|---|
| A | 8545 | 67 | 0.784084% |
| B | 8545 | 104 | 1.217086% |
| C | 8545 | 226 | 2.644822% |
| D | 8545 | 83 | 0.971328% |
Noise dominated data is calculated using 1-second bins in cleaned event files. If a bin has >2000 counts, and if more than 50% of those come from <1% of pixels, then it is considered to be noise-dominated and hence unusable.
| Quadrant | # 1 sec bins | Bins with >0 counts | Bins with >2000 counts | High rate bins dominated by noise | Noise dominated (total time) | Noise dominated (detector-on time) | Marked lightcurve |
|---|---|---|---|---|---|---|---|
| A | 9260 | 8548 | 1 | 1 | 0.01% | 0.01% | 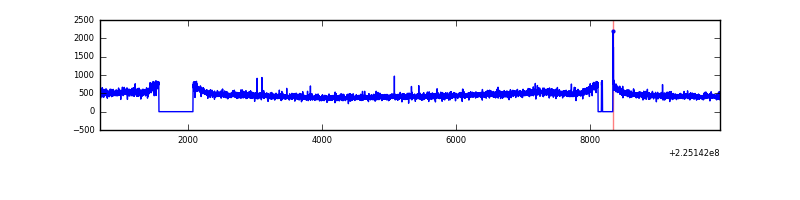 |
| B | 9260 | 8548 | 0 | 0 | 0.00% | 0.00% | 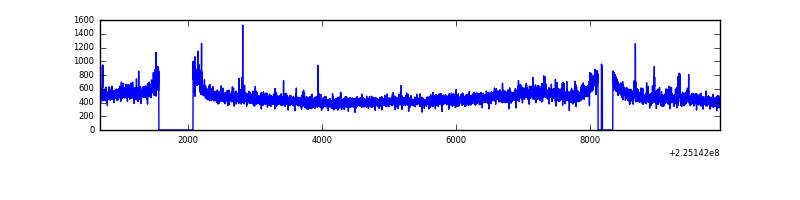 |
| C | 9260 | 8547 | 141 | 141 | 1.52% | 1.65% | 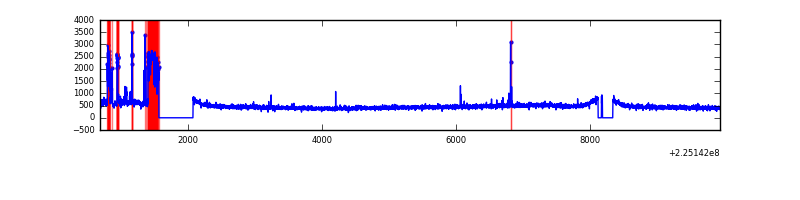 |
| D | 9260 | 8548 | 42 | 42 | 0.45% | 0.49% | 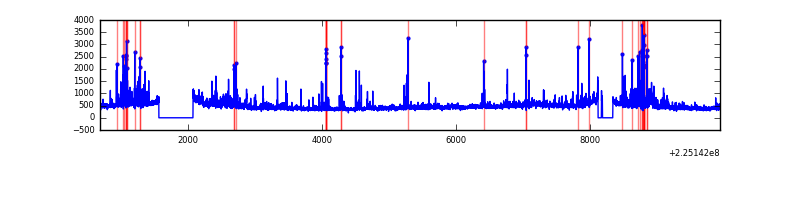 |
Top three noisy pixels from each quadrant. If the there are fewer than three noisy pixels in the level2.evt file, extra rows are filled as -1
| Pixel properties | Quadrant properties | ||||||
|---|---|---|---|---|---|---|---|
| Quadrant | DetID | PixID | Counts | Sigma | Mean | Median | Sigma |
| A | 13 | 14 | 10256 | 44.99 | 1017 | 995 | 205.9 |
| A | 0 | 226 | 9617 | 41.88 | 1017 | 995 | 205.9 |
| A | 12 | 194 | 9248 | 40.09 | 1017 | 995 | 205.9 |
| B | 0 | 219 | 31090 | 153.41 | 1026 | 1000 | 196.1 |
| B | 0 | 214 | 24349 | 119.04 | 1026 | 1000 | 196.1 |
| B | 12 | 111 | 19543 | 94.54 | 1026 | 1000 | 196.1 |
| C | 9 | 68 | 509998 | 2248.52 | 973 | 975 | 226.4 |
| C | 1 | 16 | 22617 | 95.6 | 973 | 975 | 226.4 |
| C | 8 | 128 | 18317 | 76.61 | 973 | 975 | 226.4 |
| D | 2 | 136 | 233339 | 964.5 | 981 | 947 | 240.9 |
| D | 2 | 152 | 204995 | 846.87 | 981 | 947 | 240.9 |
| D | 2 | 14 | 130528 | 537.8 | 981 | 947 | 240.9 |
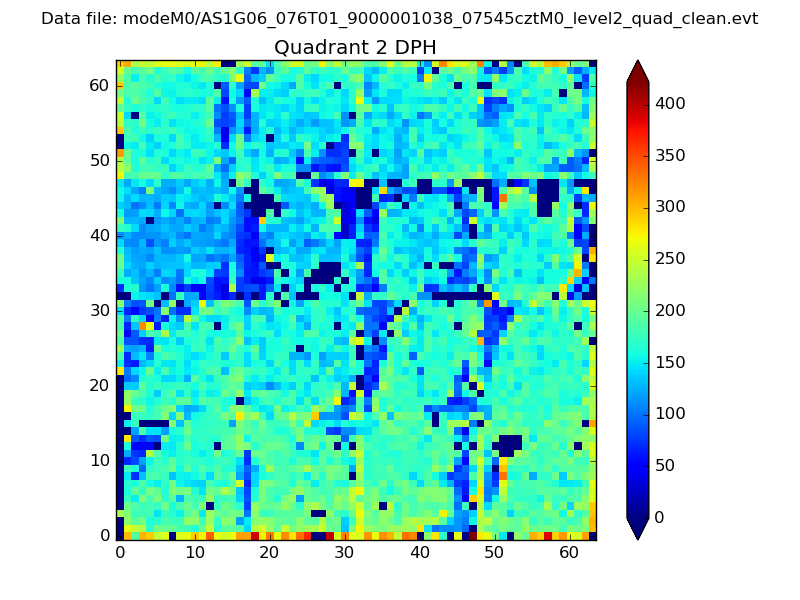
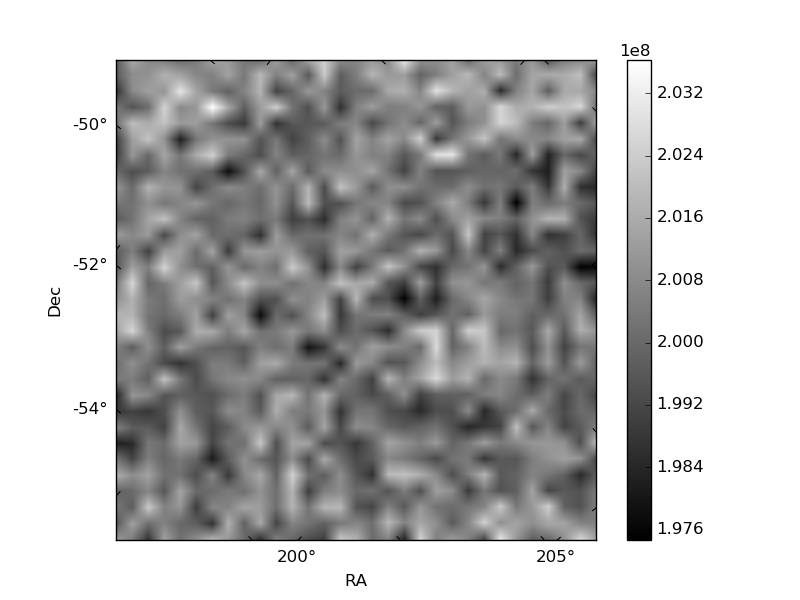
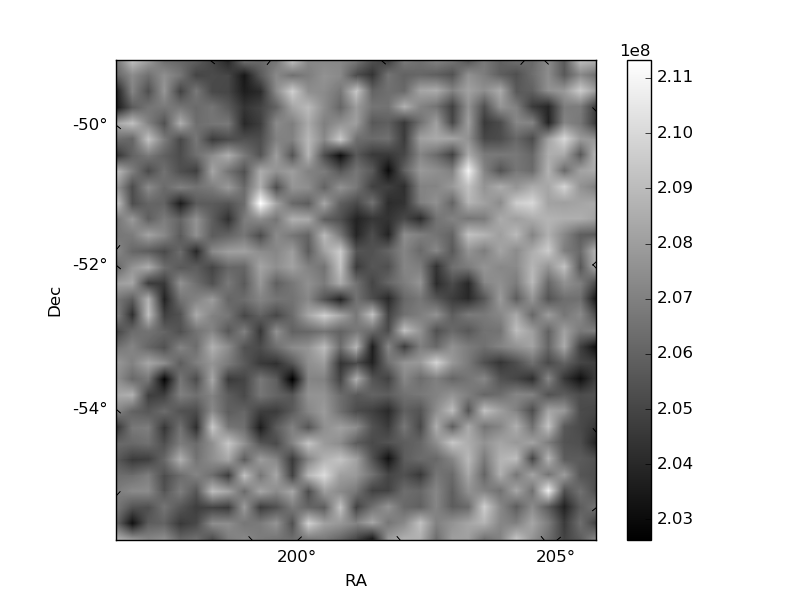
Histogram calculated using DETX and DETY for each event in the final _common_clean file
| Quadrant A |  |
 |
Quadrant B |
|---|---|---|---|
| Quadrant D | 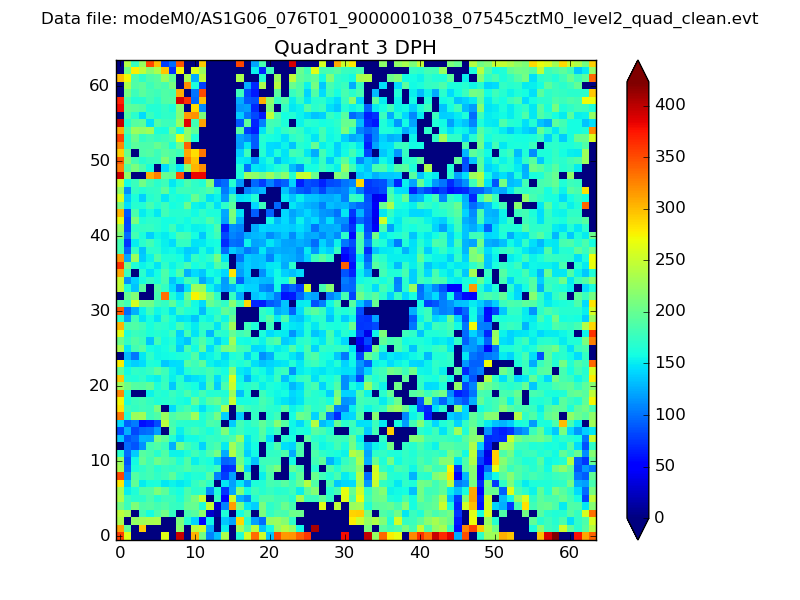 |
 |
Quadrant C |
| Plot type | Count rate plots | Images |
|---|---|---|
| Comparison with Poisson distribution Blue bars denote a histogram of data divided into 1 sec bins. Red curve is a Poisson curve with rate = median count rate of data. |
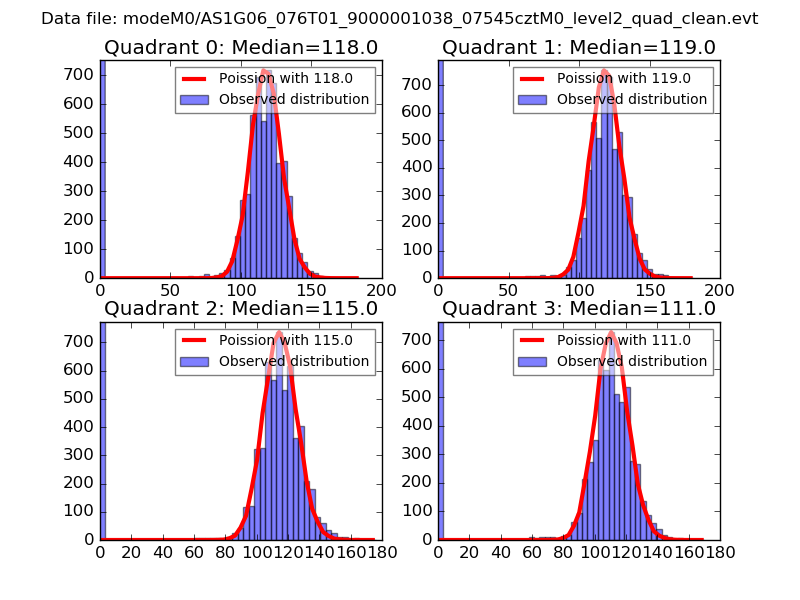 |
 |
| Quadrant-wise count rates Data is divided into 100 sec bins |
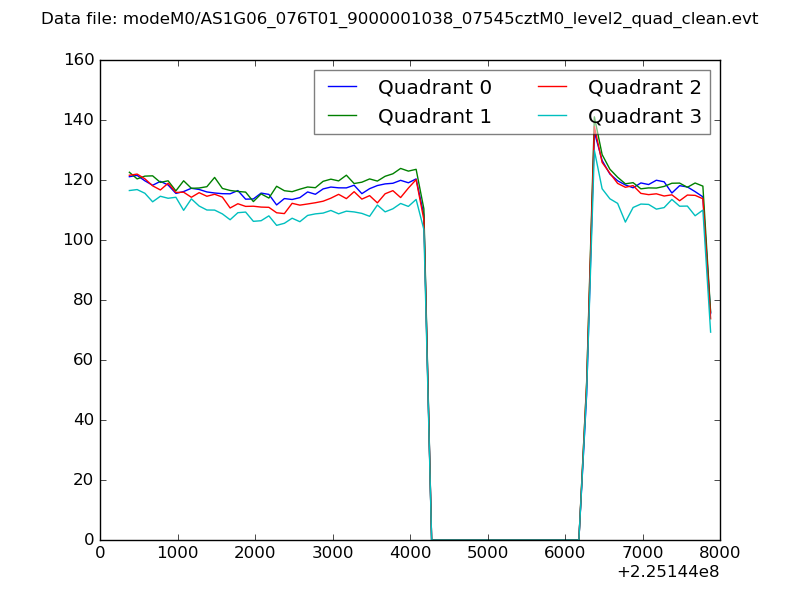 |
|
| Module-wise count rates for Quadrant A Data is divided into 100 sec bins |
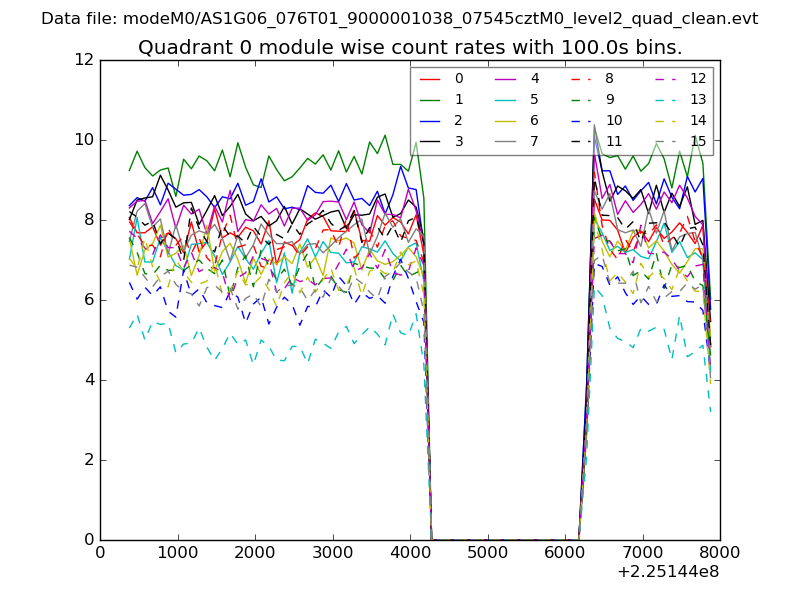 |
 |
| Module-wise count rates for Quadrant B Data is divided into 100 sec bins |
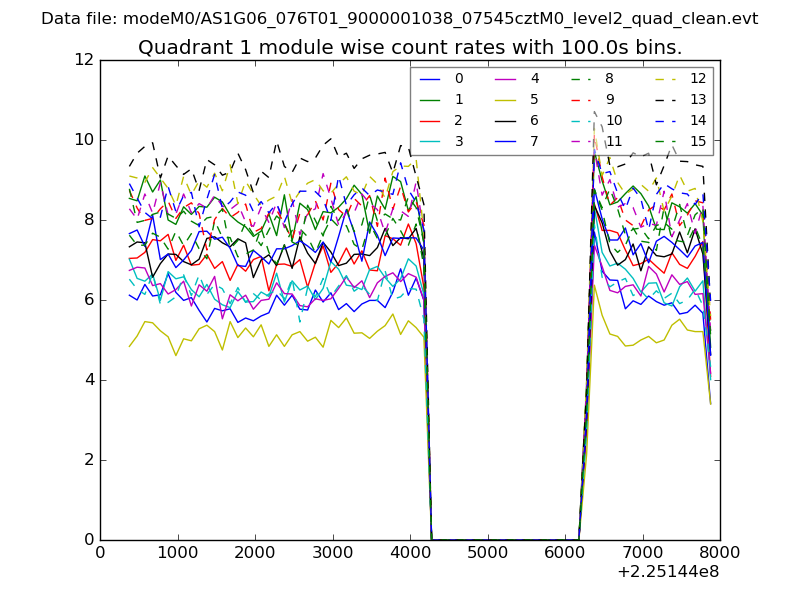 |
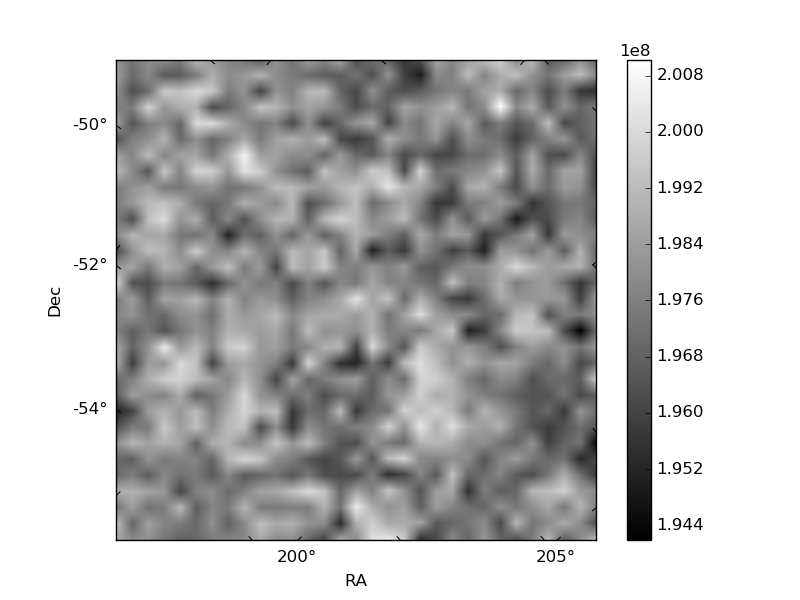 |
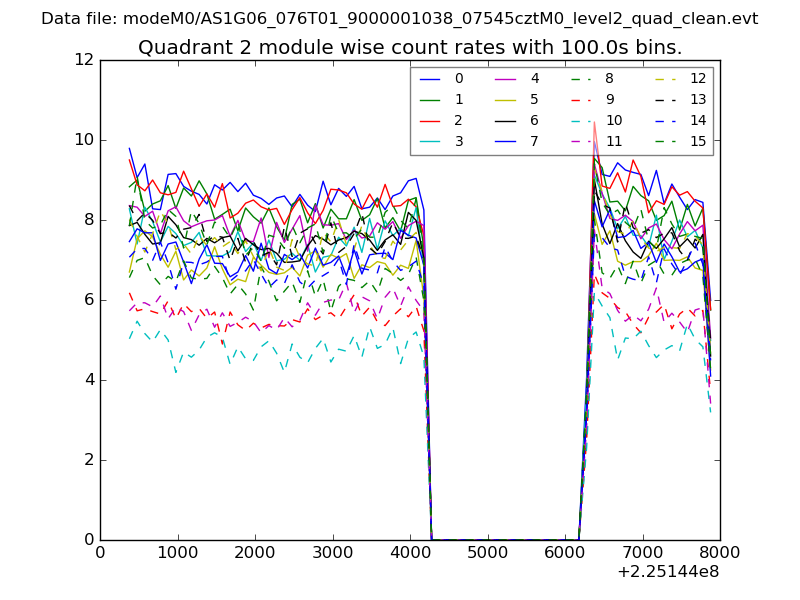
| Module-wise count rates for Quadrant C Data is divided into 100 sec bins |
 |
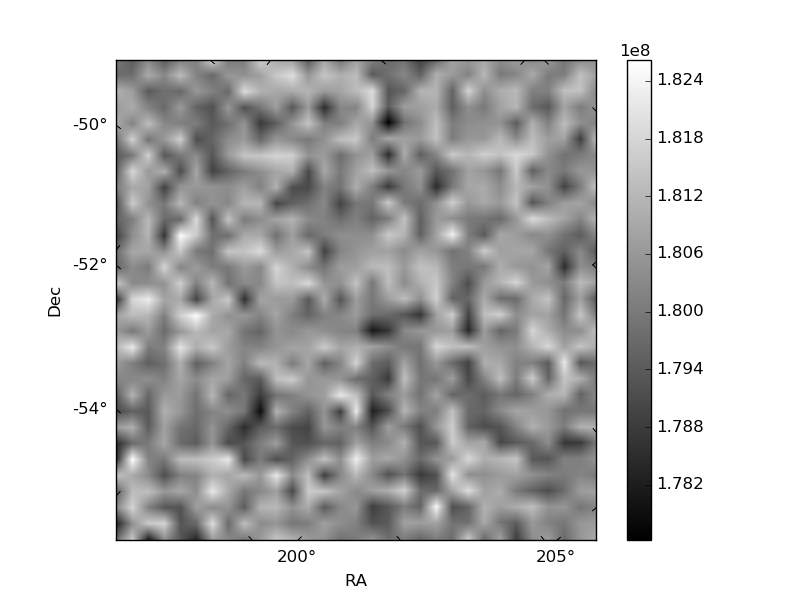 |
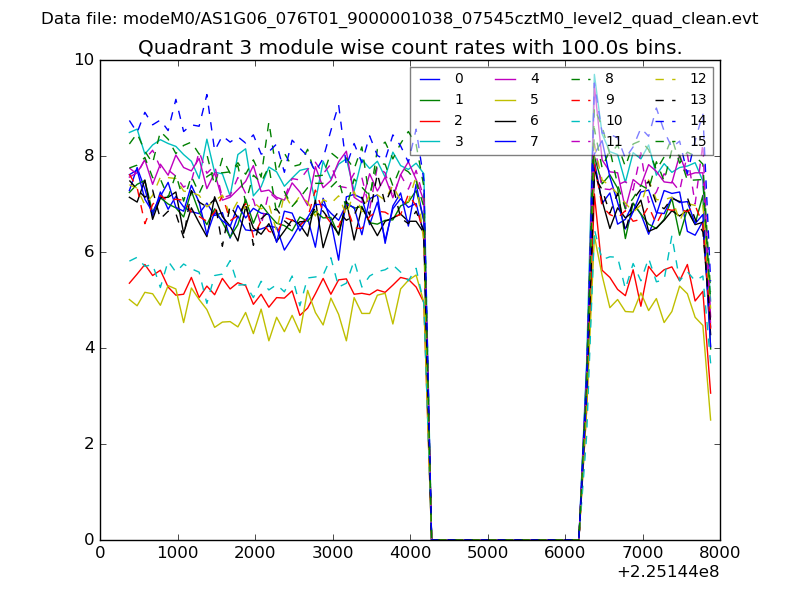
| Module-wise count rates for Quadrant D Data is divided into 100 sec bins |
 |
 |
| Parameter | Plot |
|---|---|
| CZT HV Monitor | 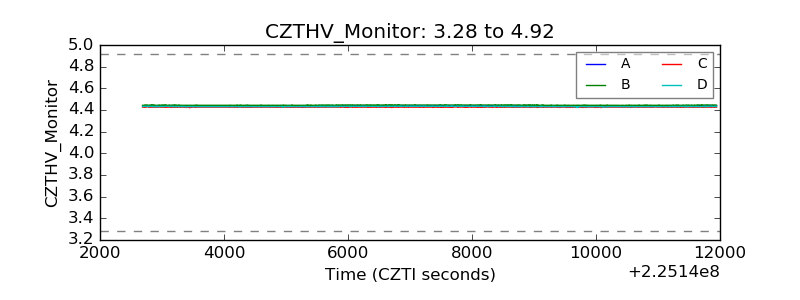 |
| D_VDD | 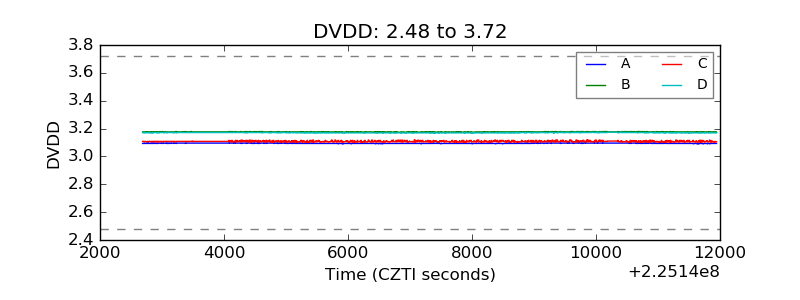 |
| Temperature 1 | 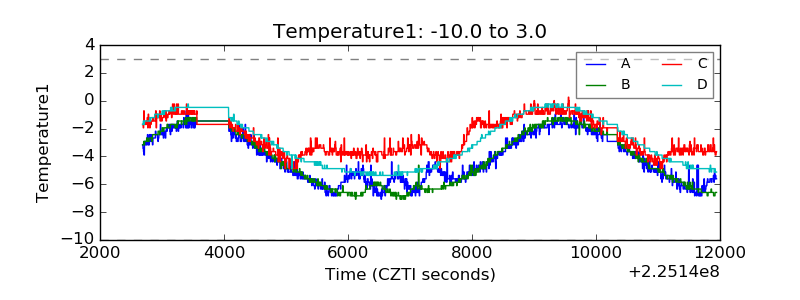 |
| Veto HV Monitor | 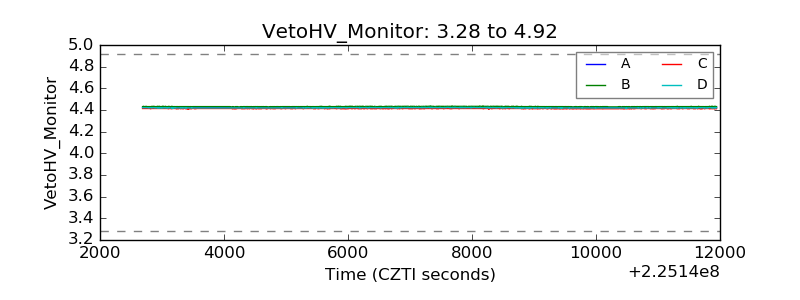 |
| Veto LLD |  |
| Alpha Counter | 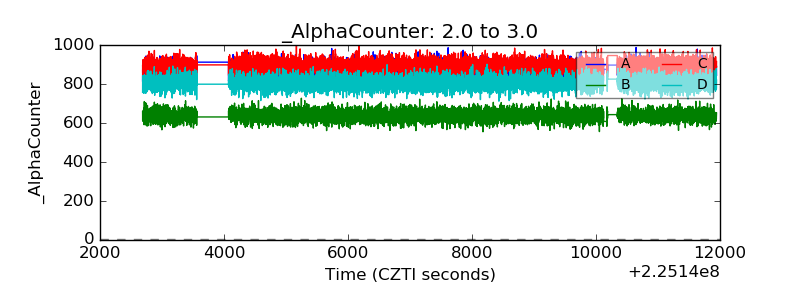 |
| _CPM_Rate | 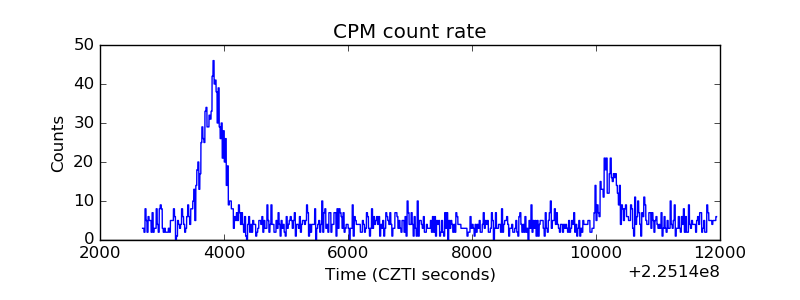 |
| CZT Counter | 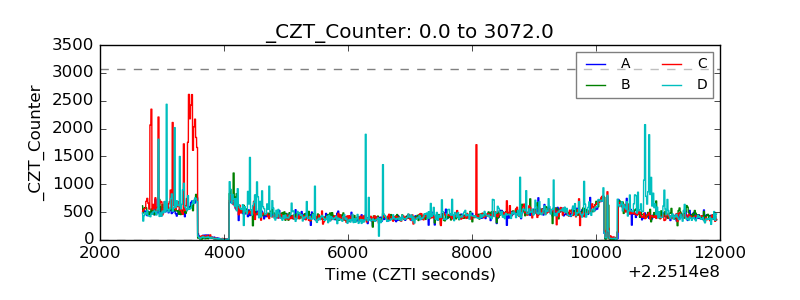 |
| +2.5 Volts monitor |  |
| +5 Volts monitor | 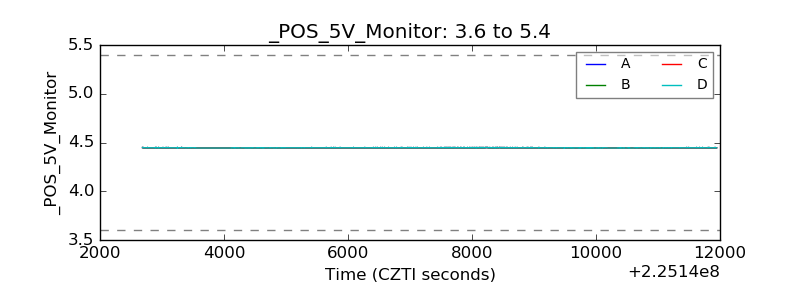 |
| _ROLL_ROT | 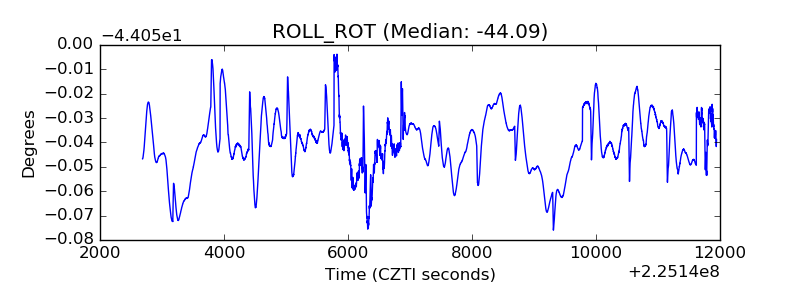 |
| _Roll_DEC | 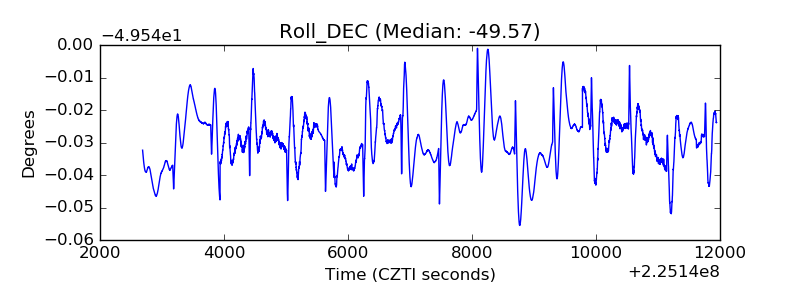 |
| _Roll_RA | 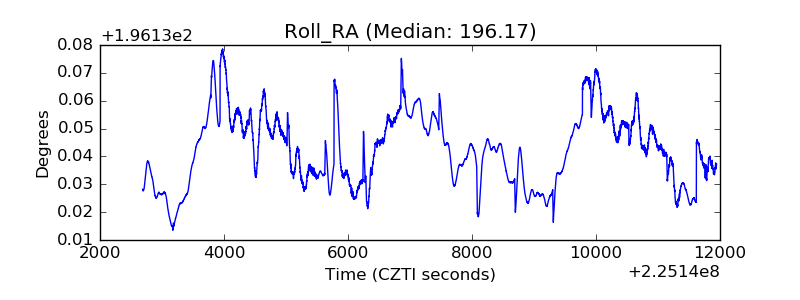 |
| Veto Counter | 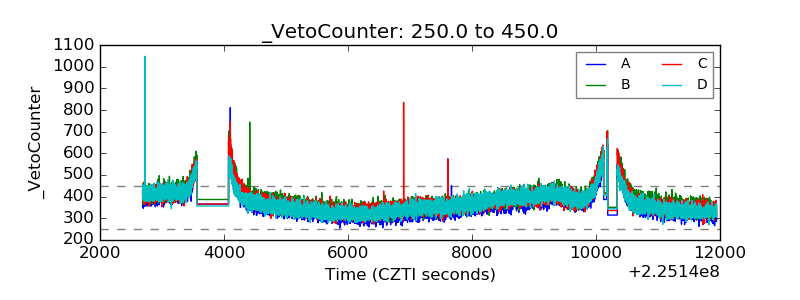 |