| Param | Original file | Final file |
|---|---|---|
| Filename | modeM0/AS1G06_076T01_9000001038_07549cztM0_level2.evt | modeM0/AS1G06_076T01_9000001038_07549cztM0_level2_quad_clean.evt |
| Size (bytes) | 557,458,560 | 111,418,560 |
| Size | 531.6 MB | 106.3 MB |
| Events in quadrant A | 3,940,857 | 702,763 |
| Events in quadrant B | 4,075,705 | 717,154 |
| Events in quadrant C | 3,977,065 | 691,702 |
| Events in quadrant D | 4,299,871 | 660,135 |
| Mode M9 | |||
|---|---|---|---|
| Quadrant | BADHDUFLAG | Total packets | Discarded packets |
| A | 0 | 5 | 0 |
| B | 0 | 5 | 0 |
| C | 0 | 5 | 0 |
| D | 0 | 5 | 0 |
| Mode M0 | |||
|---|---|---|---|
| Quadrant | BADHDUFLAG | Total packets | Discarded packets |
| A | 0 | 17827 | 3 |
| B | 0 | 18052 | 2 |
| C | 0 | 17925 | 4 |
| D | 0 | 19076 | 2 |
| Mode SS | |||
|---|---|---|---|
| Quadrant | BADHDUFLAG | Total packets | Discarded packets |
| A | 0 | 178 | 0 |
| B | 0 | 178 | 0 |
| C | 0 | 178 | 0 |
| D | 0 | 178 | 0 |
| Quadrant | Total seconds | Saturated seconds | Saturation percentage |
|---|---|---|---|
| A | 8677 | 43 | 0.495563% |
| B | 8678 | 76 | 0.875778% |
| C | 8677 | 39 | 0.449464% |
| D | 8678 | 75 | 0.864254% |
Noise dominated data is calculated using 1-second bins in cleaned event files. If a bin has >2000 counts, and if more than 50% of those come from <1% of pixels, then it is considered to be noise-dominated and hence unusable.
| Quadrant | # 1 sec bins | Bins with >0 counts | Bins with >2000 counts | High rate bins dominated by noise | Noise dominated (total time) | Noise dominated (detector-on time) | Marked lightcurve |
|---|---|---|---|---|---|---|---|
| A | 9204 | 8681 | 1 | 1 | 0.01% | 0.01% | 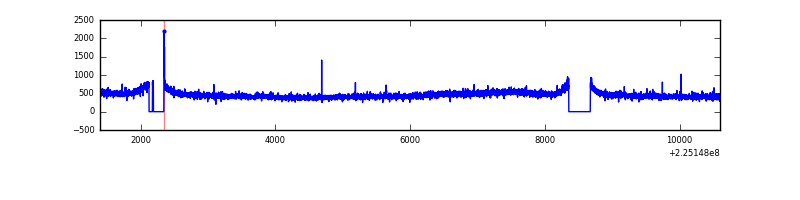 |
| B | 9204 | 8681 | 0 | 0 | 0.00% | 0.00% | 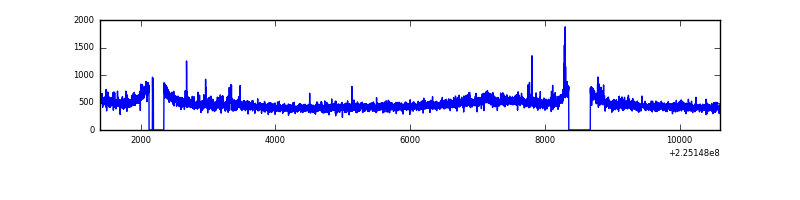 |
| C | 9204 | 8681 | 12 | 12 | 0.13% | 0.14% | 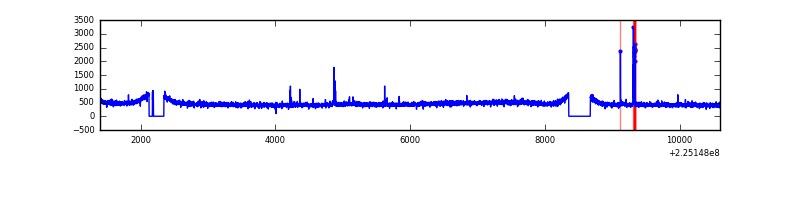 |
| D | 9204 | 8681 | 53 | 53 | 0.58% | 0.61% | 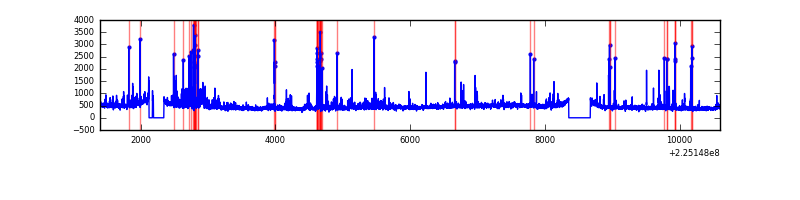 |
Top three noisy pixels from each quadrant. If the there are fewer than three noisy pixels in the level2.evt file, extra rows are filled as -1
| Pixel properties | Quadrant properties | ||||||
|---|---|---|---|---|---|---|---|
| Quadrant | DetID | PixID | Counts | Sigma | Mean | Median | Sigma |
| A | 15 | 239 | 13274 | 59.27 | 1014 | 990 | 207.3 |
| A | 0 | 226 | 9448 | 40.81 | 1014 | 990 | 207.3 |
| A | 12 | 194 | 8884 | 38.09 | 1014 | 990 | 207.3 |
| B | 0 | 219 | 32602 | 159.53 | 1027 | 1001 | 198.1 |
| B | 0 | 214 | 24976 | 121.03 | 1027 | 1001 | 198.1 |
| B | 0 | 230 | 23075 | 111.44 | 1027 | 1001 | 198.1 |
| C | 9 | 68 | 75705 | 325.62 | 986 | 989 | 229.5 |
| C | 1 | 16 | 20208 | 83.76 | 986 | 989 | 229.5 |
| C | 8 | 128 | 15083 | 61.42 | 986 | 989 | 229.5 |
| D | 2 | 14 | 198203 | 815.63 | 979 | 947 | 241.8 |
| D | 2 | 136 | 187511 | 771.42 | 979 | 947 | 241.8 |
| D | 2 | 152 | 131934 | 541.62 | 979 | 947 | 241.8 |
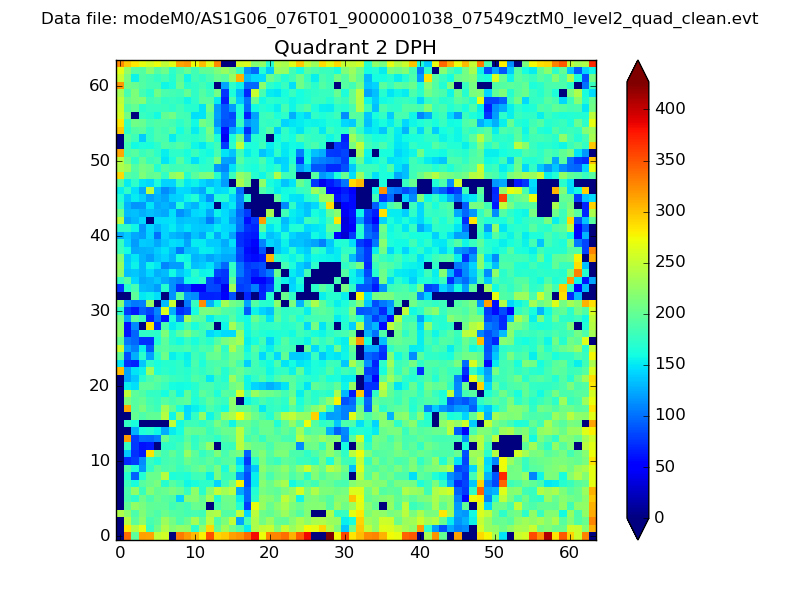
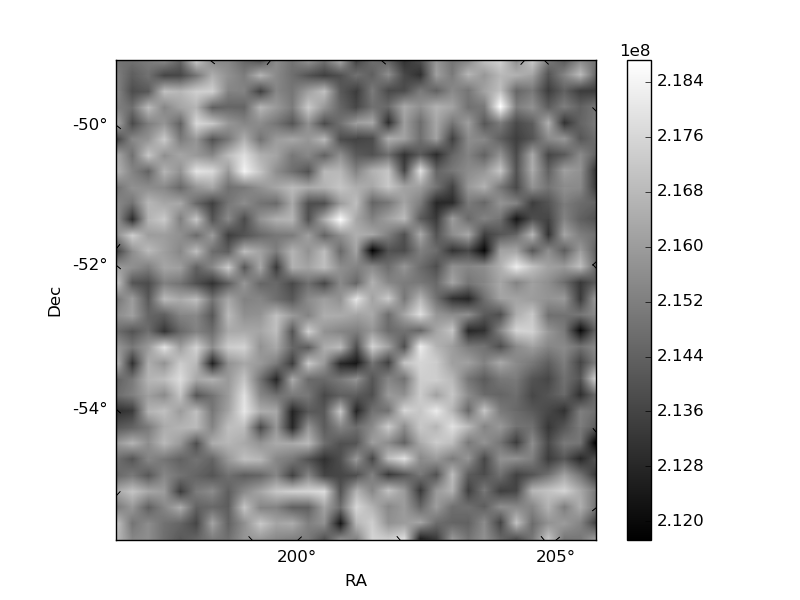
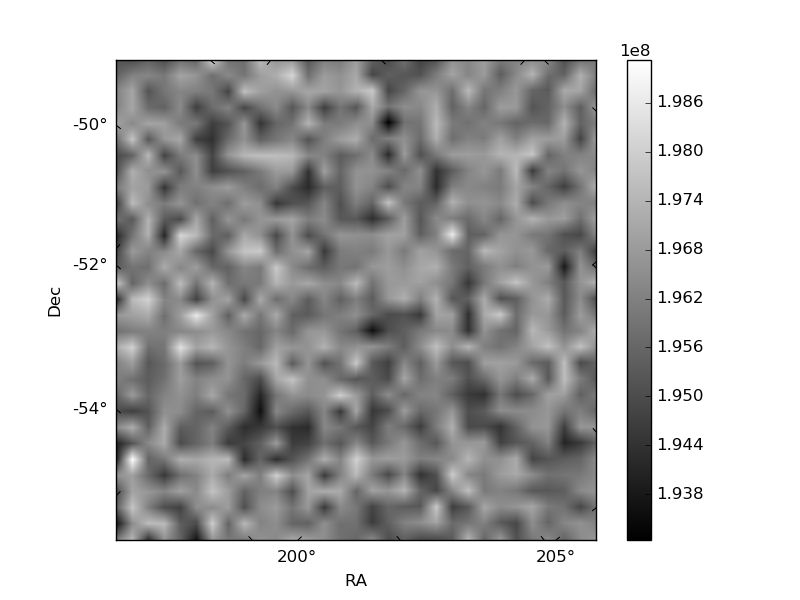
Histogram calculated using DETX and DETY for each event in the final _common_clean file
| Quadrant A |  |
 |
Quadrant B |
|---|---|---|---|
| Quadrant D | 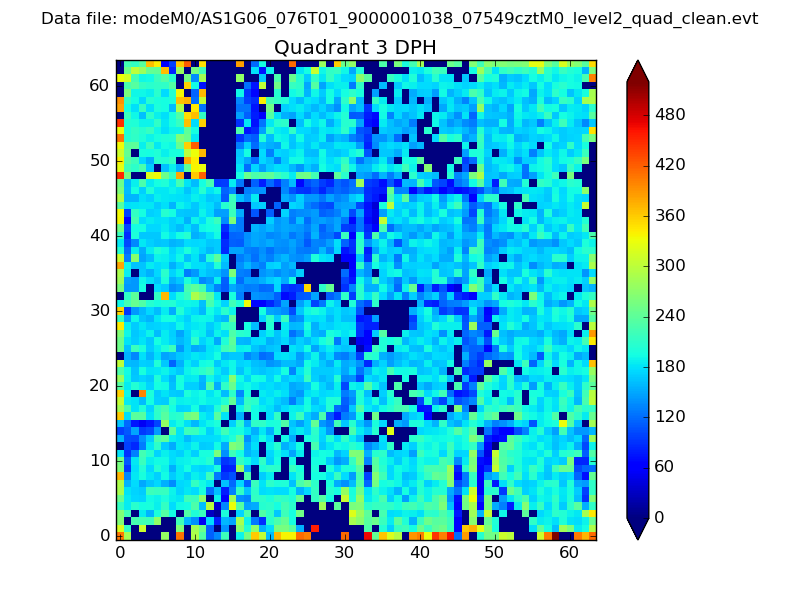 |
 |
Quadrant C |
| Plot type | Count rate plots | Images |
|---|---|---|
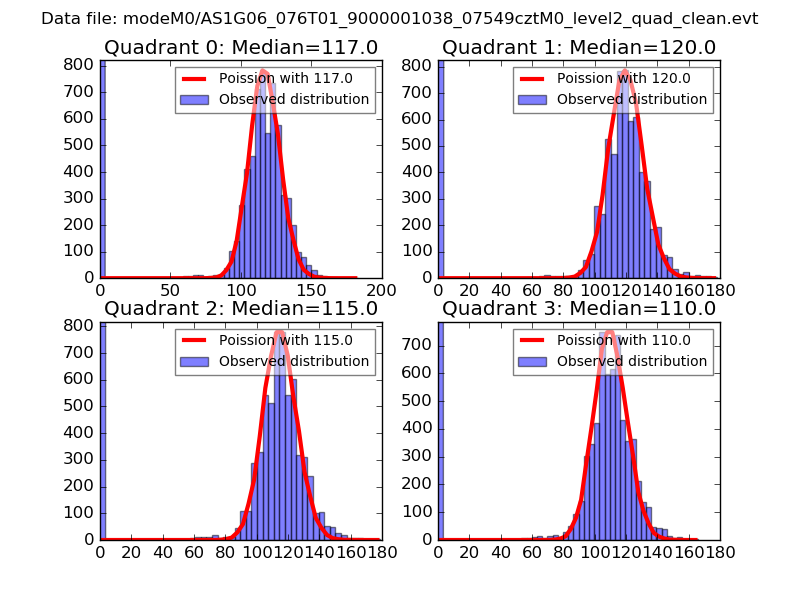
| Comparison with Poisson distribution Blue bars denote a histogram of data divided into 1 sec bins. Red curve is a Poisson curve with rate = median count rate of data. |
 |
 |
| Quadrant-wise count rates Data is divided into 100 sec bins |
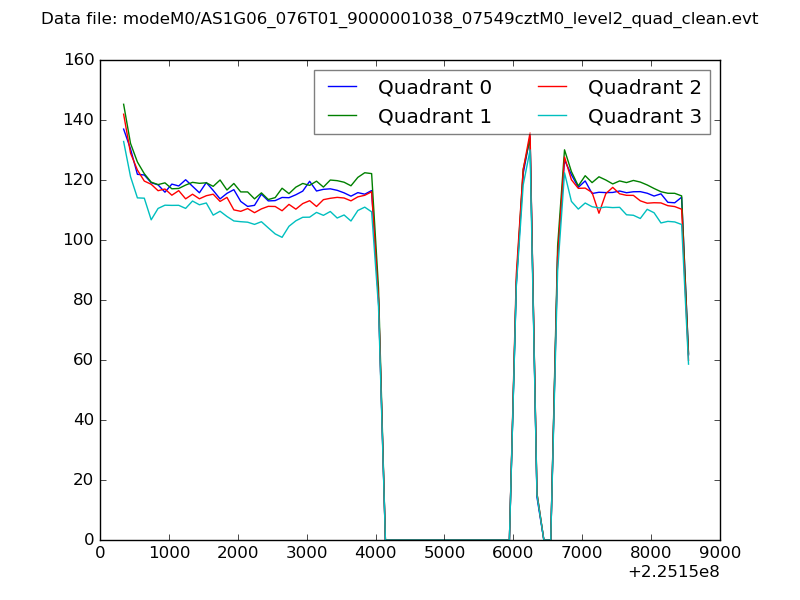 |
|
| Module-wise count rates for Quadrant A Data is divided into 100 sec bins |
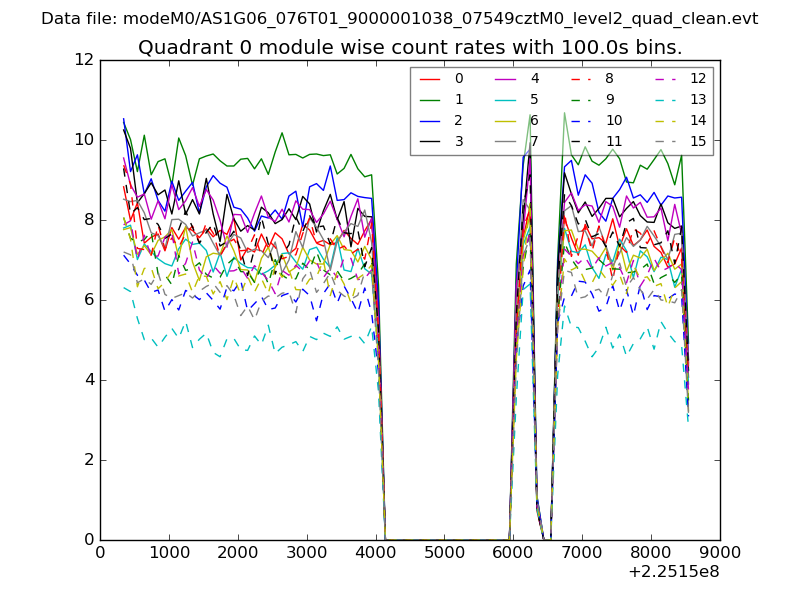 |
 |
| Module-wise count rates for Quadrant B Data is divided into 100 sec bins |
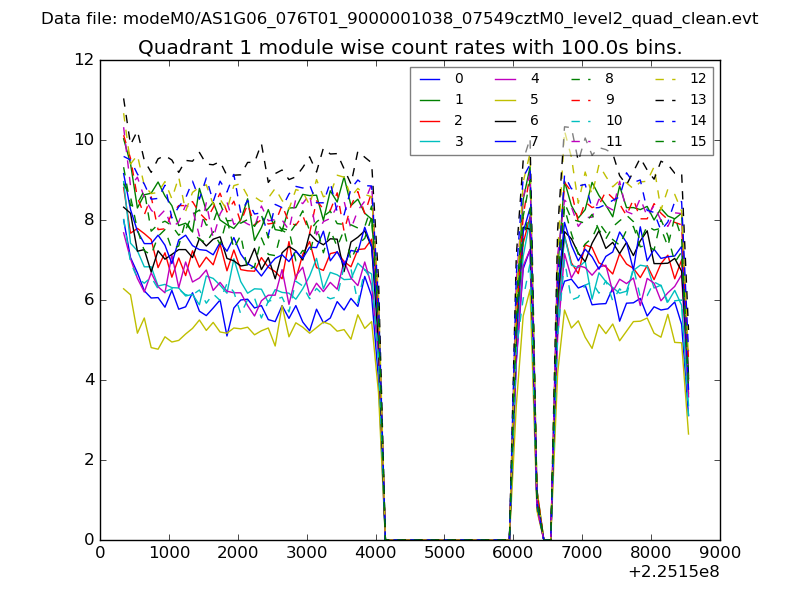 |
 |
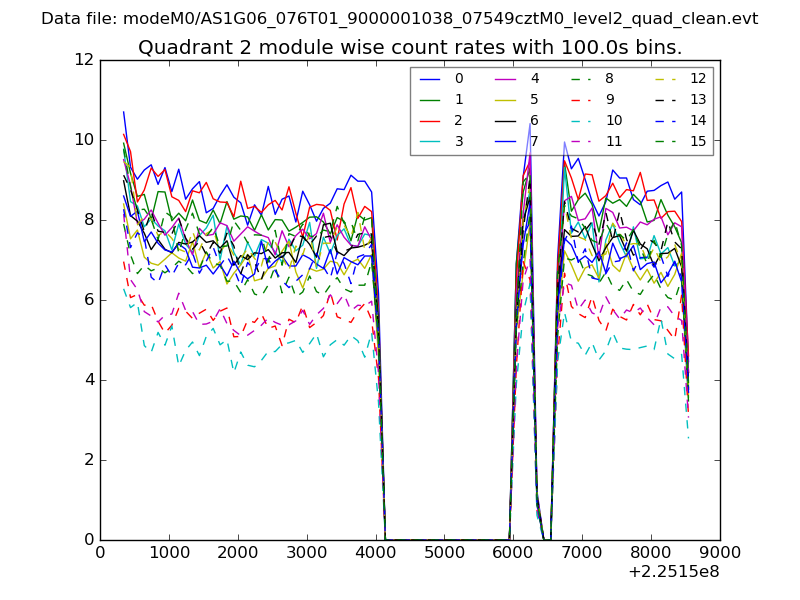
| Module-wise count rates for Quadrant C Data is divided into 100 sec bins |
 |
 |
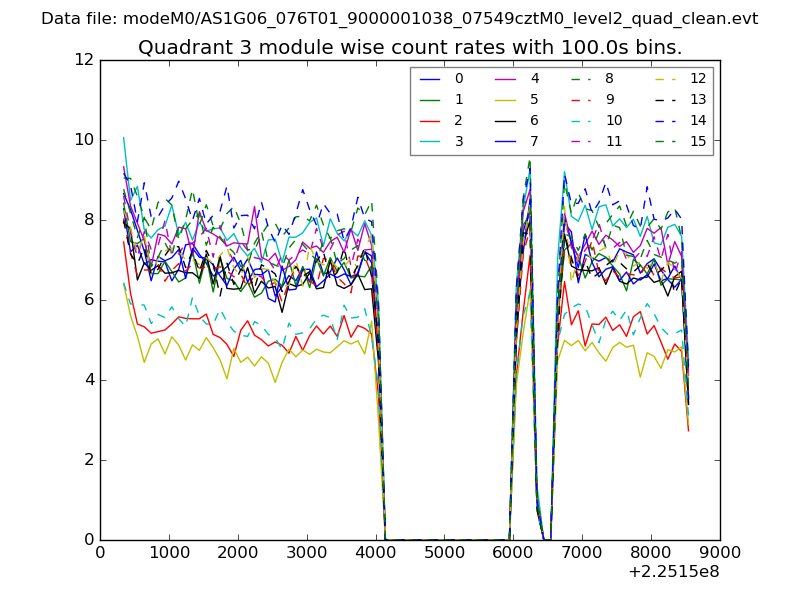
| Module-wise count rates for Quadrant D Data is divided into 100 sec bins |
 |
 |
| Parameter | Plot |
|---|---|
| CZT HV Monitor |  |
| D_VDD | 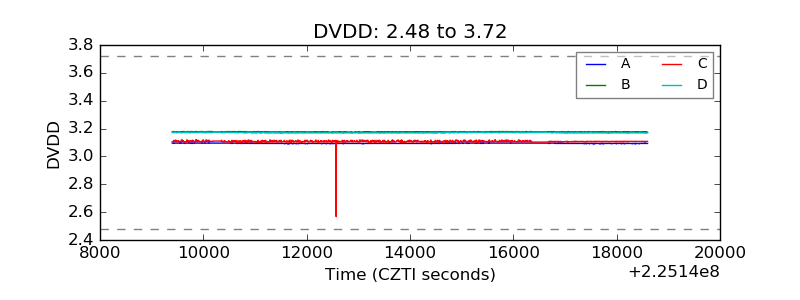 |
| Temperature 1 | 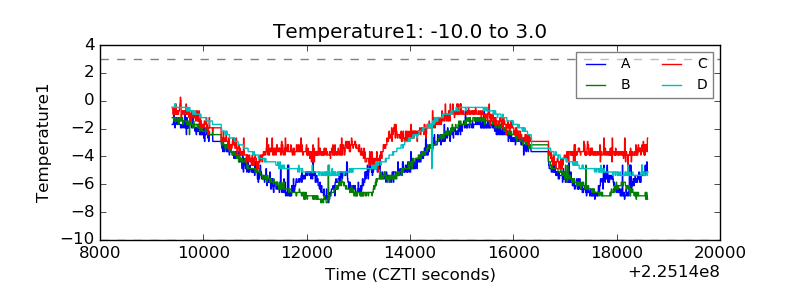 |
| Veto HV Monitor | 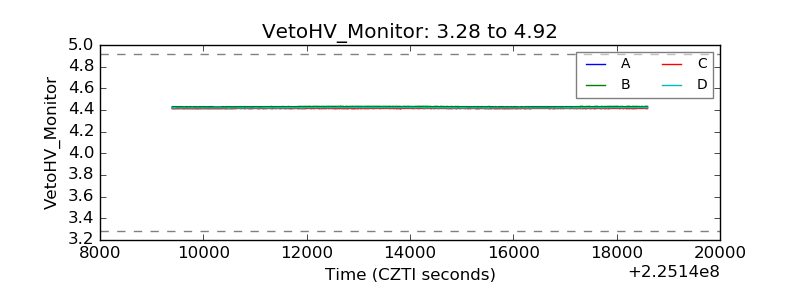 |
| Veto LLD | 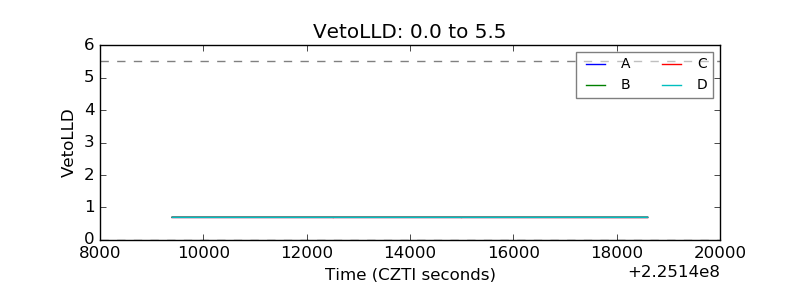 |
| Alpha Counter | 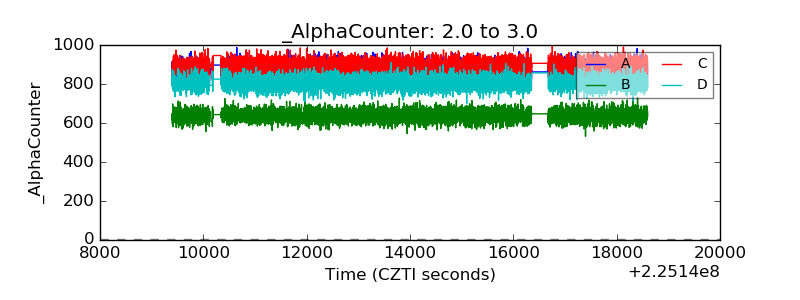 |
| _CPM_Rate | 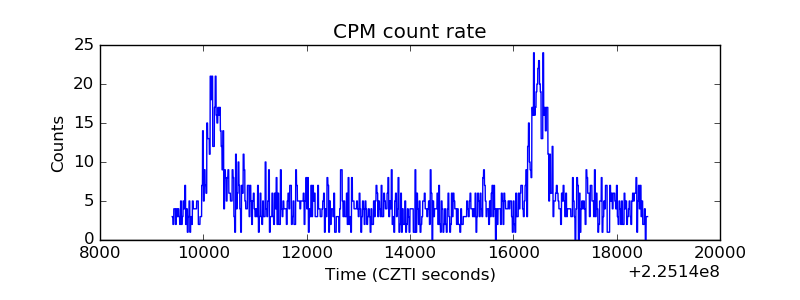 |
| CZT Counter | 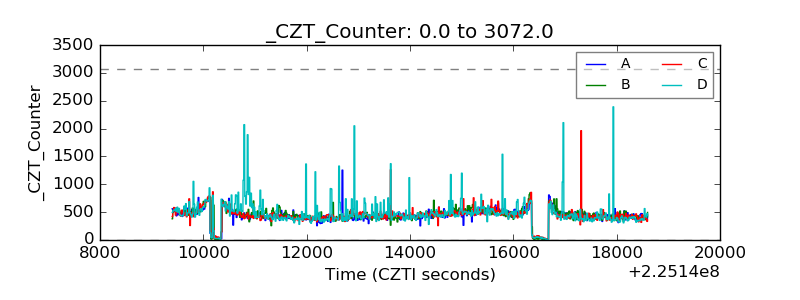 |
| +2.5 Volts monitor |  |
| +5 Volts monitor |  |
| _ROLL_ROT | 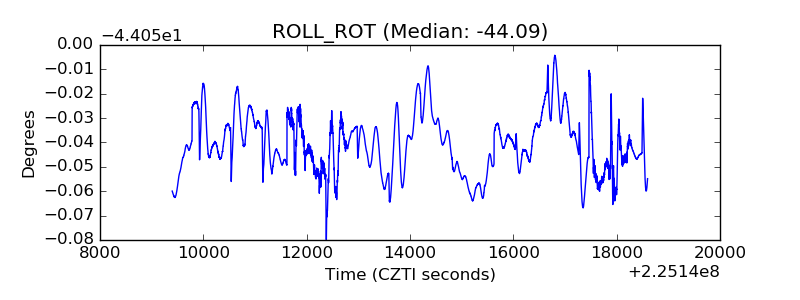 |
| _Roll_DEC | 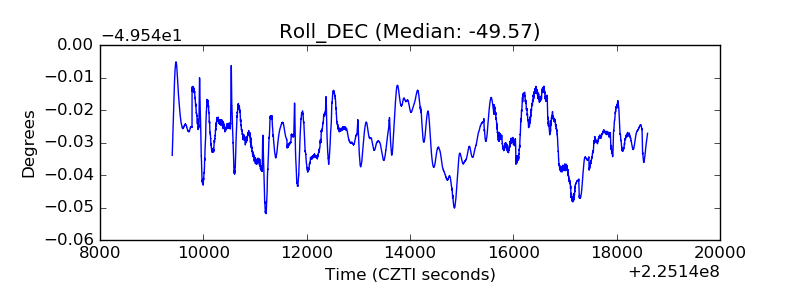 |
| _Roll_RA | 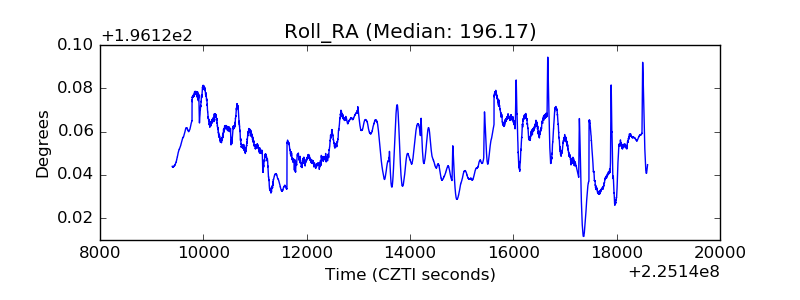 |
| Veto Counter | 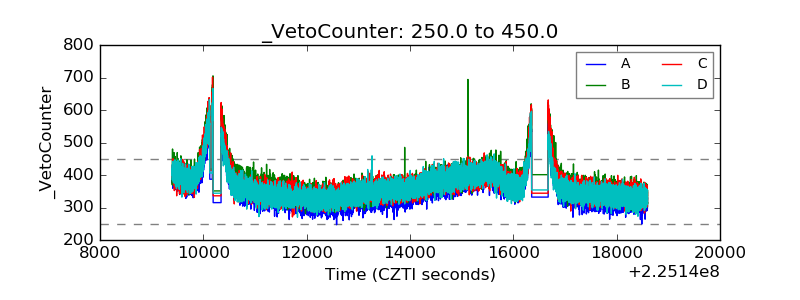 |