| Param | Original file | Final file |
|---|---|---|
| Filename | modeM0/AS1A02_024T01_9000001044cztM0_level2.fits | modeM0/AS1A02_024T01_9000001044cztM0_level2_quad_clean.evt |
| Size (bytes) | 1,208,684,160 | 1,183,720,320 |
| Size | 1.1 GB | 1.1 GB |
| Events in quadrant A | 7,346,246 | 7,105,475 |
| Events in quadrant B | 7,144,382 | 7,175,961 |
| Events in quadrant C | 7,126,626 | 6,632,904 |
| Events in quadrant D | 6,269,736 | 6,223,385 |
| Mode SS | |||
|---|---|---|---|
| Quadrant | BADHDUFLAG | Total packets | Discarded packets |
| A | 0 | 2594 | 0 |
| B | 0 | 2592 | 0 |
| C | 0 | 2590 | 0 |
| D | 0 | 2592 | 0 |
| Mode M0 | |||
|---|---|---|---|
| Quadrant | BADHDUFLAG | Total packets | Discarded packets |
| A | 0 | 289979 | 0 |
| B | 0 | 269527 | 0 |
| C | 0 | 333628 | 0 |
| D | 0 | 329795 | 0 |
| Mode M9 | |||
|---|---|---|---|
| Quadrant | BADHDUFLAG | Total packets | Discarded packets |
| A | 0 | 193 | 0 |
| B | 0 | 193 | 0 |
| C | 0 | 193 | 0 |
| D | 0 | 193 | 0 |
| Quadrant | Total seconds | Saturated seconds | Saturation percentage |
|---|---|---|---|
| A | 127149 | 2674 | 2.103044% |
| B | 127162 | 1870 | 1.470565% |
| C | 127172 | 7368 | 5.793728% |
| D | 127156 | 5333 | 4.194061% |
Noise dominated data is calculated using 1-second bins in cleaned event files. If a bin has >2000 counts, and if more than 50% of those come from <1% of pixels, then it is considered to be noise-dominated and hence unusable.
| Quadrant | # 1 sec bins | Bins with >0 counts | Bins with >2000 counts | High rate bins dominated by noise | Noise dominated (total time) | Noise dominated (detector-on time) | Marked lightcurve |
|---|---|---|---|---|---|---|---|
| A | 175021 | 127210 | 0 | 0 | 0.00% | 0.00% |  |
| B | 175021 | 127219 | 0 | 0 | 0.00% | 0.00% |  |
| C | 175021 | 127207 | 0 | 0 | 0.00% | 0.00% |  |
| D | 175021 | 127185 | 0 | 0 | 0.00% | 0.00% | 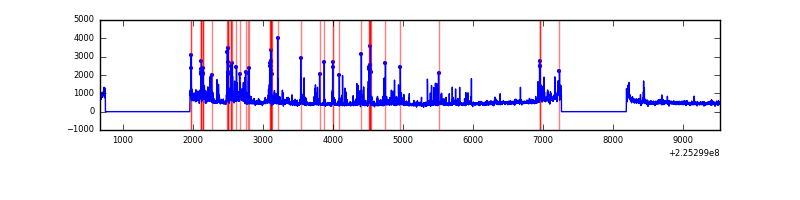 |
Top three noisy pixels from each quadrant. If the there are fewer than three noisy pixels in the level2.evt file, extra rows are filled as -1
| Pixel properties | Quadrant properties | ||||||
|---|---|---|---|---|---|---|---|
| Quadrant | DetID | PixID | Counts | Sigma | Mean | Median | Sigma |
| A | 0 | 29 | 7143 | 11.12 | 1910 | 1782 | 482.0 |
| A | 7 | 110 | 6088 | 8.93 | 1910 | 1782 | 482.0 |
| A | 0 | 30 | 5583 | 7.89 | 1910 | 1782 | 482.0 |
| B | 2 | 9 | 6307 | 12.14 | 1880 | 1786 | 372.5 |
| B | 12 | 226 | 4776 | 8.03 | 1880 | 1786 | 372.5 |
| B | 5 | 232 | 4699 | 7.82 | 1880 | 1786 | 372.5 |
| C | 1 | 80 | 5046 | 6.66 | 1884 | 1744 | 496.0 |
| C | 1 | 81 | 5009 | 6.58 | 1884 | 1744 | 496.0 |
| C | 12 | 241 | 4805 | 6.17 | 1884 | 1744 | 496.0 |
| D | 6 | 231 | 4586 | 6.21 | 1788 | 1625 | 477.1 |
| D | 7 | 5 | 4402 | 5.82 | 1788 | 1625 | 477.1 |
| D | 10 | 189 | 4375 | 5.76 | 1788 | 1625 | 477.1 |
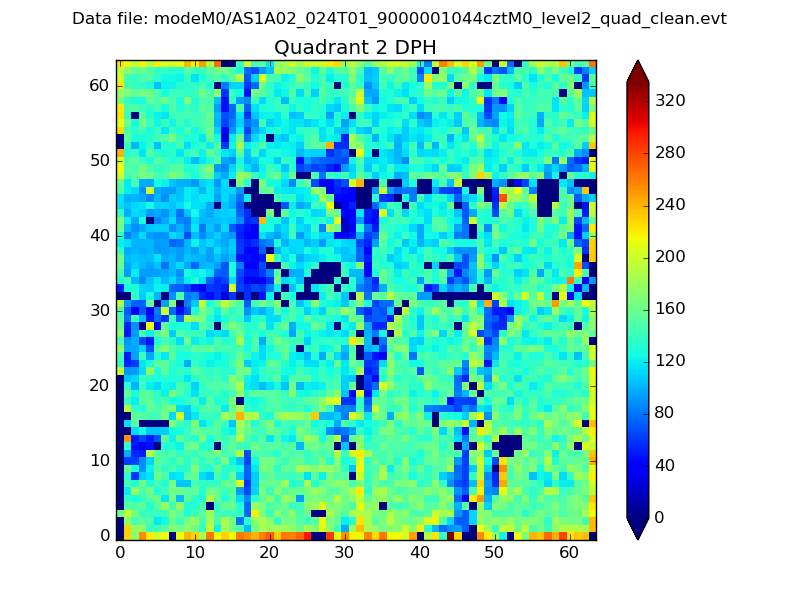
Histogram calculated using DETX and DETY for each event in the final _common_clean file
| Quadrant A |  |
 |
Quadrant B |
|---|---|---|---|
| Quadrant D | 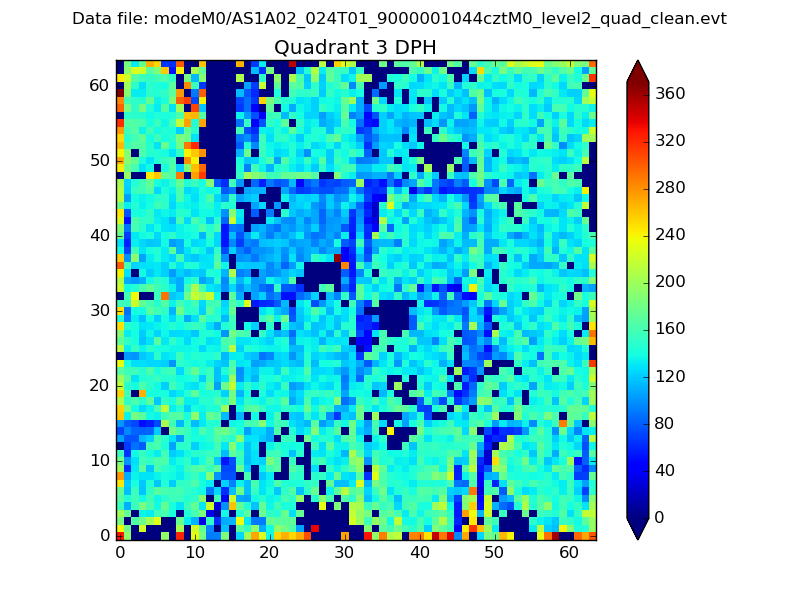 |
 |
Quadrant C |
| Plot type | Count rate plots | Images |
|---|---|---|
| Comparison with Poisson distribution Blue bars denote a histogram of data divided into 1 sec bins. Red curve is a Poisson curve with rate = median count rate of data. |
 |
 |
| Quadrant-wise count rates Data is divided into 100 sec bins |
 |
|
| Module-wise count rates for Quadrant A Data is divided into 100 sec bins |
 |
 |
| Module-wise count rates for Quadrant B Data is divided into 100 sec bins |
 |
 |
| Module-wise count rates for Quadrant C Data is divided into 100 sec bins |
 |
 |
| Module-wise count rates for Quadrant D Data is divided into 100 sec bins |
 |
 |
| Parameter | Plot |
|---|---|
| CZT HV Monitor | 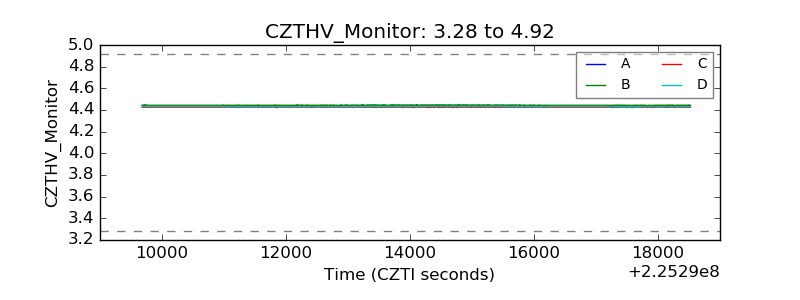 |
| D_VDD |  |
| Temperature 1 |  |
| Veto HV Monitor |  |
| Veto LLD |  |
| Alpha Counter |  |
| _CPM_Rate |  |
| CZT Counter |  |
| +2.5 Volts monitor |  |
| +5 Volts monitor |  |
| _ROLL_ROT |  |
| _Roll_DEC |  |
| _Roll_RA |  |
| Veto Counter |  |