| Param | Original file | Final file |
|---|---|---|
| Filename | modeM0/AS1A02_024T01_9000001044_07567cztM0_level2.evt | modeM0/AS1A02_024T01_9000001044_07567cztM0_level2_quad_clean.evt |
| Size (bytes) | 625,455,360 | 87,644,160 |
| Size | 596.5 MB | 83.6 MB |
| Events in quadrant A | 4,326,276 | 526,020 |
| Events in quadrant B | 3,963,442 | 531,377 |
| Events in quadrant C | 5,100,004 | 520,707 |
| Events in quadrant D | 4,991,138 | 500,626 |
| Mode SS | |||
|---|---|---|---|
| Quadrant | BADHDUFLAG | Total packets | Discarded packets |
| A | 0 | 172 | 0 |
| B | 0 | 172 | 2 |
| C | 0 | 172 | 4 |
| D | 0 | 172 | 2 |
| Mode M0 | |||
|---|---|---|---|
| Quadrant | BADHDUFLAG | Total packets | Discarded packets |
| A | 0 | 18476 | 189 |
| B | 0 | 17389 | 162 |
| C | 0 | 21291 | 128 |
| D | 0 | 20769 | 195 |
| Mode M9 | |||
|---|---|---|---|
| Quadrant | BADHDUFLAG | Total packets | Discarded packets |
| A | 0 | 11 | 0 |
| B | 0 | 11 | 0 |
| C | 0 | 11 | 0 |
| D | 0 | 11 | 0 |
| Quadrant | Total seconds | Saturated seconds | Saturation percentage |
|---|---|---|---|
| A | 8258 | 160 | 1.937515% |
| B | 8271 | 56 | 0.677064% |
| C | 8282 | 52 | 0.627868% |
| D | 8265 | 232 | 2.807018% |
Noise dominated data is calculated using 1-second bins in cleaned event files. If a bin has >2000 counts, and if more than 50% of those come from <1% of pixels, then it is considered to be noise-dominated and hence unusable.
| Quadrant | # 1 sec bins | Bins with >0 counts | Bins with >2000 counts | High rate bins dominated by noise | Noise dominated (total time) | Noise dominated (detector-on time) | Marked lightcurve |
|---|---|---|---|---|---|---|---|
| A | 38045 | 8336 | 92 | 92 | 0.24% | 1.10% | 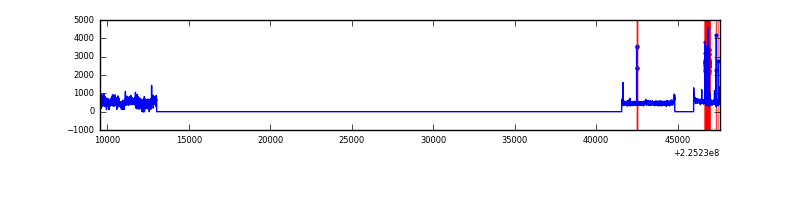 |
| B | 38045 | 8335 | 4 | 4 | 0.01% | 0.05% | 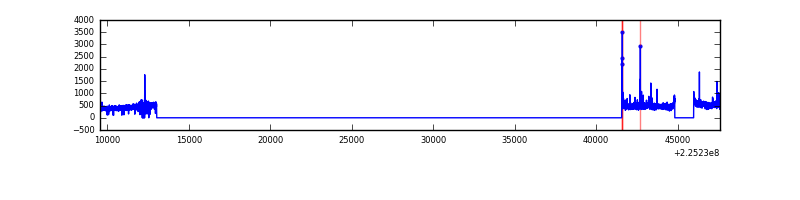 |
| C | 38045 | 8338 | 7 | 7 | 0.02% | 0.08% | 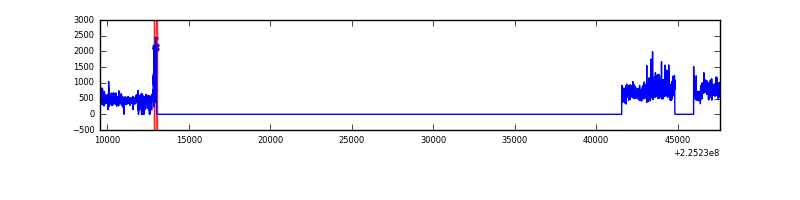 |
| D | 38045 | 8337 | 135 | 135 | 0.35% | 1.62% | 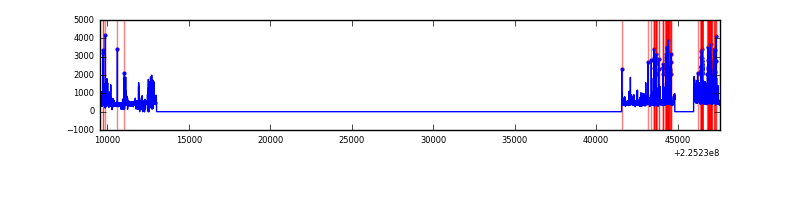 |
Top three noisy pixels from each quadrant. If the there are fewer than three noisy pixels in the level2.evt file, extra rows are filled as -1
| Pixel properties | Quadrant properties | ||||||
|---|---|---|---|---|---|---|---|
| Quadrant | DetID | PixID | Counts | Sigma | Mean | Median | Sigma |
| A | 0 | 128 | 534934 | 2677.22 | 981 | 960 | 199.5 |
| A | 0 | 226 | 9412 | 42.38 | 981 | 960 | 199.5 |
| A | 15 | 239 | 9359 | 42.11 | 981 | 960 | 199.5 |
| B | 11 | 51 | 89054 | 467.12 | 985 | 960 | 188.6 |
| B | 0 | 214 | 35568 | 183.51 | 985 | 960 | 188.6 |
| B | 12 | 111 | 19480 | 98.2 | 985 | 960 | 188.6 |
| C | 9 | 68 | 1366051 | 6210.07 | 953 | 959 | 219.8 |
| C | 1 | 16 | 9306 | 37.97 | 953 | 959 | 219.8 |
| C | 13 | 61 | 7481 | 29.67 | 953 | 959 | 219.8 |
| D | 2 | 244 | 483829 | 2063.26 | 955 | 927 | 234.0 |
| D | 2 | 152 | 469391 | 2001.58 | 955 | 927 | 234.0 |
| D | 2 | 14 | 322278 | 1373.02 | 955 | 927 | 234.0 |
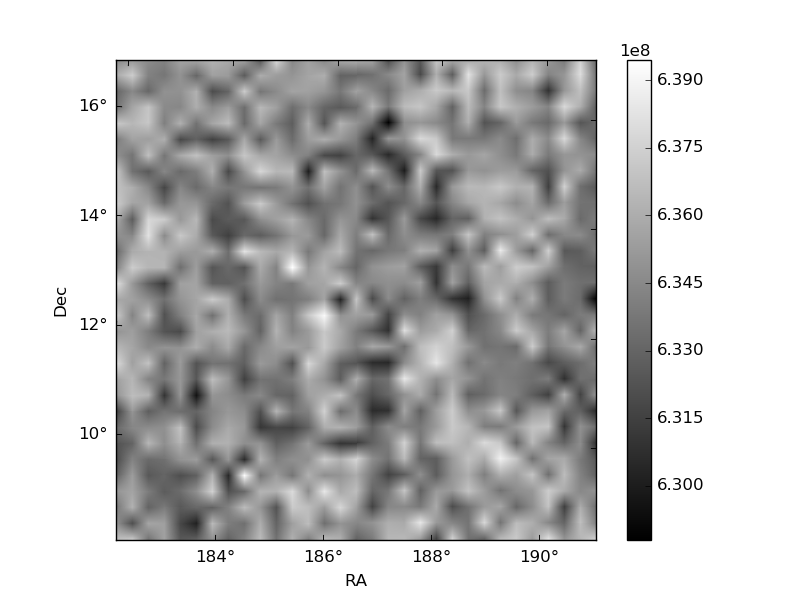
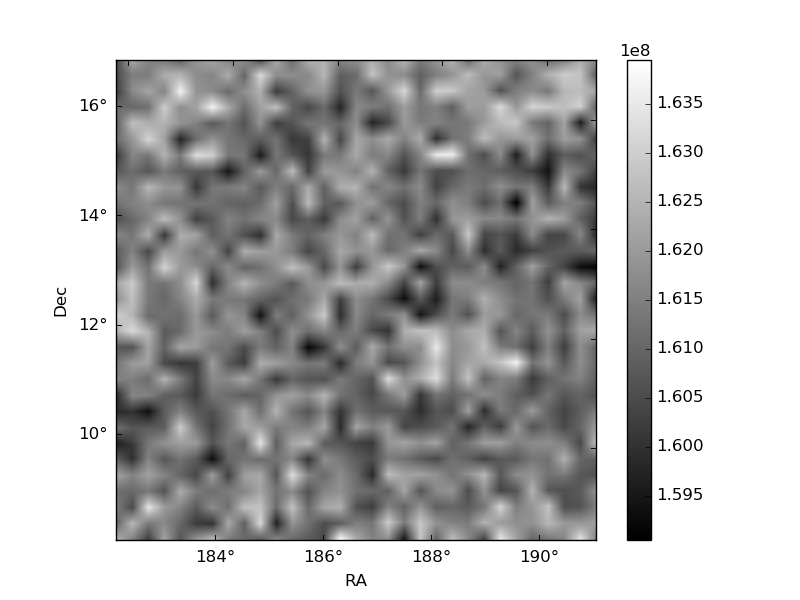
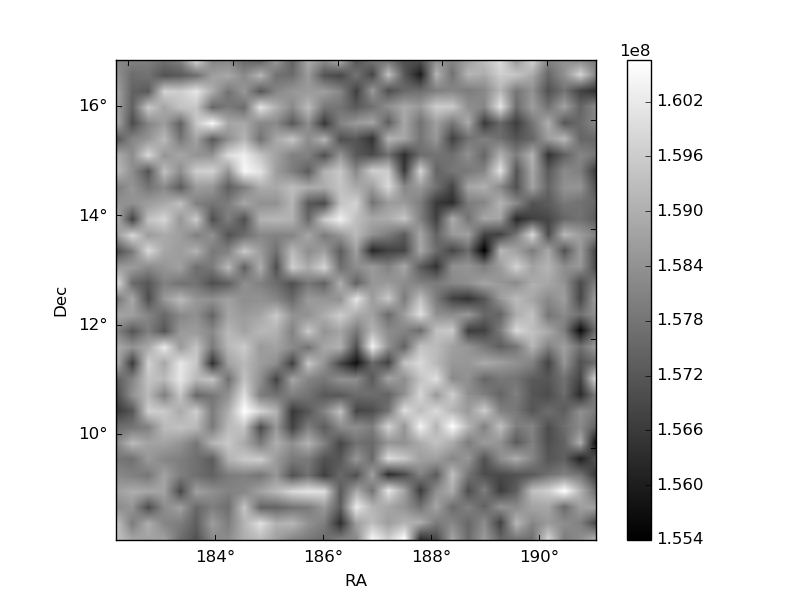
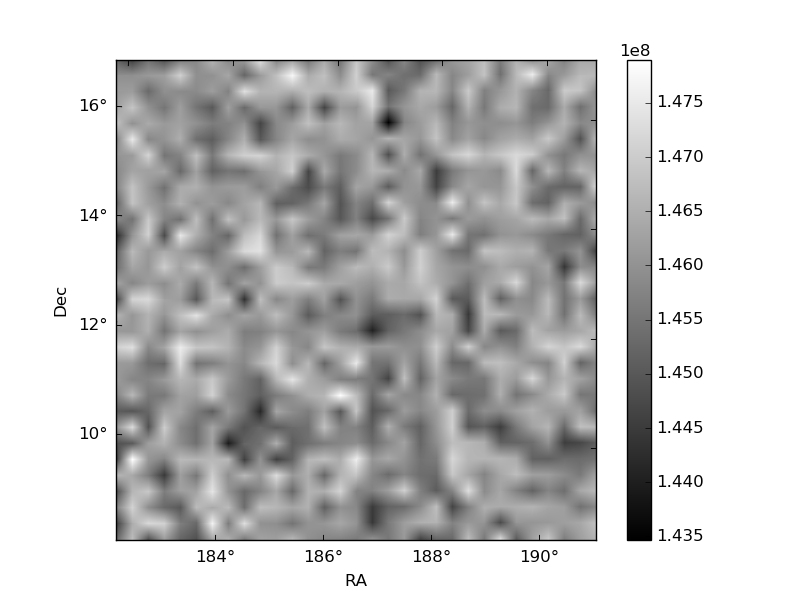
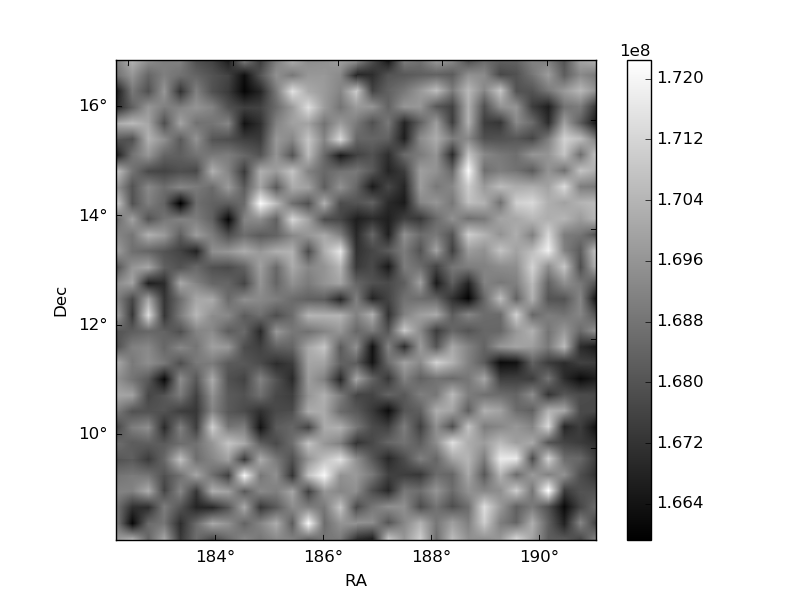
Histogram calculated using DETX and DETY for each event in the final _common_clean file
| Quadrant A | 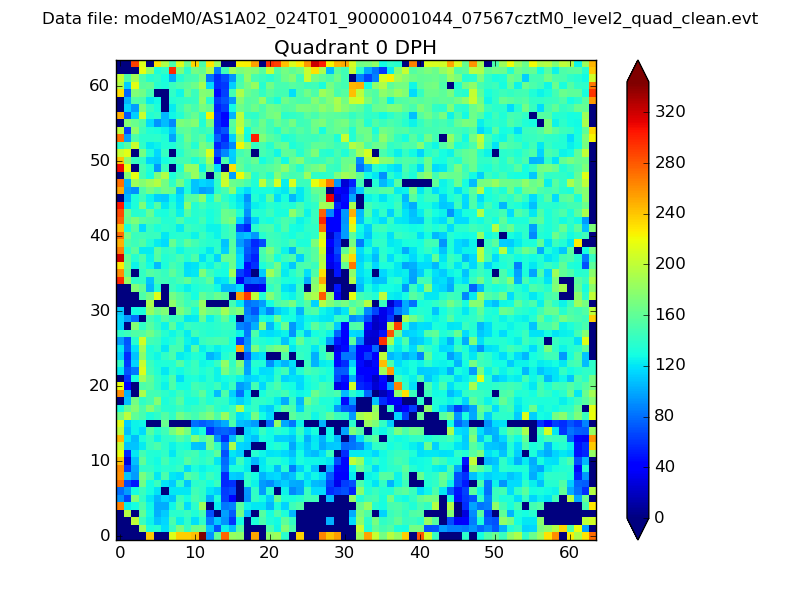 |
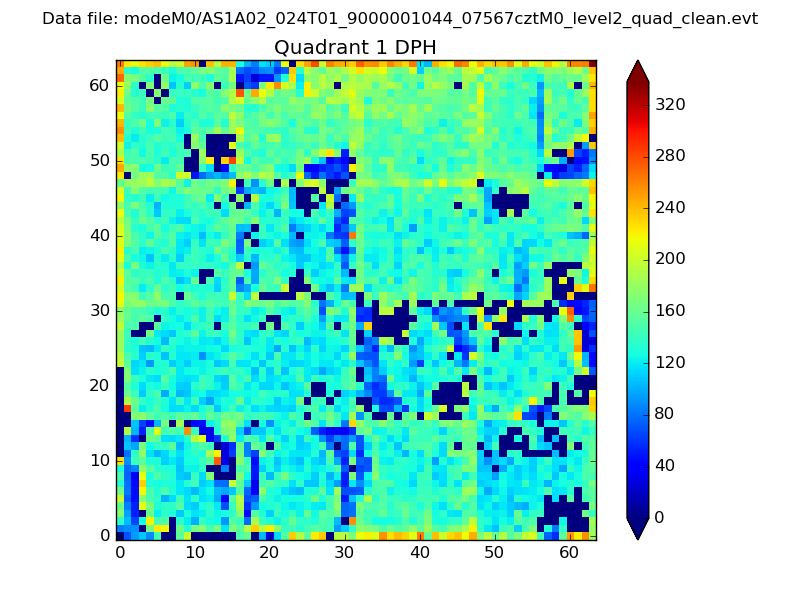 |
Quadrant B |
|---|---|---|---|
| Quadrant D |  |
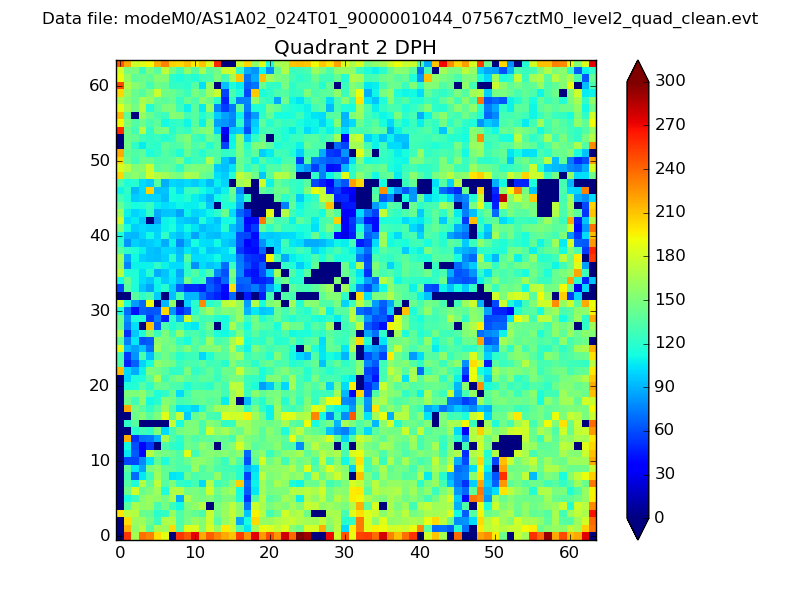 |
Quadrant C |
| Plot type | Count rate plots | Images |
|---|---|---|
| Comparison with Poisson distribution Blue bars denote a histogram of data divided into 1 sec bins. Red curve is a Poisson curve with rate = median count rate of data. |
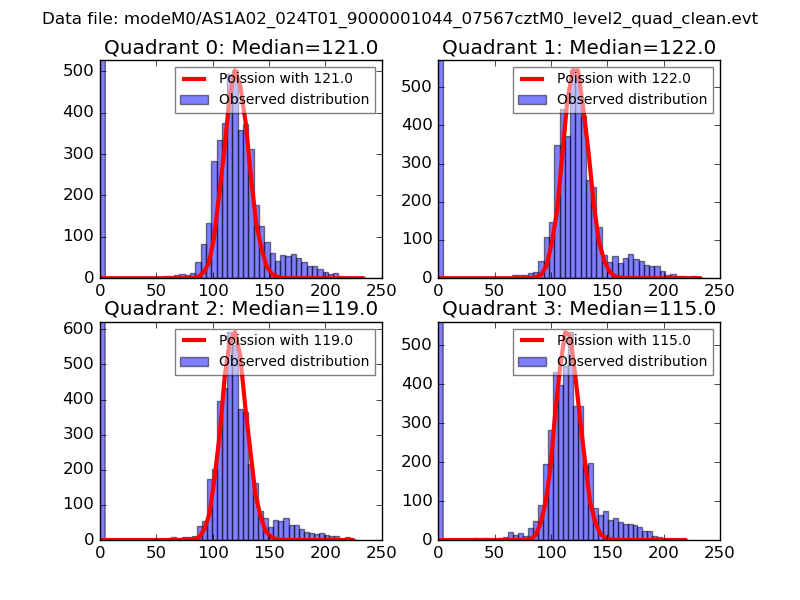 |
 |
| Quadrant-wise count rates Data is divided into 100 sec bins |
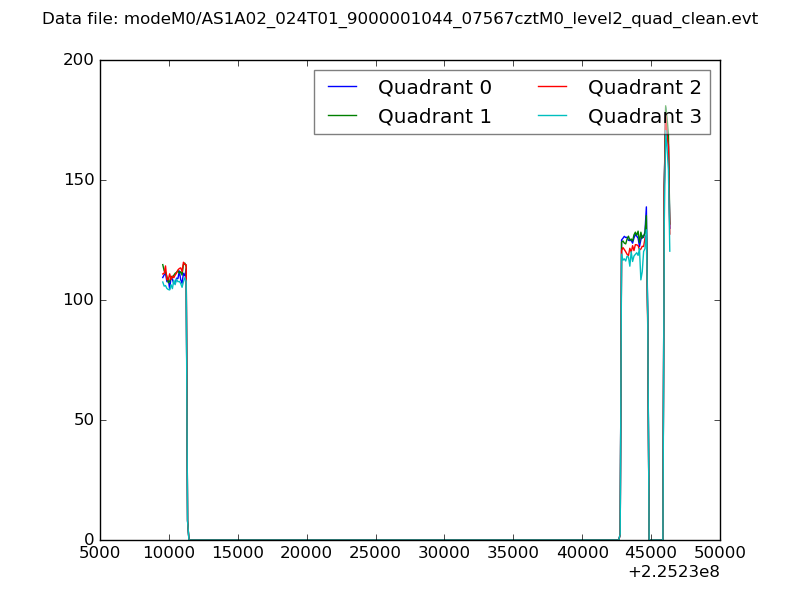 |
|
| Module-wise count rates for Quadrant A Data is divided into 100 sec bins |
 |
 |
| Module-wise count rates for Quadrant B Data is divided into 100 sec bins |
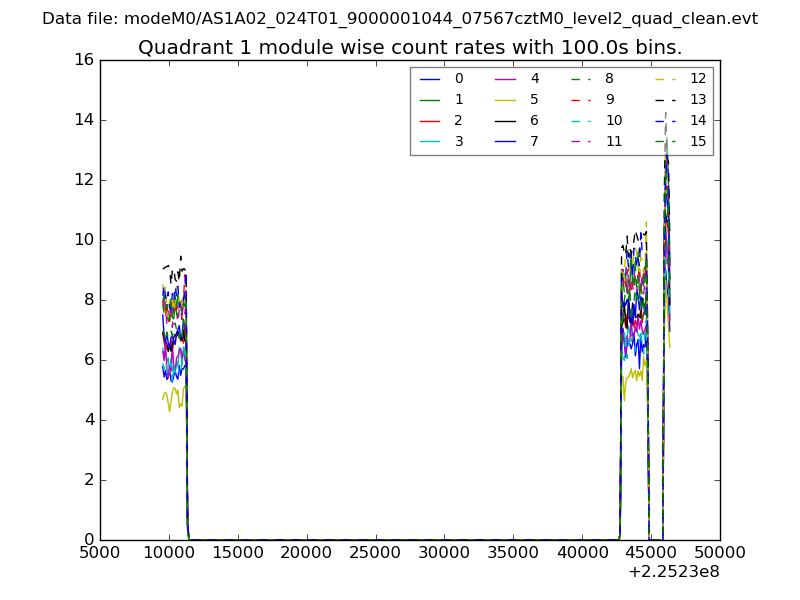 |
 |
| Module-wise count rates for Quadrant C Data is divided into 100 sec bins |
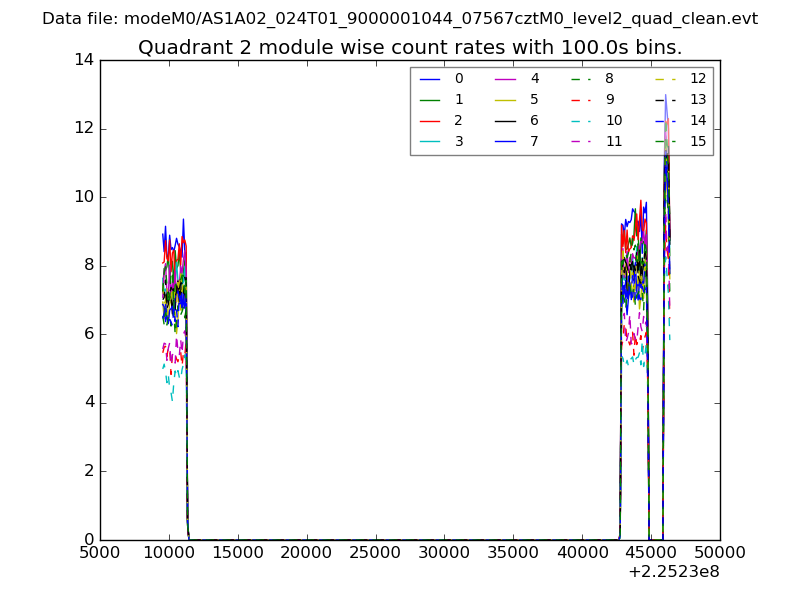 |
 |
| Module-wise count rates for Quadrant D Data is divided into 100 sec bins |
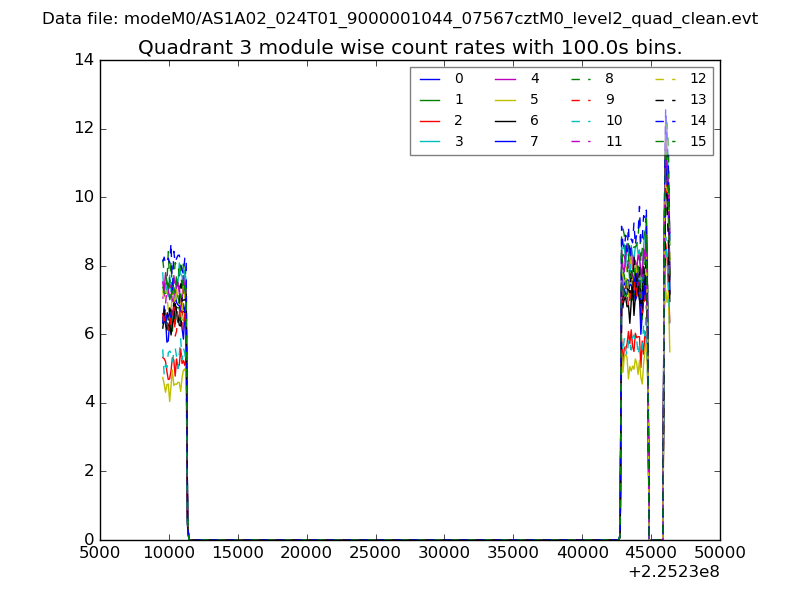 |
 |
| Parameter | Plot |
|---|---|
| CZT HV Monitor | 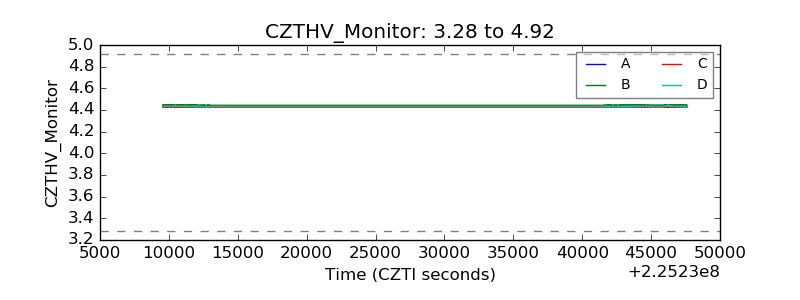 |
| D_VDD | 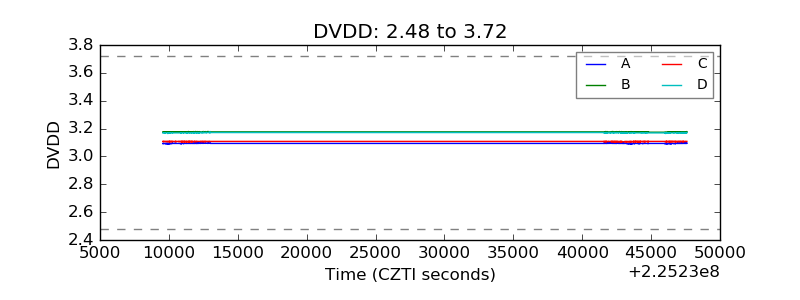 |
| Temperature 1 | 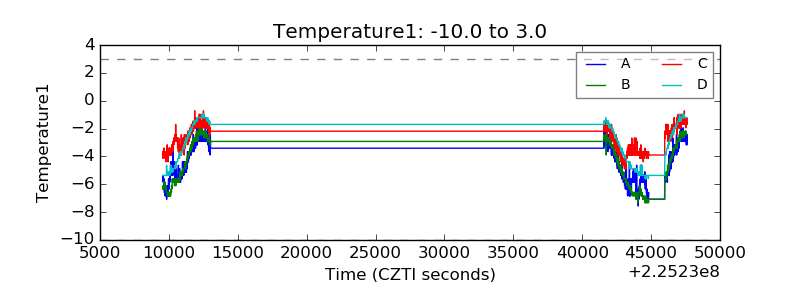 |
| Veto HV Monitor | 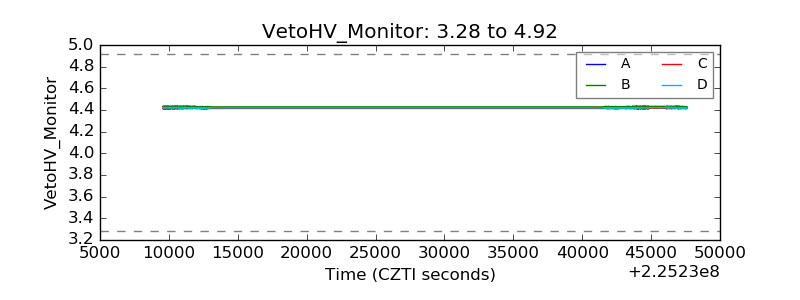 |
| Veto LLD | 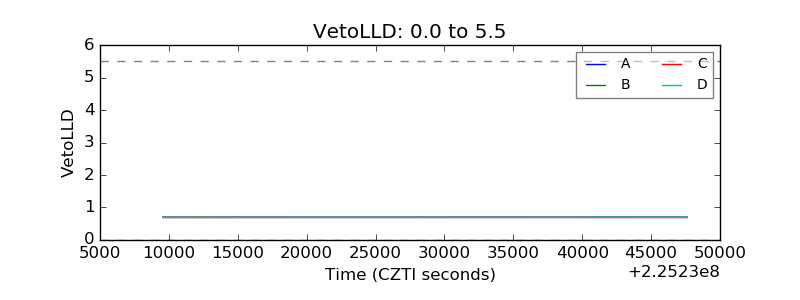 |
| Alpha Counter | 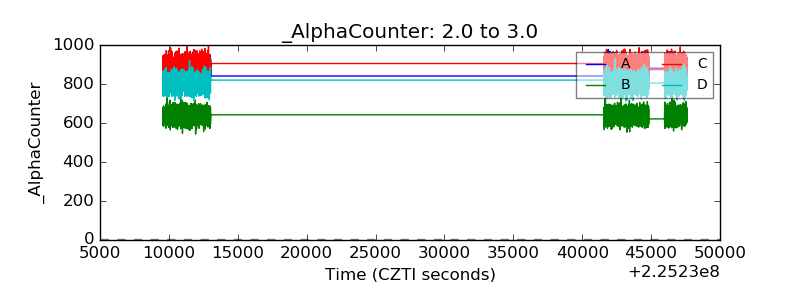 |
| _CPM_Rate |  |
| CZT Counter | 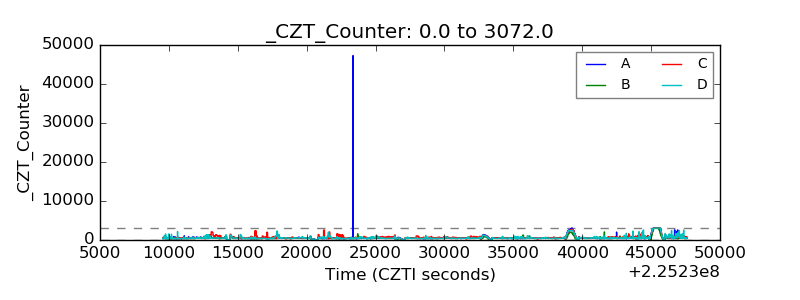 |
| +2.5 Volts monitor | 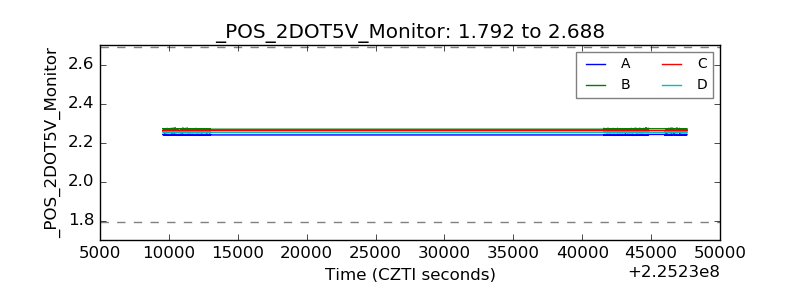 |
| +5 Volts monitor |  |
| _ROLL_ROT |  |
| _Roll_DEC | 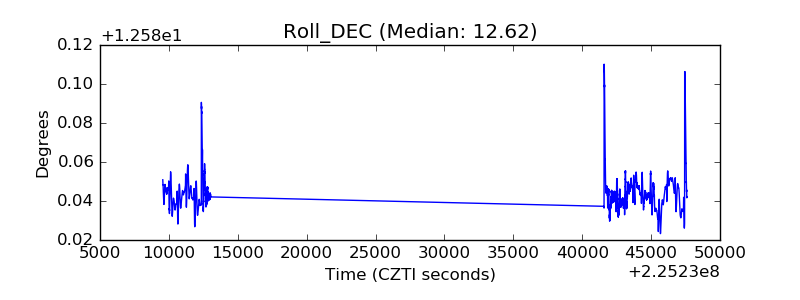 |
| _Roll_RA | 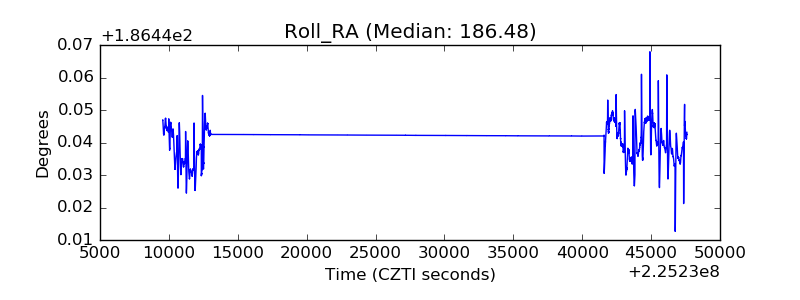 |
| Veto Counter |  |