| Param | Original file | Final file |
|---|---|---|
| Filename | modeM0/AS1A02_024T01_9000001044_07570cztM0_level2.evt | modeM0/AS1A02_024T01_9000001044_07570cztM0_level2_quad_clean.evt |
| Size (bytes) | 371,180,160 | 65,039,040 |
| Size | 354.0 MB | 62.0 MB |
| Events in quadrant A | 2,503,521 | 404,361 |
| Events in quadrant B | 2,687,866 | 409,425 |
| Events in quadrant C | 2,516,800 | 408,428 |
| Events in quadrant D | 3,189,781 | 393,600 |
| Mode SS | |||
|---|---|---|---|
| Quadrant | BADHDUFLAG | Total packets | Discarded packets |
| A | 0 | 104 | 0 |
| B | 0 | 104 | 0 |
| C | 0 | 104 | 0 |
| D | 0 | 104 | 0 |
| Mode M0 | |||
|---|---|---|---|
| Quadrant | BADHDUFLAG | Total packets | Discarded packets |
| A | 0 | 10620 | 4 |
| B | 0 | 11176 | 1 |
| C | 0 | 10599 | 3 |
| D | 0 | 12846 | 21 |
| Mode M9 | |||
|---|---|---|---|
| Quadrant | BADHDUFLAG | Total packets | Discarded packets |
| A | 0 | 13 | 0 |
| B | 0 | 13 | 0 |
| C | 0 | 13 | 0 |
| D | 0 | 13 | 0 |
| Quadrant | Total seconds | Saturated seconds | Saturation percentage |
|---|---|---|---|
| A | 5038 | 94 | 1.865820% |
| B | 5040 | 113 | 2.242063% |
| C | 5038 | 69 | 1.369591% |
| D | 5038 | 181 | 3.592696% |
Noise dominated data is calculated using 1-second bins in cleaned event files. If a bin has >2000 counts, and if more than 50% of those come from <1% of pixels, then it is considered to be noise-dominated and hence unusable.
| Quadrant | # 1 sec bins | Bins with >0 counts | Bins with >2000 counts | High rate bins dominated by noise | Noise dominated (total time) | Noise dominated (detector-on time) | Marked lightcurve |
|---|---|---|---|---|---|---|---|
| A | 6333 | 5040 | 0 | 0 | 0.00% | 0.00% | 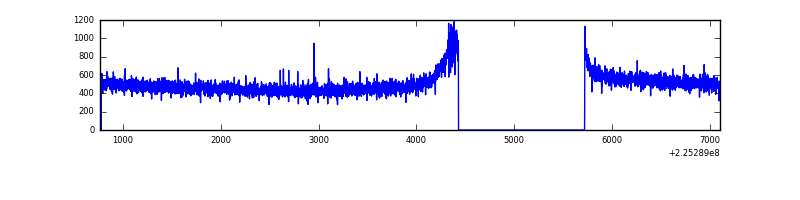 |
| B | 6337 | 5043 | 4 | 4 | 0.06% | 0.08% | 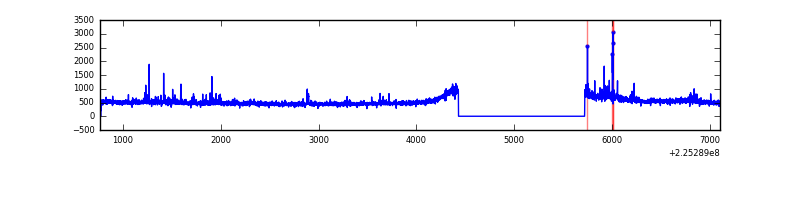 |
| C | 6337 | 5043 | 1 | 1 | 0.02% | 0.02% | 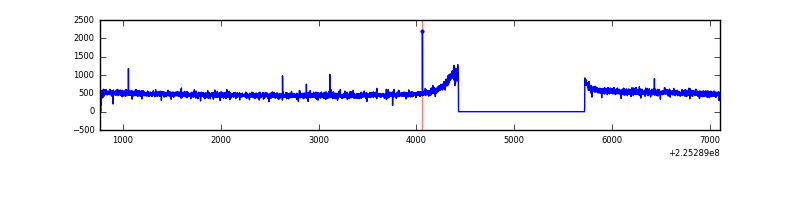 |
| D | 6333 | 5041 | 74 | 74 | 1.17% | 1.47% | 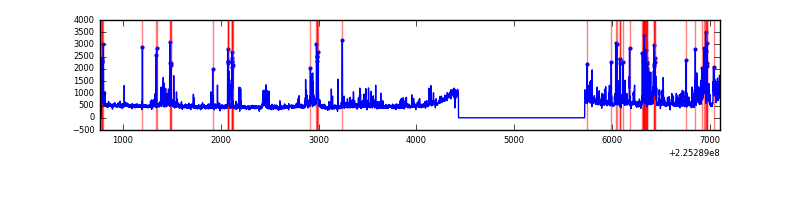 |
Top three noisy pixels from each quadrant. If the there are fewer than three noisy pixels in the level2.evt file, extra rows are filled as -1
| Pixel properties | Quadrant properties | ||||||
|---|---|---|---|---|---|---|---|
| Quadrant | DetID | PixID | Counts | Sigma | Mean | Median | Sigma |
| A | 0 | 226 | 6187 | 42.17 | 649 | 634 | 131.7 |
| A | 12 | 194 | 5673 | 38.27 | 649 | 634 | 131.7 |
| A | 3 | 1 | 4767 | 31.39 | 649 | 634 | 131.7 |
| B | 11 | 51 | 64509 | 518.87 | 652 | 639 | 123.1 |
| B | 0 | 214 | 47692 | 382.25 | 652 | 639 | 123.1 |
| B | 0 | 168 | 27784 | 220.52 | 652 | 639 | 123.1 |
| C | 9 | 68 | 27221 | 177.0 | 638 | 642 | 150.2 |
| C | 13 | 61 | 4897 | 28.34 | 638 | 642 | 150.2 |
| C | 3 | 202 | 1595 | 6.35 | 638 | 642 | 150.2 |
| D | 2 | 152 | 564667 | 3603.86 | 633 | 614 | 156.5 |
| D | 5 | 233 | 153952 | 979.71 | 633 | 614 | 156.5 |
| D | 2 | 14 | 59429 | 375.78 | 633 | 614 | 156.5 |
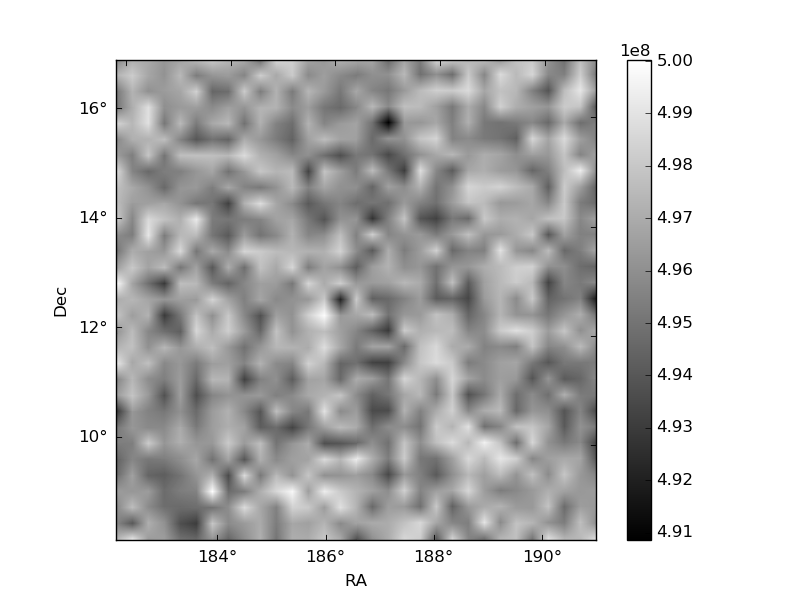
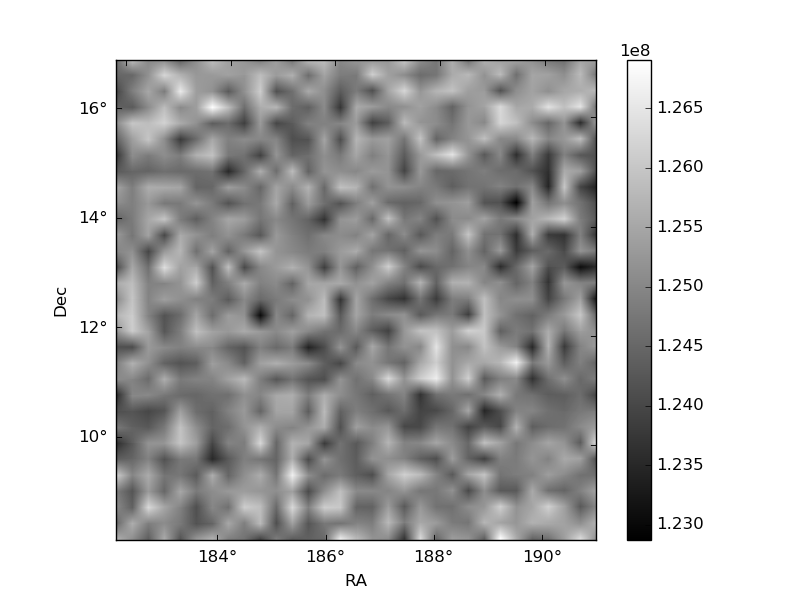
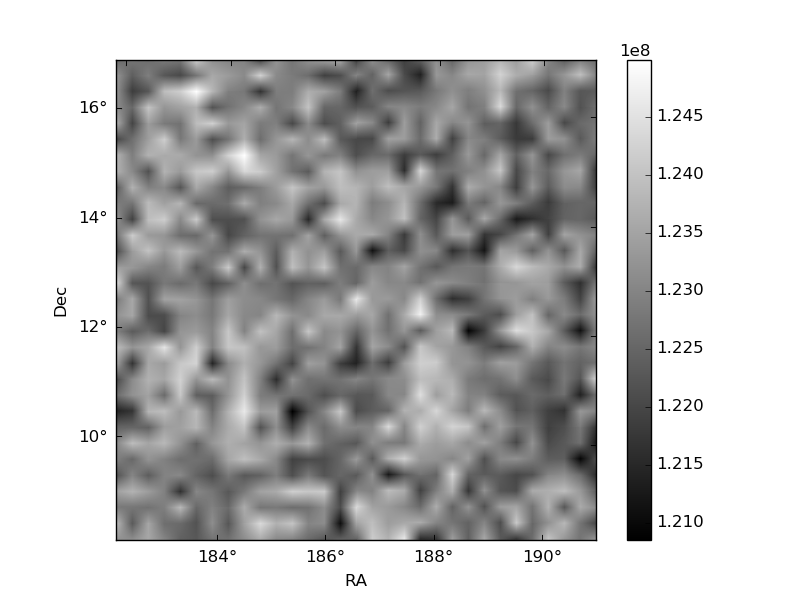
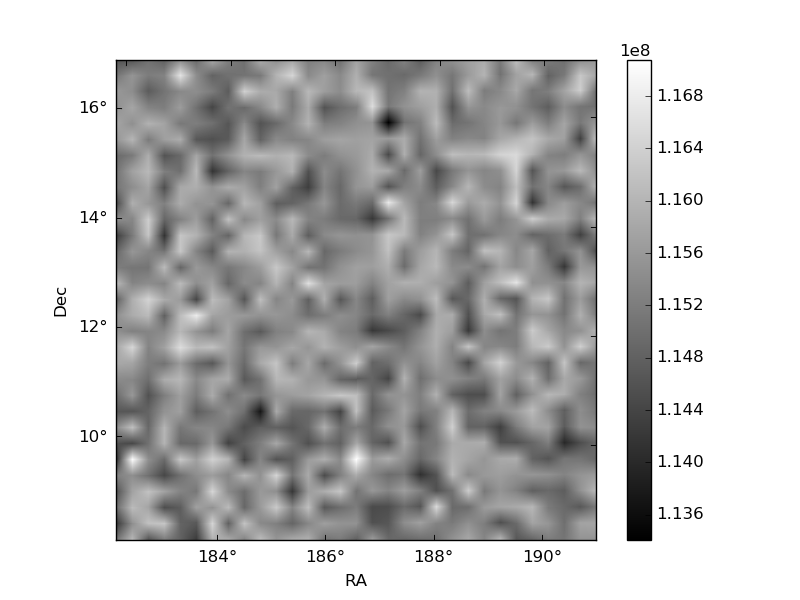
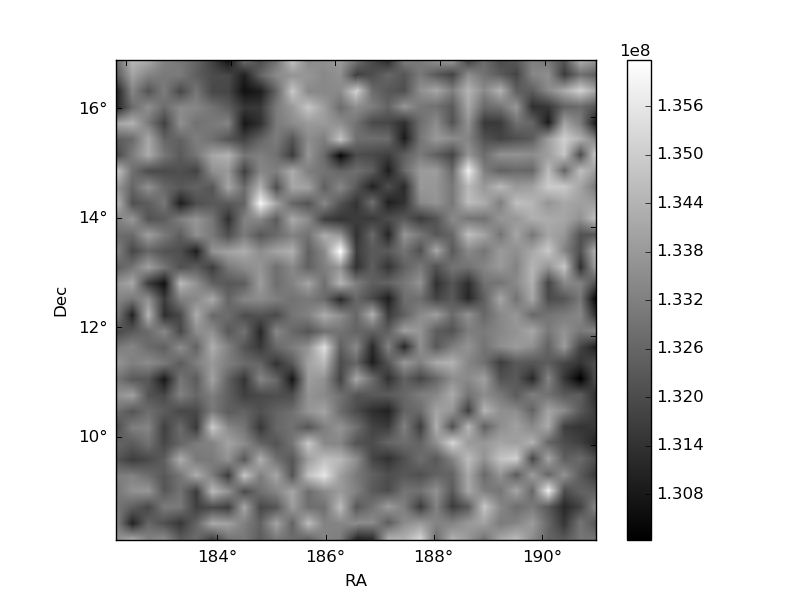
Histogram calculated using DETX and DETY for each event in the final _common_clean file
| Quadrant A | 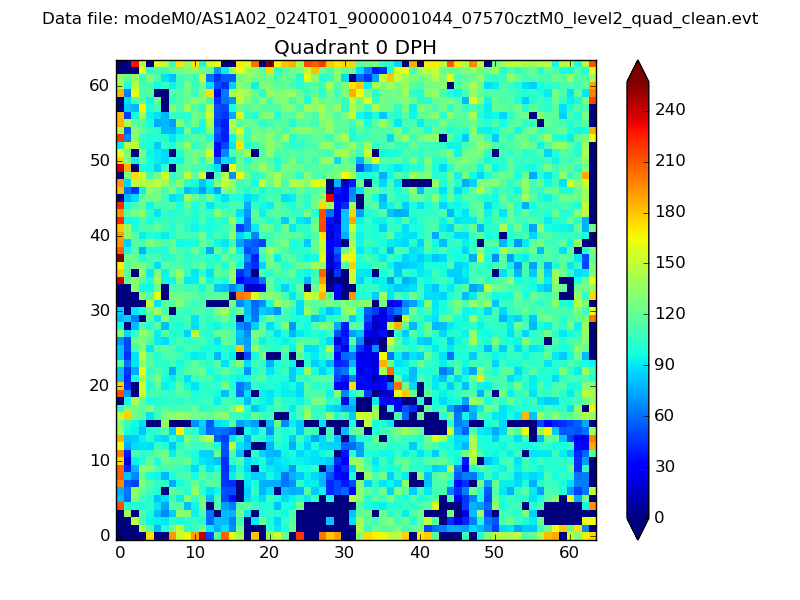 |
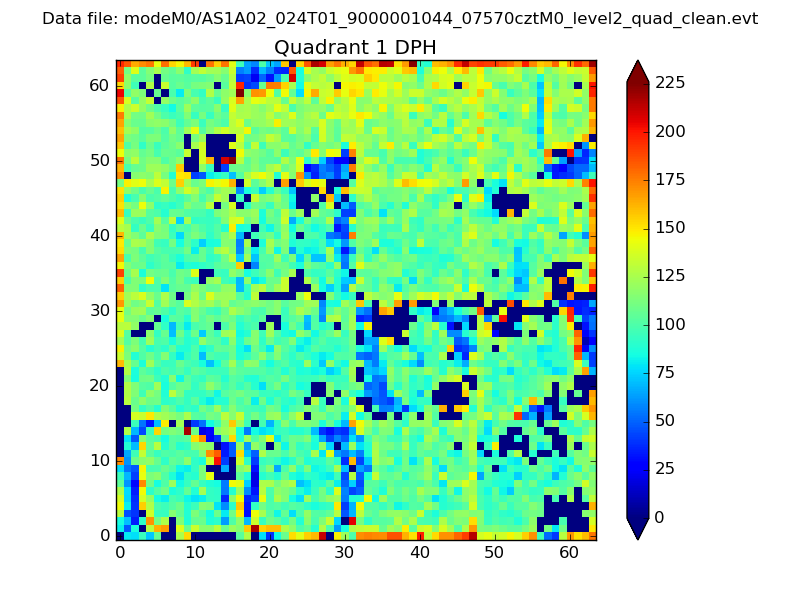 |
Quadrant B |
|---|---|---|---|
| Quadrant D | 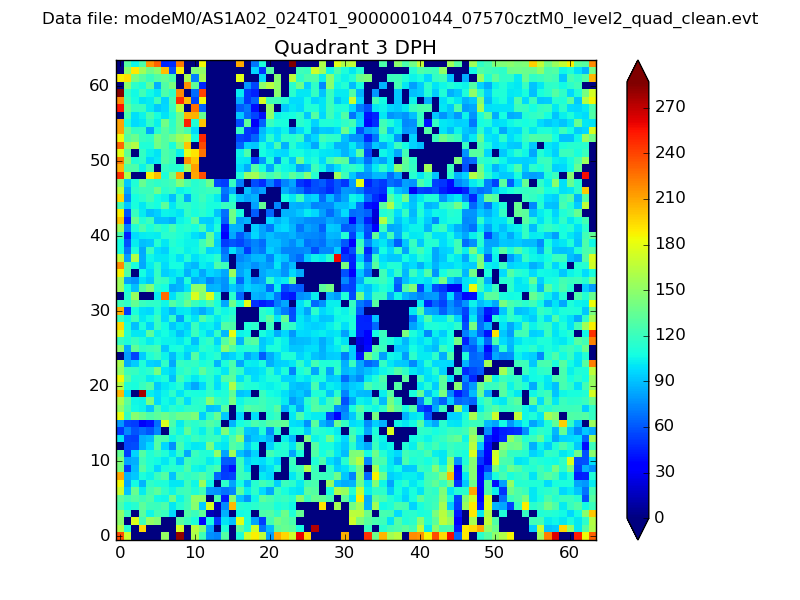 |
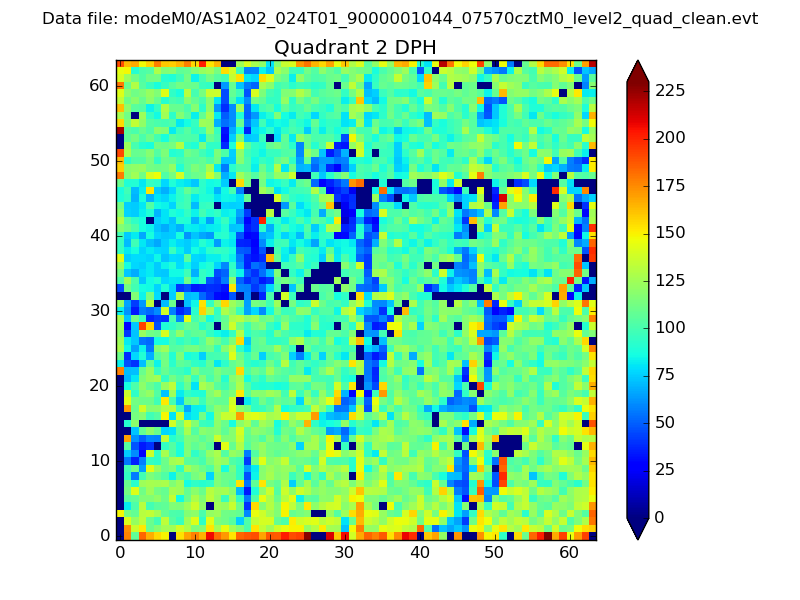 |
Quadrant C |
| Plot type | Count rate plots | Images |
|---|---|---|
| Comparison with Poisson distribution Blue bars denote a histogram of data divided into 1 sec bins. Red curve is a Poisson curve with rate = median count rate of data. |
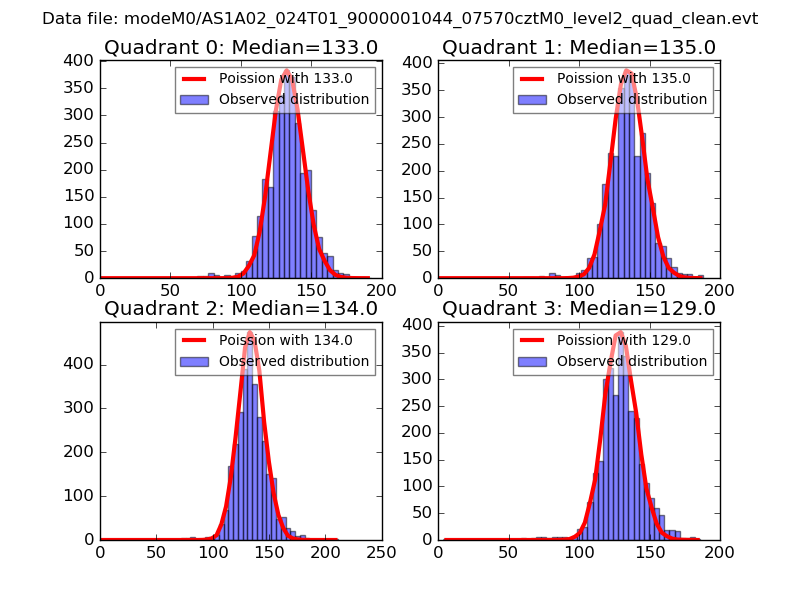 |
 |
| Quadrant-wise count rates Data is divided into 100 sec bins |
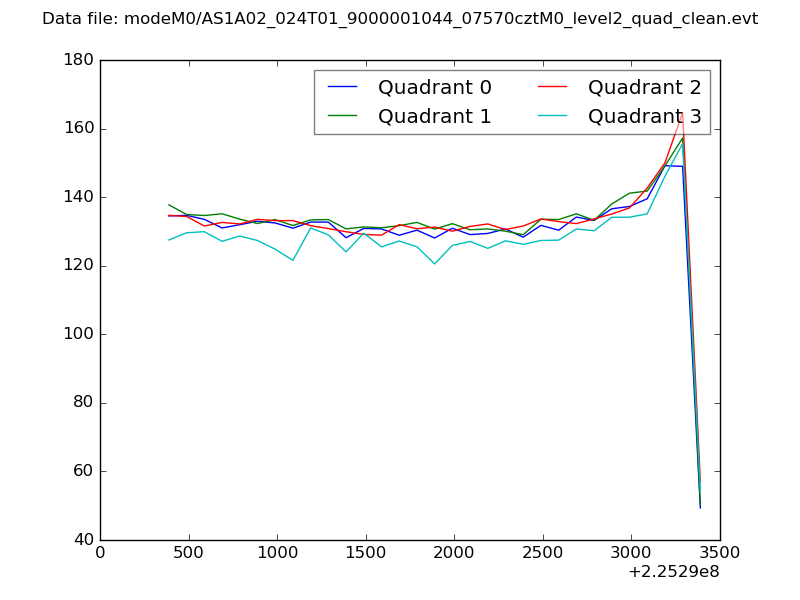 |
|
| Module-wise count rates for Quadrant A Data is divided into 100 sec bins |
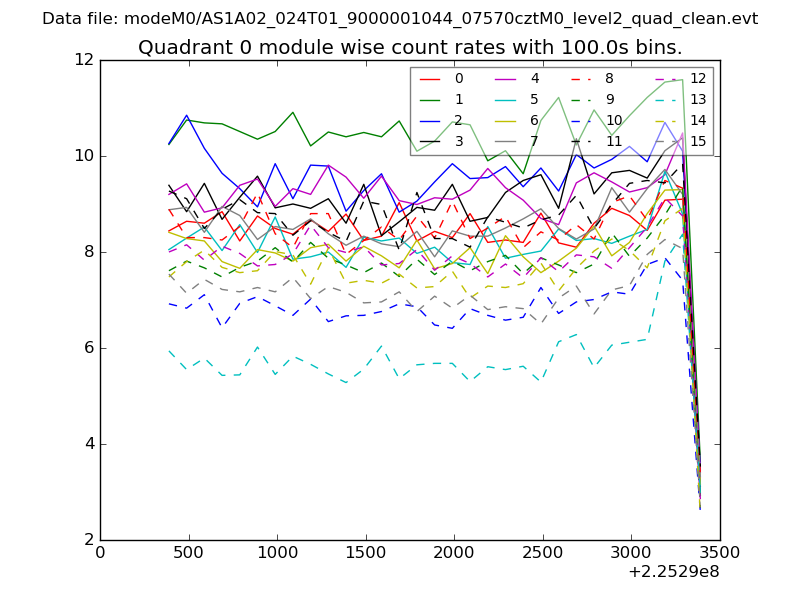 |
 |
| Module-wise count rates for Quadrant B Data is divided into 100 sec bins |
 |
 |
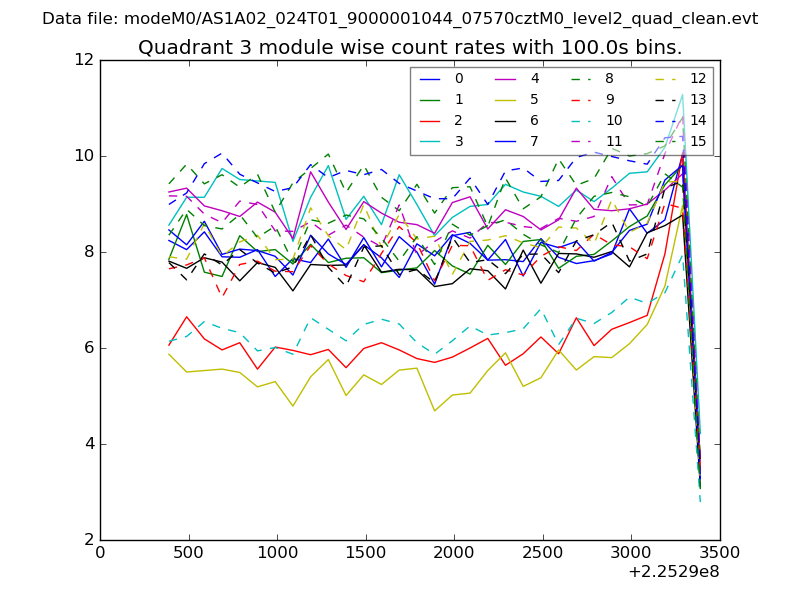
| Module-wise count rates for Quadrant C Data is divided into 100 sec bins |
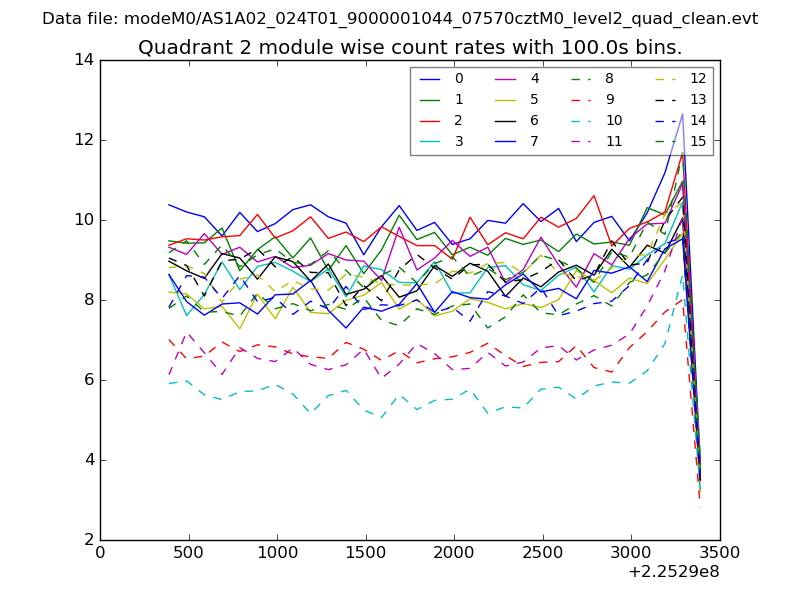 |
 |
| Module-wise count rates for Quadrant D Data is divided into 100 sec bins |
 |
 |
| Parameter | Plot |
|---|---|
| CZT HV Monitor |  |
| D_VDD | 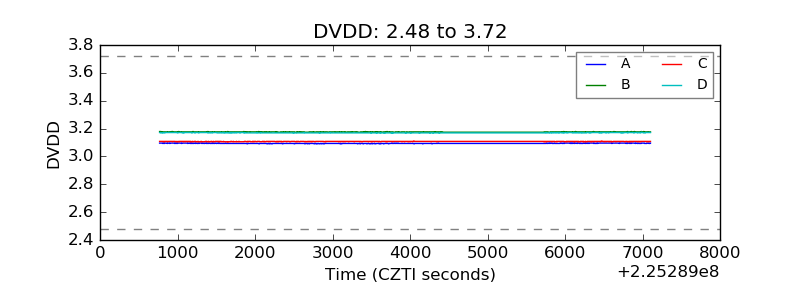 |
| Temperature 1 | 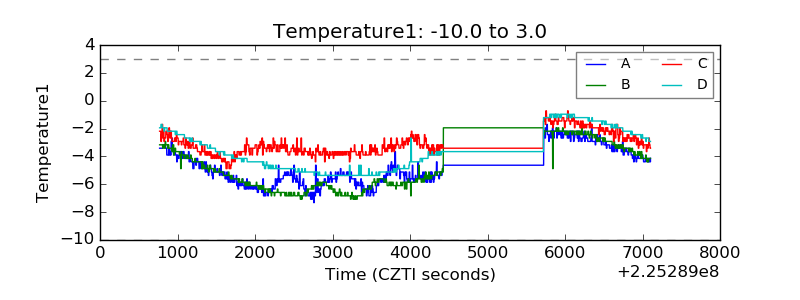 |
| Veto HV Monitor | 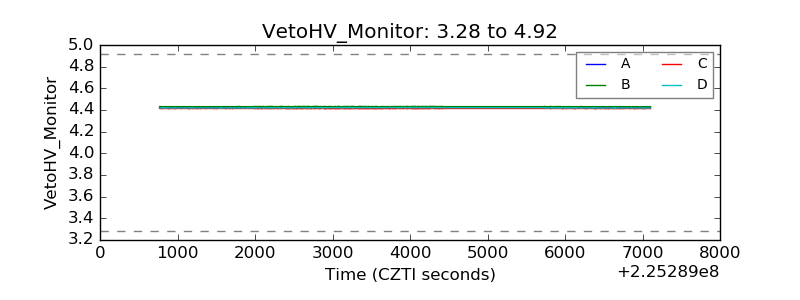 |
| Veto LLD | 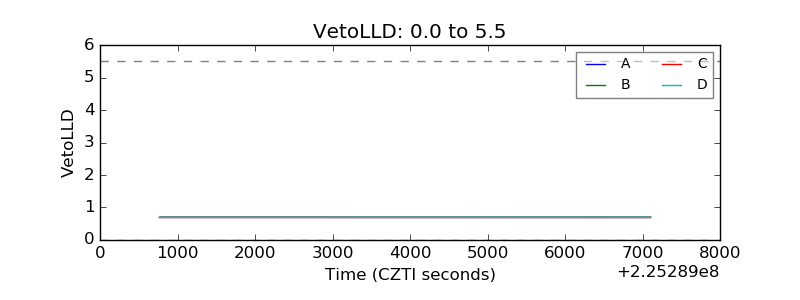 |
| Alpha Counter | 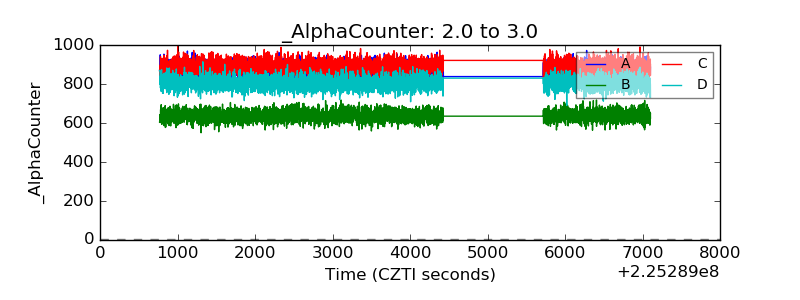 |
| _CPM_Rate | 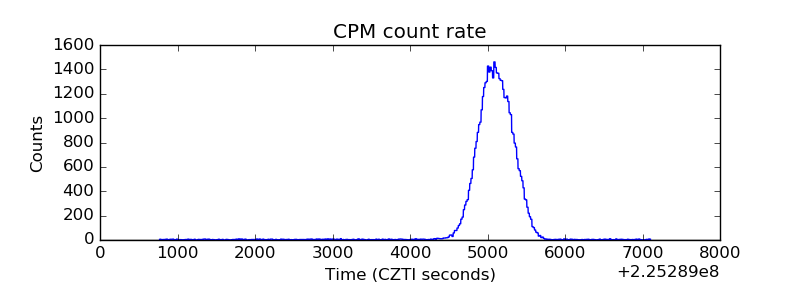 |
| CZT Counter | 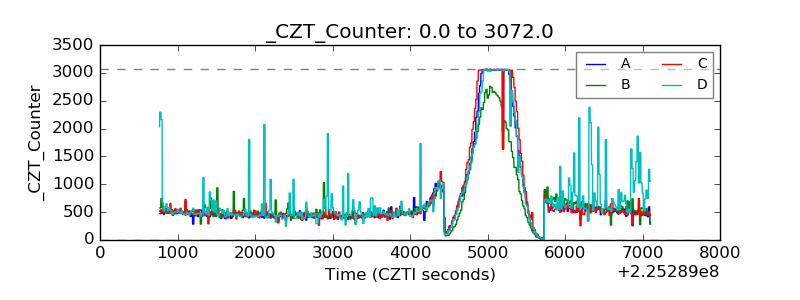 |
| +2.5 Volts monitor |  |
| +5 Volts monitor |  |
| _ROLL_ROT |  |
| _Roll_DEC | 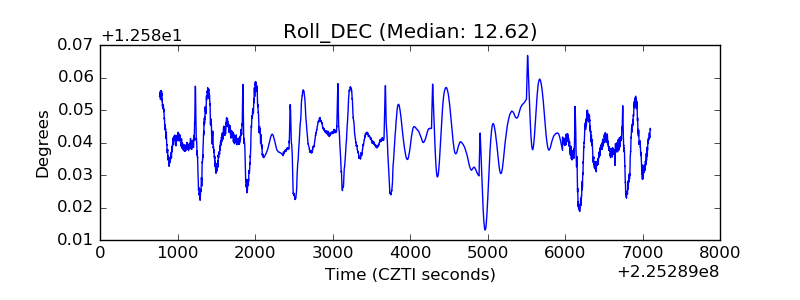 |
| _Roll_RA | 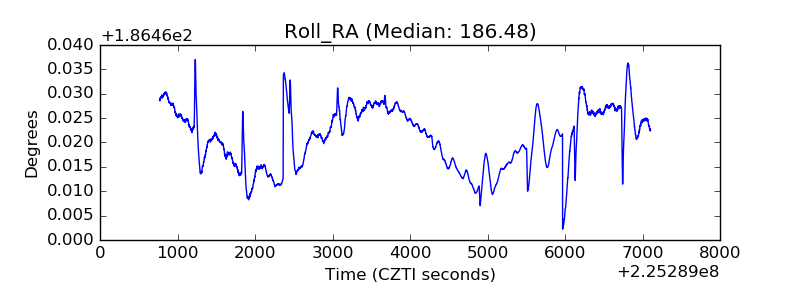 |
| Veto Counter |  |