| Param | Original file | Final file |
|---|---|---|
| Filename | modeM0/AS1A02_024T01_9000001044_07571cztM0_level2.evt | modeM0/AS1A02_024T01_9000001044_07571cztM0_level2_quad_clean.evt |
| Size (bytes) | 519,255,360 | 81,910,080 |
| Size | 495.2 MB | 78.1 MB |
| Events in quadrant A | 3,456,046 | 499,204 |
| Events in quadrant B | 3,669,049 | 506,615 |
| Events in quadrant C | 3,580,154 | 502,917 |
| Events in quadrant D | 4,544,010 | 482,527 |
| Mode SS | |||
|---|---|---|---|
| Quadrant | BADHDUFLAG | Total packets | Discarded packets |
| A | 0 | 142 | 0 |
| B | 0 | 142 | 0 |
| C | 0 | 142 | 0 |
| D | 0 | 142 | 0 |
| Mode M0 | |||
|---|---|---|---|
| Quadrant | BADHDUFLAG | Total packets | Discarded packets |
| A | 0 | 14746 | 3 |
| B | 0 | 15391 | 2 |
| C | 0 | 15087 | 2 |
| D | 0 | 18314 | 2 |
| Mode M9 | |||
|---|---|---|---|
| Quadrant | BADHDUFLAG | Total packets | Discarded packets |
| A | 0 | 19 | 0 |
| B | 0 | 19 | 0 |
| C | 0 | 19 | 0 |
| D | 0 | 20 | 0 |
| Quadrant | Total seconds | Saturated seconds | Saturation percentage |
|---|---|---|---|
| A | 7024 | 73 | 1.039294% |
| B | 7024 | 100 | 1.423690% |
| C | 7024 | 77 | 1.096241% |
| D | 7024 | 196 | 2.790433% |
Noise dominated data is calculated using 1-second bins in cleaned event files. If a bin has >2000 counts, and if more than 50% of those come from <1% of pixels, then it is considered to be noise-dominated and hence unusable.
| Quadrant | # 1 sec bins | Bins with >0 counts | Bins with >2000 counts | High rate bins dominated by noise | Noise dominated (total time) | Noise dominated (detector-on time) | Marked lightcurve |
|---|---|---|---|---|---|---|---|
| A | 12415 | 7026 | 0 | 0 | 0.00% | 0.00% |  |
| B | 12415 | 7026 | 5 | 5 | 0.04% | 0.07% |  |
| C | 12415 | 7026 | 25 | 25 | 0.20% | 0.36% |  |
| D | 12415 | 7026 | 98 | 98 | 0.79% | 1.39% | 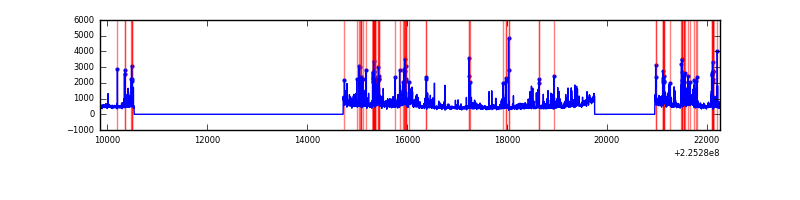 |
Top three noisy pixels from each quadrant. If the there are fewer than three noisy pixels in the level2.evt file, extra rows are filled as -1
| Pixel properties | Quadrant properties | ||||||
|---|---|---|---|---|---|---|---|
| Quadrant | DetID | PixID | Counts | Sigma | Mean | Median | Sigma |
| A | 0 | 226 | 8428 | 41.55 | 896 | 878 | 181.7 |
| A | 12 | 194 | 7868 | 38.46 | 896 | 878 | 181.7 |
| A | 3 | 1 | 7511 | 36.5 | 896 | 878 | 181.7 |
| B | 0 | 214 | 77995 | 454.14 | 898 | 878 | 169.8 |
| B | 11 | 51 | 40615 | 234.01 | 898 | 878 | 169.8 |
| B | 0 | 168 | 28208 | 160.95 | 898 | 878 | 169.8 |
| C | 8 | 229 | 107950 | 525.77 | 876 | 884 | 203.6 |
| C | 9 | 68 | 51079 | 246.49 | 876 | 884 | 203.6 |
| C | 13 | 61 | 6730 | 28.71 | 876 | 884 | 203.6 |
| D | 2 | 152 | 865397 | 4021.43 | 872 | 846 | 215.0 |
| D | 5 | 233 | 167741 | 776.31 | 872 | 846 | 215.0 |
| D | 12 | 233 | 75151 | 345.63 | 872 | 846 | 215.0 |
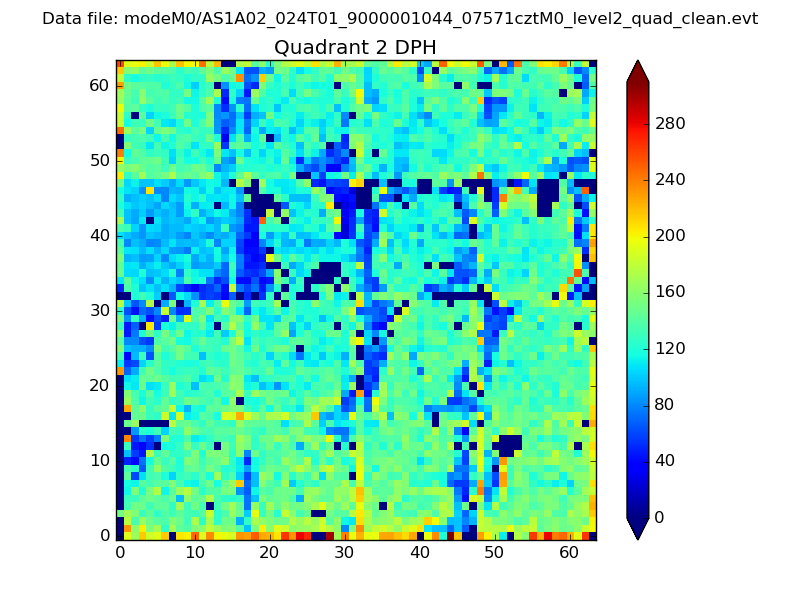
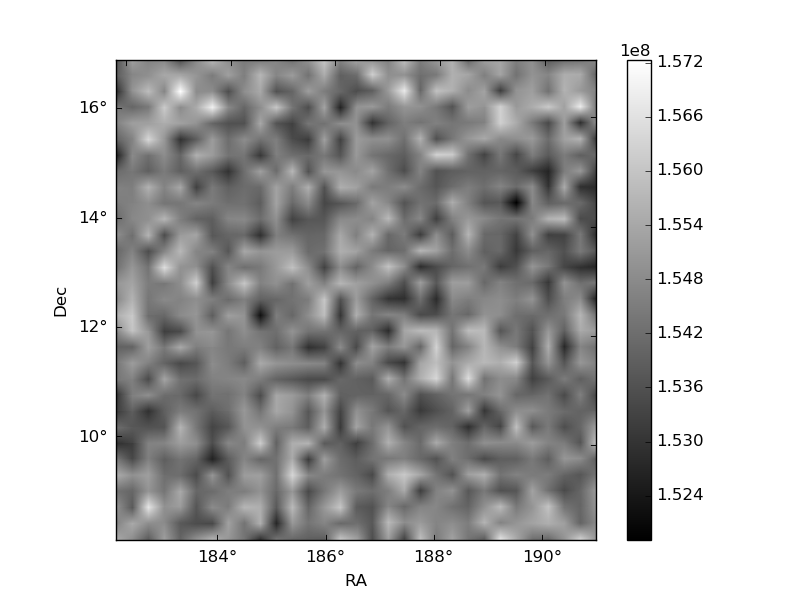
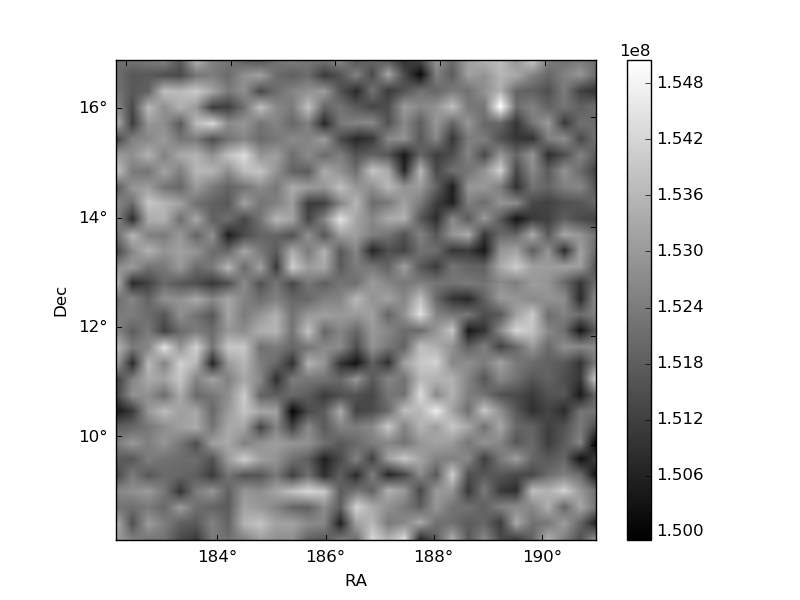
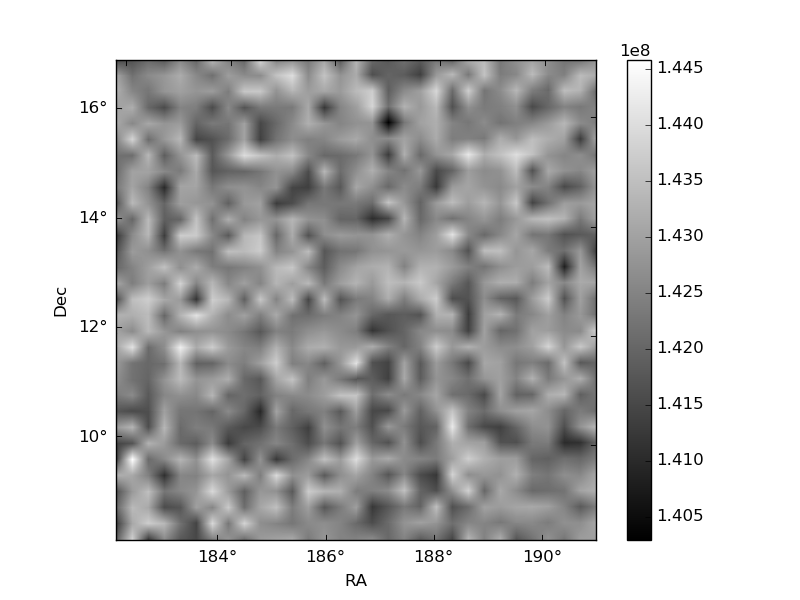
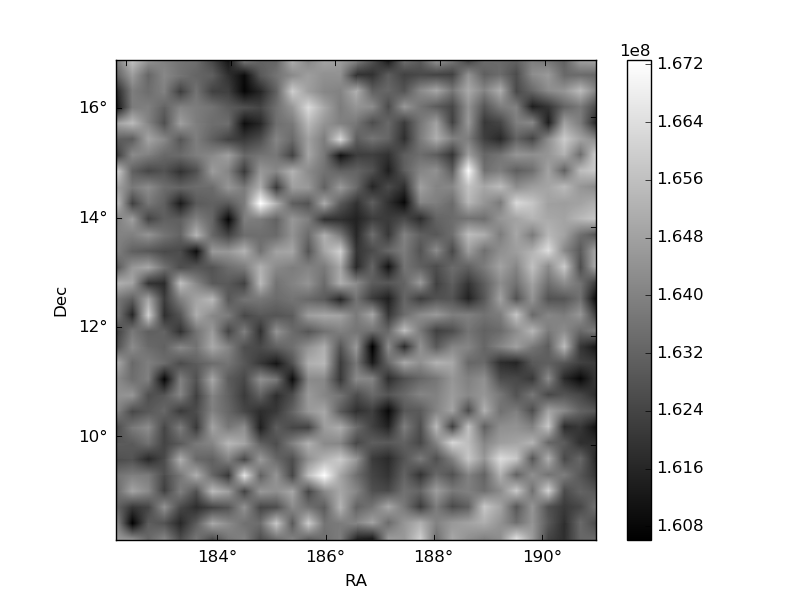
Histogram calculated using DETX and DETY for each event in the final _common_clean file
| Quadrant A | 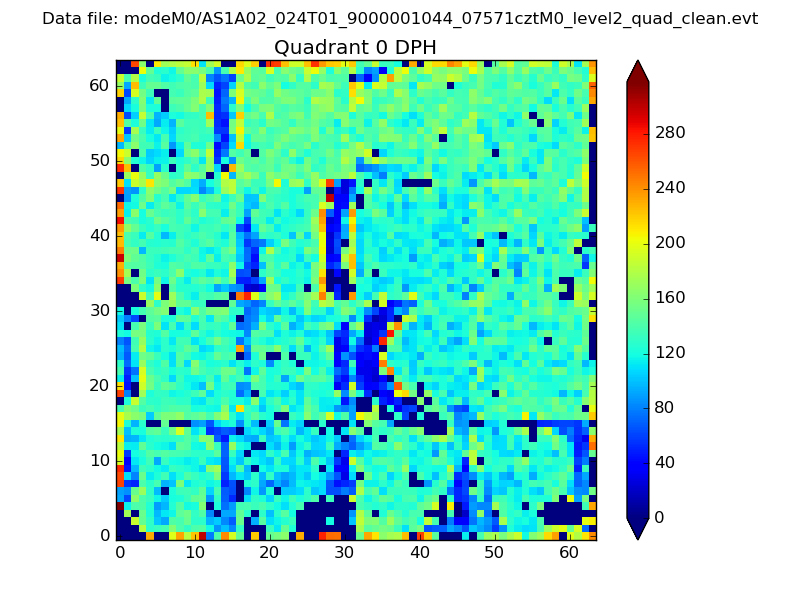 |
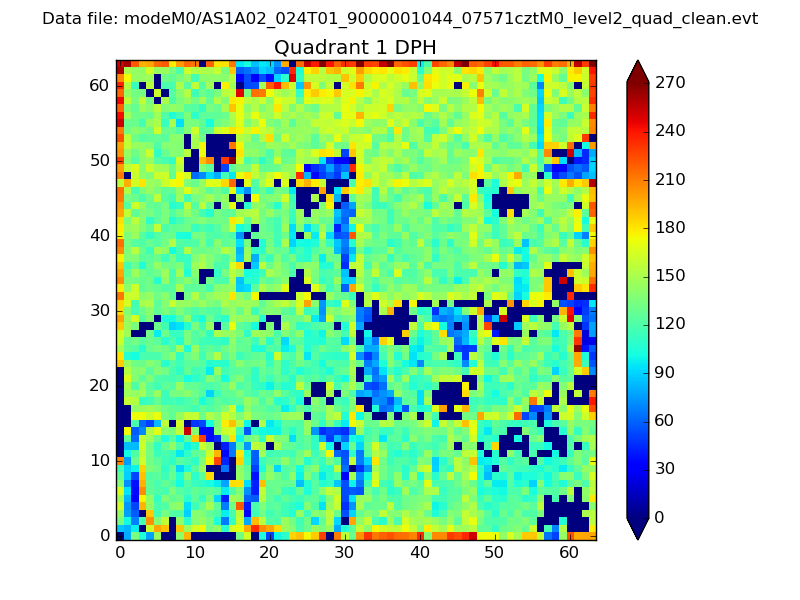 |
Quadrant B |
|---|---|---|---|
| Quadrant D | 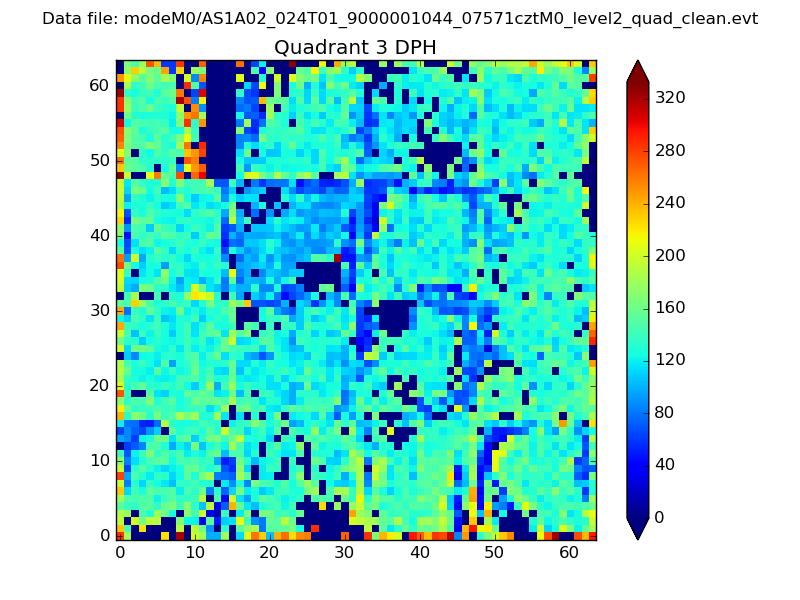 |
 |
Quadrant C |
| Plot type | Count rate plots | Images |
|---|---|---|
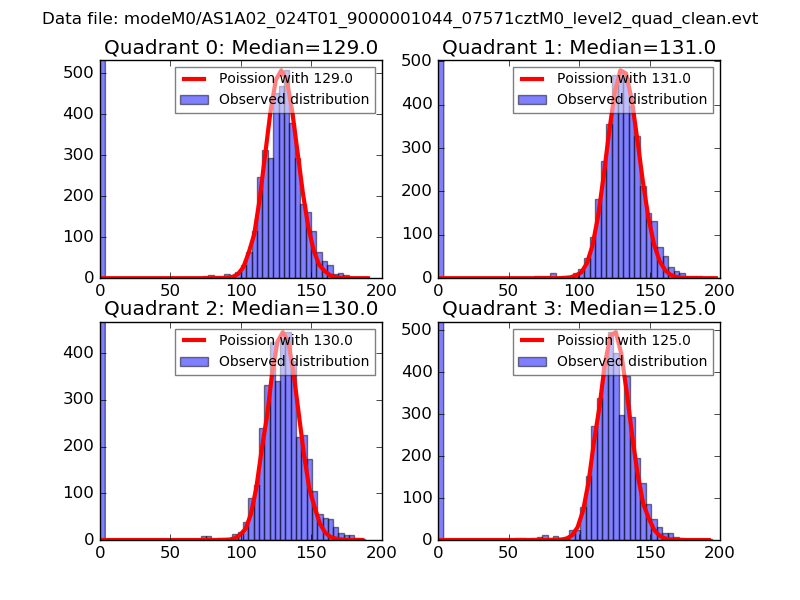
| Comparison with Poisson distribution Blue bars denote a histogram of data divided into 1 sec bins. Red curve is a Poisson curve with rate = median count rate of data. |
 |
 |
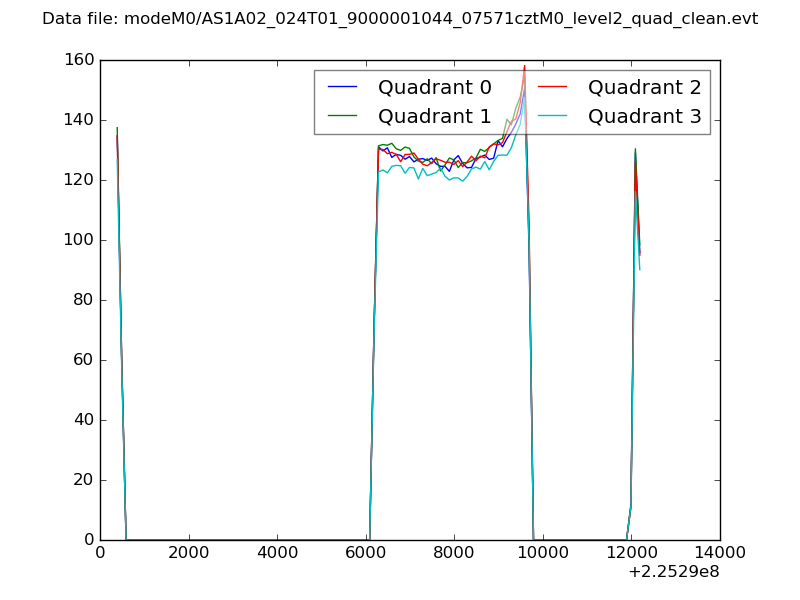
| Quadrant-wise count rates Data is divided into 100 sec bins |
 |
|
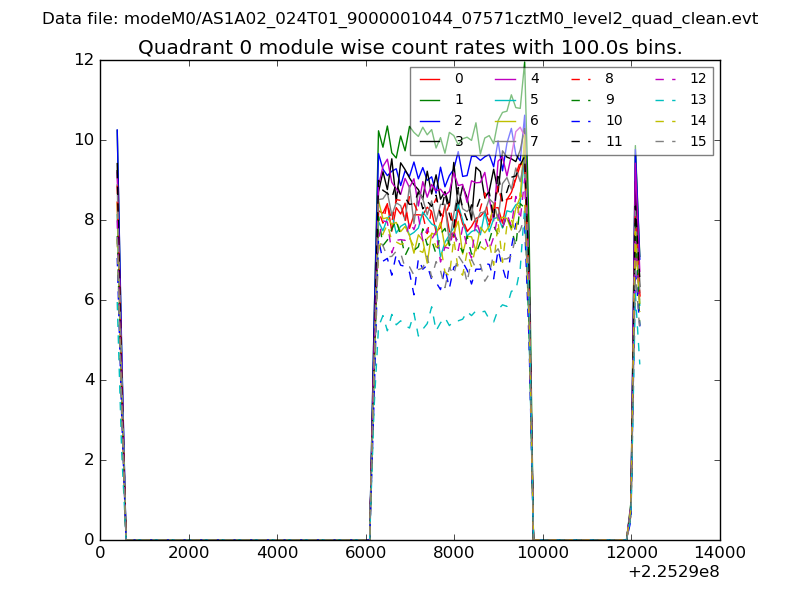
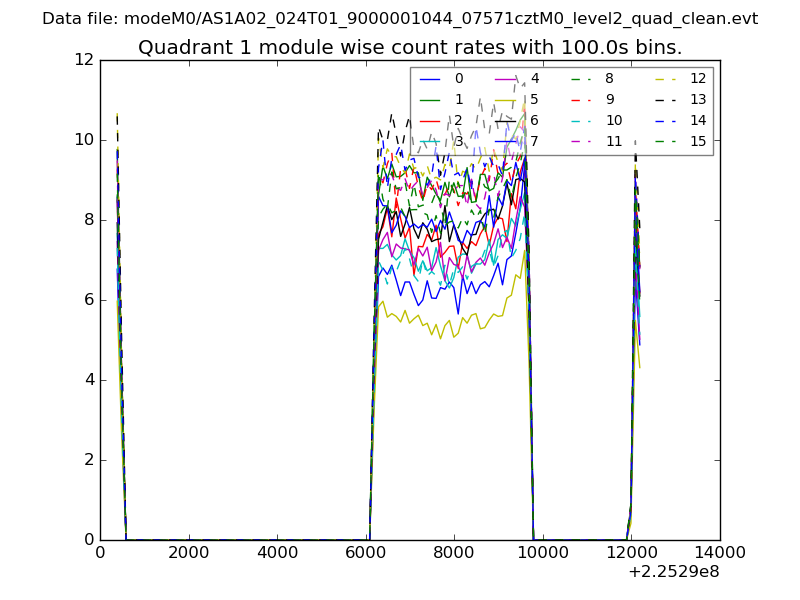
| Module-wise count rates for Quadrant A Data is divided into 100 sec bins |
 |
 |
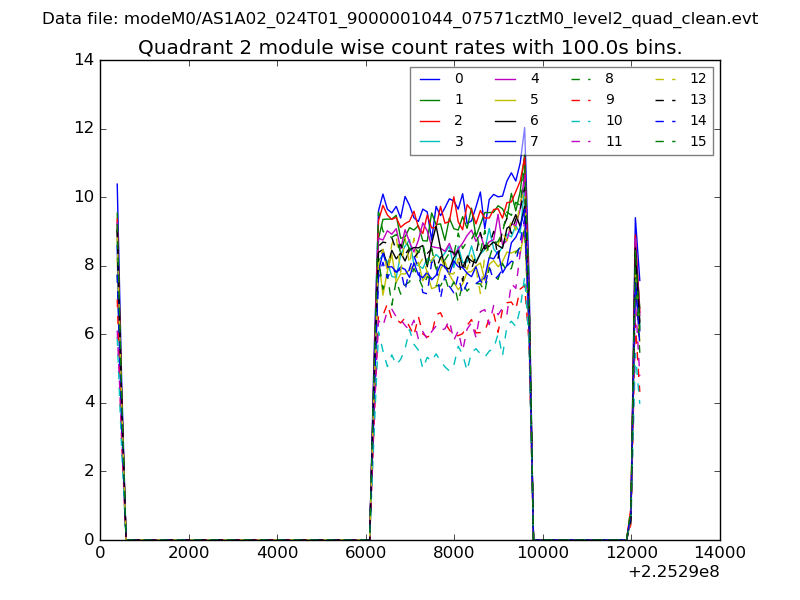
| Module-wise count rates for Quadrant B Data is divided into 100 sec bins |
 |
 |
| Module-wise count rates for Quadrant C Data is divided into 100 sec bins |
 |
 |
| Module-wise count rates for Quadrant D Data is divided into 100 sec bins |
 |
 |
| Parameter | Plot |
|---|---|
| CZT HV Monitor | 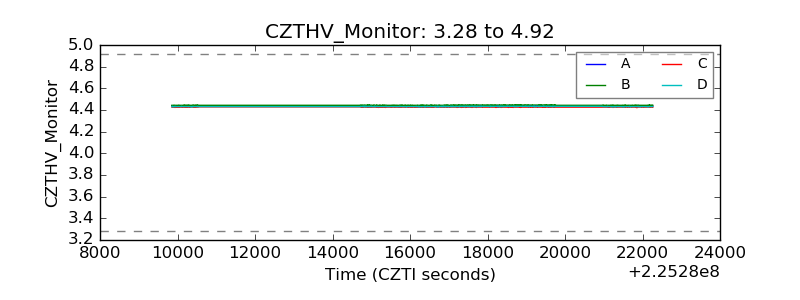 |
| D_VDD | 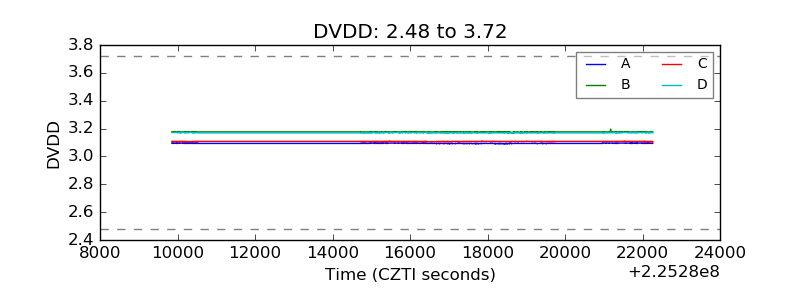 |
| Temperature 1 | 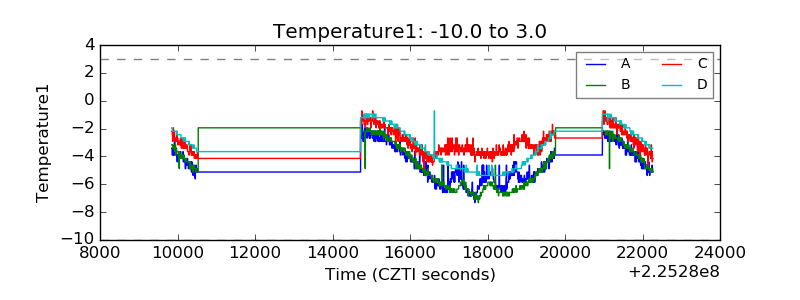 |
| Veto HV Monitor | 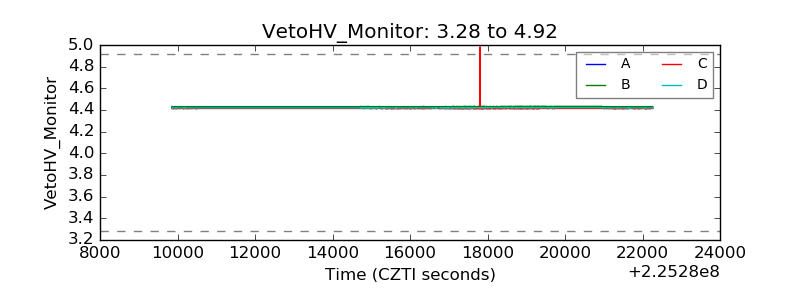 |
| Veto LLD |  |
| Alpha Counter | 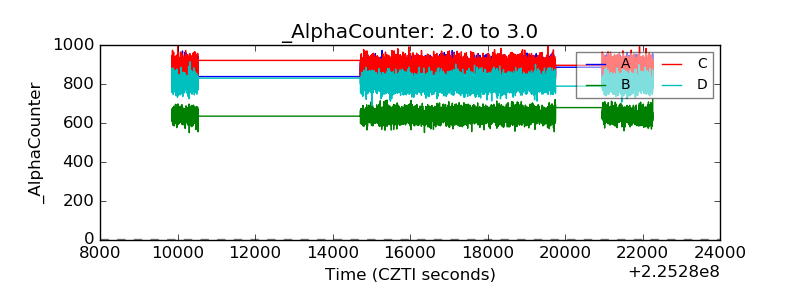 |
| _CPM_Rate | 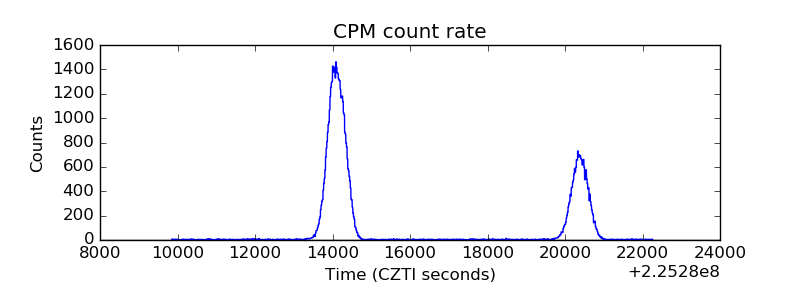 |
| CZT Counter | 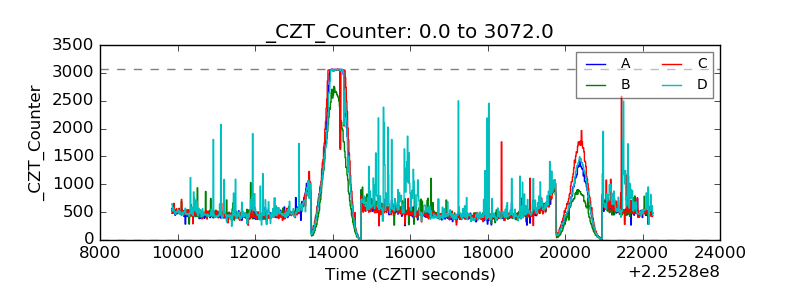 |
| +2.5 Volts monitor |  |
| +5 Volts monitor |  |
| _ROLL_ROT | 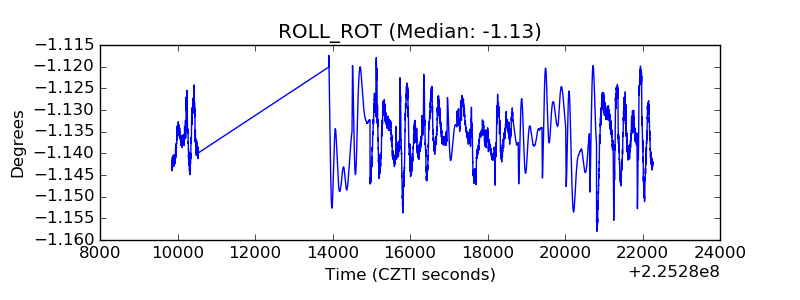 |
| _Roll_DEC | 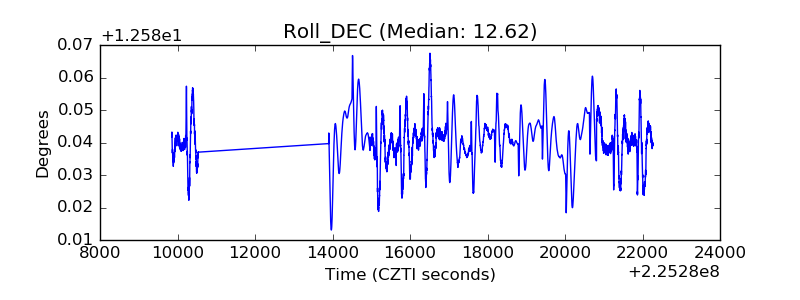 |
| _Roll_RA | 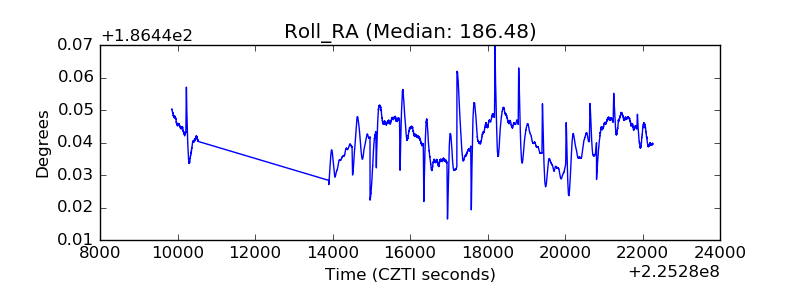 |
| Veto Counter |  |