| Param | Original file | Final file |
|---|---|---|
| Filename | modeM0/AS1A02_024T01_9000001044_07573cztM0_level2.evt | modeM0/AS1A02_024T01_9000001044_07573cztM0_level2_quad_clean.evt |
| Size (bytes) | 557,608,320 | 94,101,120 |
| Size | 531.8 MB | 89.7 MB |
| Events in quadrant A | 3,817,901 | 575,007 |
| Events in quadrant B | 3,941,025 | 585,451 |
| Events in quadrant C | 4,077,074 | 578,879 |
| Events in quadrant D | 4,511,588 | 557,326 |
| Mode SS | |||
|---|---|---|---|
| Quadrant | BADHDUFLAG | Total packets | Discarded packets |
| A | 0 | 164 | 0 |
| B | 0 | 164 | 0 |
| C | 0 | 164 | 0 |
| D | 0 | 164 | 0 |
| Mode M0 | |||
|---|---|---|---|
| Quadrant | BADHDUFLAG | Total packets | Discarded packets |
| A | 0 | 16613 | 3 |
| B | 0 | 16926 | 2 |
| C | 0 | 17615 | 2 |
| D | 0 | 18906 | 2 |
| Mode M9 | |||
|---|---|---|---|
| Quadrant | BADHDUFLAG | Total packets | Discarded packets |
| A | 0 | 14 | 0 |
| B | 0 | 14 | 0 |
| C | 0 | 14 | 0 |
| D | 0 | 14 | 0 |
| Quadrant | Total seconds | Saturated seconds | Saturation percentage |
|---|---|---|---|
| A | 7952 | 46 | 0.578471% |
| B | 7952 | 95 | 1.194668% |
| C | 7952 | 47 | 0.591046% |
| D | 7952 | 174 | 2.188129% |
Noise dominated data is calculated using 1-second bins in cleaned event files. If a bin has >2000 counts, and if more than 50% of those come from <1% of pixels, then it is considered to be noise-dominated and hence unusable.
| Quadrant | # 1 sec bins | Bins with >0 counts | Bins with >2000 counts | High rate bins dominated by noise | Noise dominated (total time) | Noise dominated (detector-on time) | Marked lightcurve |
|---|---|---|---|---|---|---|---|
| A | 9392 | 7954 | 3 | 3 | 0.03% | 0.04% | 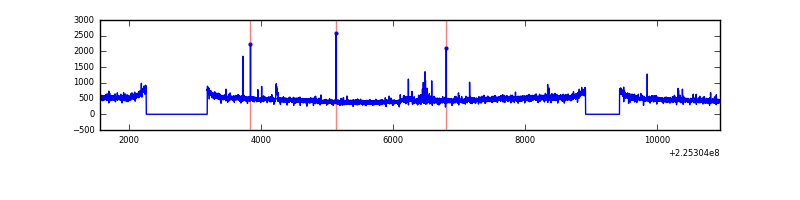 |
| B | 9392 | 7954 | 1 | 1 | 0.01% | 0.01% | 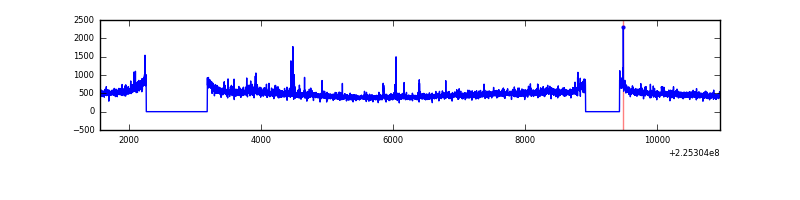 |
| C | 9392 | 7954 | 0 | 0 | 0.00% | 0.00% | 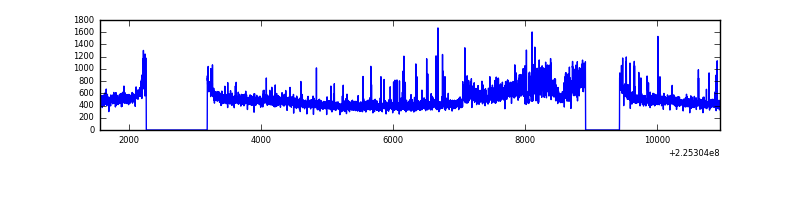 |
| D | 9392 | 7954 | 67 | 67 | 0.71% | 0.84% | 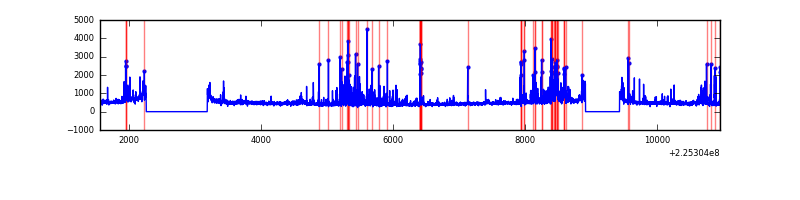 |
Top three noisy pixels from each quadrant. If the there are fewer than three noisy pixels in the level2.evt file, extra rows are filled as -1
| Pixel properties | Quadrant properties | ||||||
|---|---|---|---|---|---|---|---|
| Quadrant | DetID | PixID | Counts | Sigma | Mean | Median | Sigma |
| A | 15 | 239 | 68921 | 342.72 | 967 | 947 | 198.3 |
| A | 3 | 1 | 22107 | 106.69 | 967 | 947 | 198.3 |
| A | 0 | 226 | 9189 | 41.56 | 967 | 947 | 198.3 |
| B | 0 | 214 | 61819 | 326.56 | 975 | 952 | 186.4 |
| B | 0 | 219 | 30960 | 161.0 | 975 | 952 | 186.4 |
| B | 12 | 111 | 19226 | 98.04 | 975 | 952 | 186.4 |
| C | 9 | 68 | 373799 | 1693.0 | 943 | 949 | 220.2 |
| C | 8 | 229 | 10372 | 42.79 | 943 | 949 | 220.2 |
| C | 1 | 16 | 7954 | 31.81 | 943 | 949 | 220.2 |
| D | 2 | 152 | 660165 | 2836.35 | 939 | 908 | 232.4 |
| D | 5 | 233 | 117503 | 501.63 | 939 | 908 | 232.4 |
| D | 2 | 14 | 86151 | 366.75 | 939 | 908 | 232.4 |
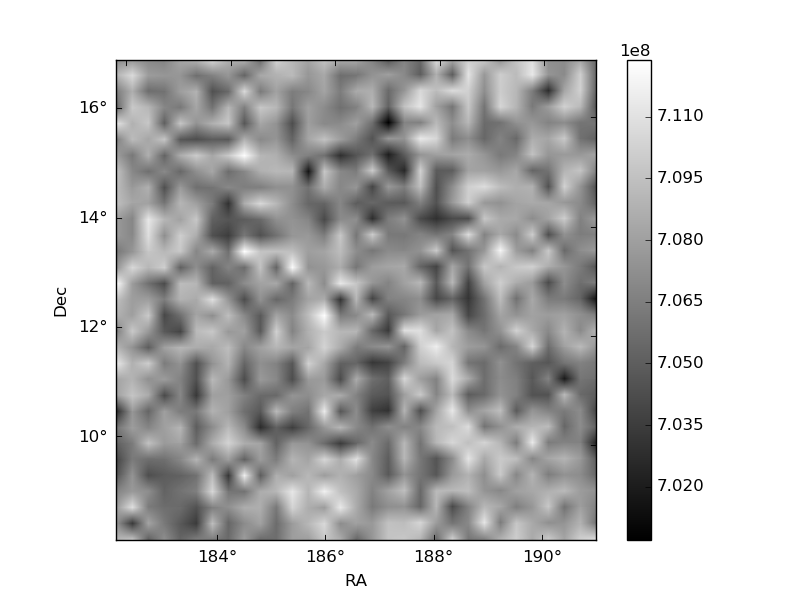
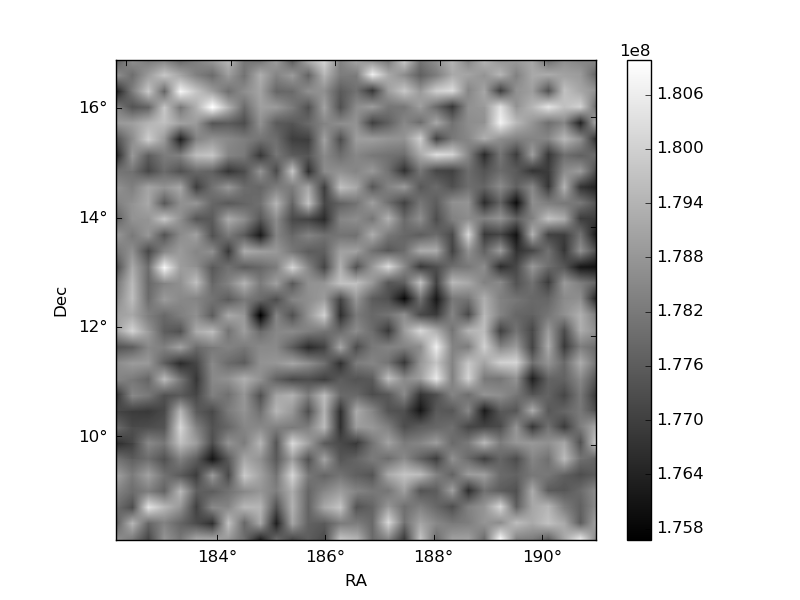
Histogram calculated using DETX and DETY for each event in the final _common_clean file
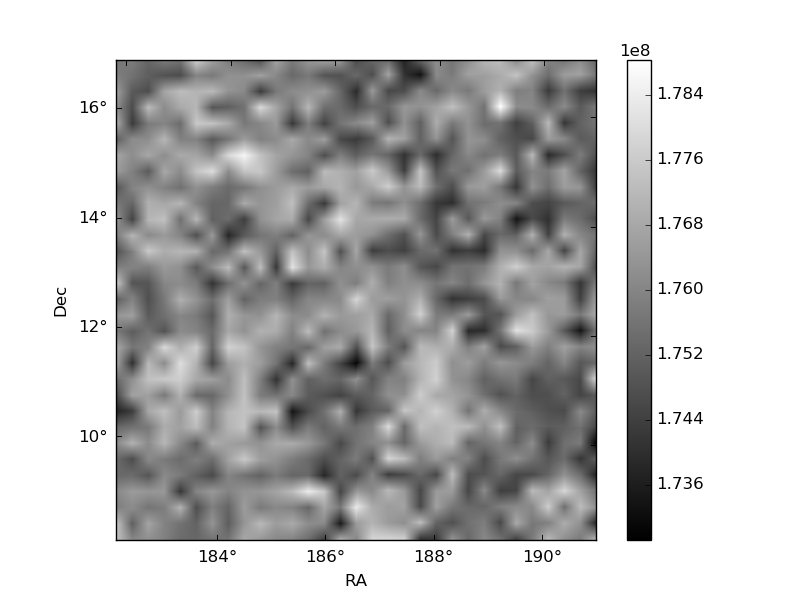
| Quadrant A | 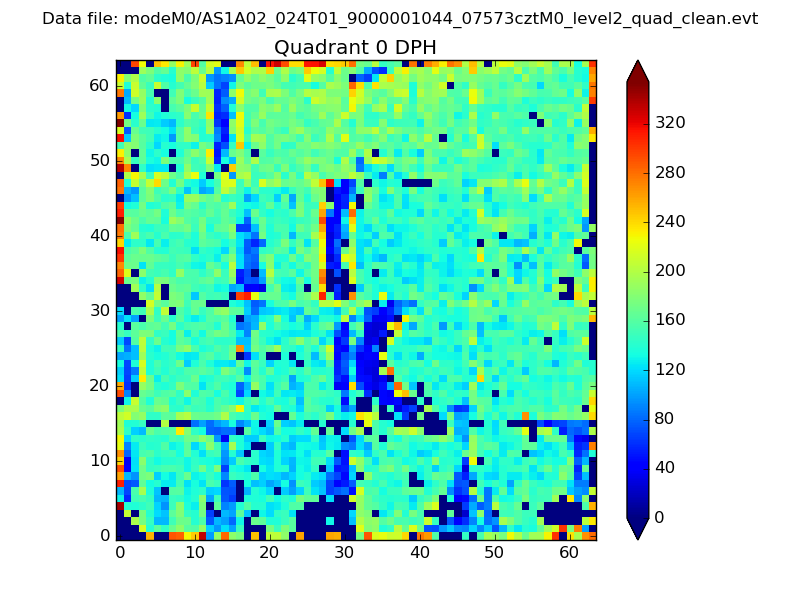 |
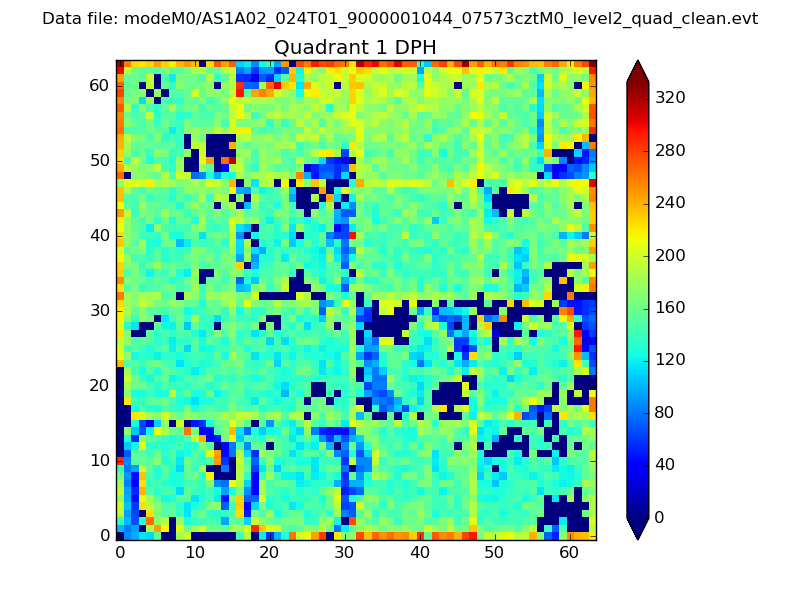 |
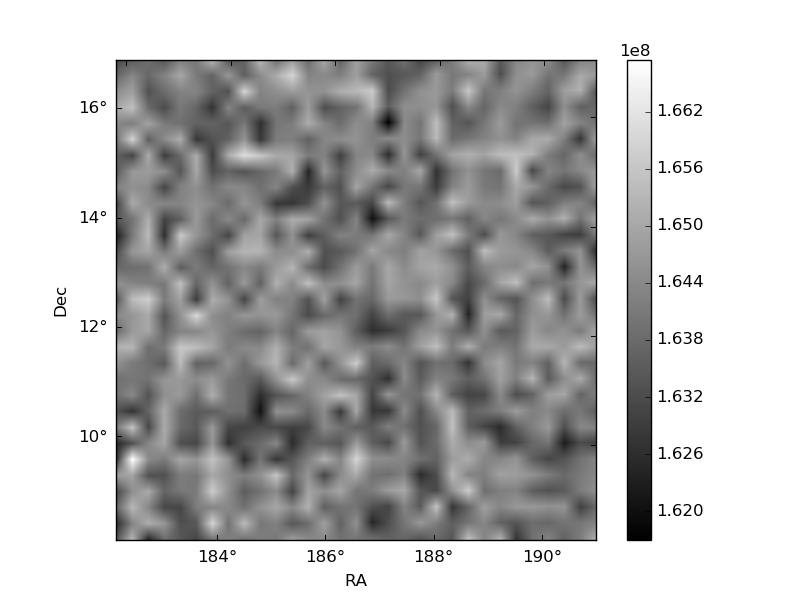
Quadrant B |
|---|---|---|---|
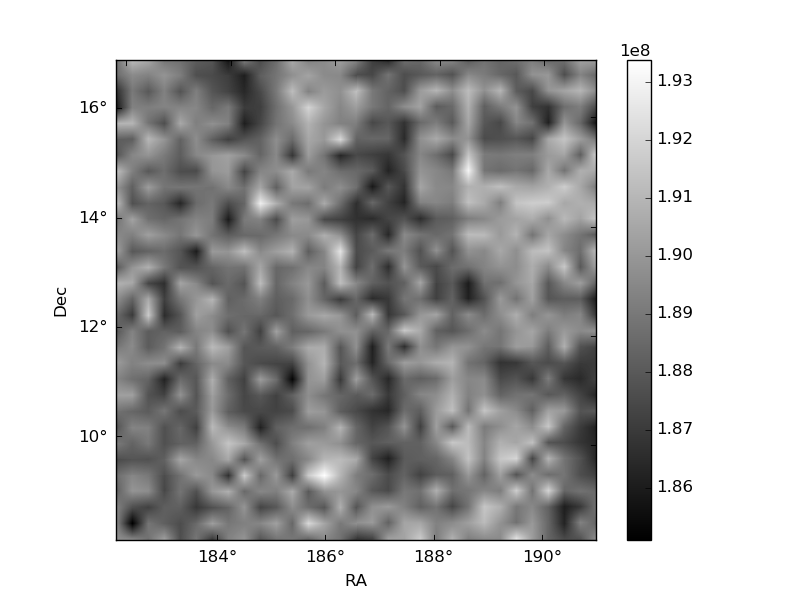
| Quadrant D | 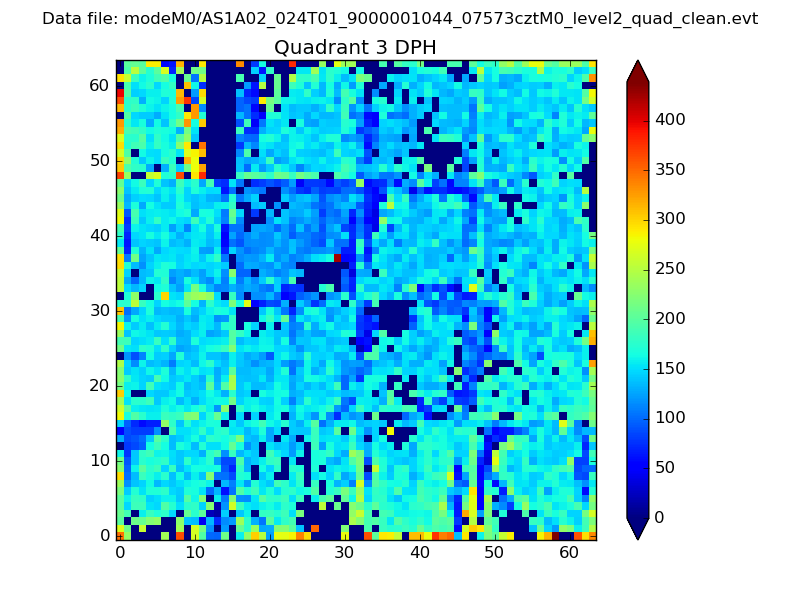 |
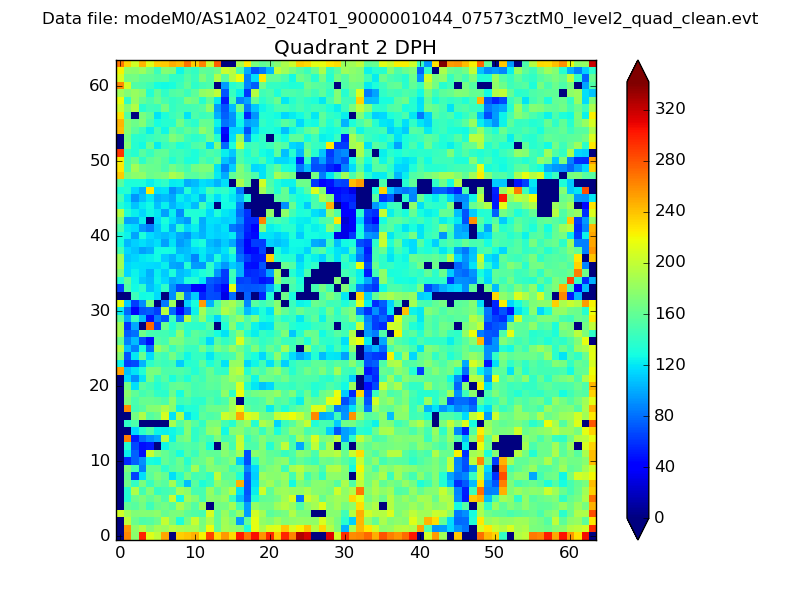 |
Quadrant C |
| Plot type | Count rate plots | Images |
|---|---|---|
| Comparison with Poisson distribution Blue bars denote a histogram of data divided into 1 sec bins. Red curve is a Poisson curve with rate = median count rate of data. |
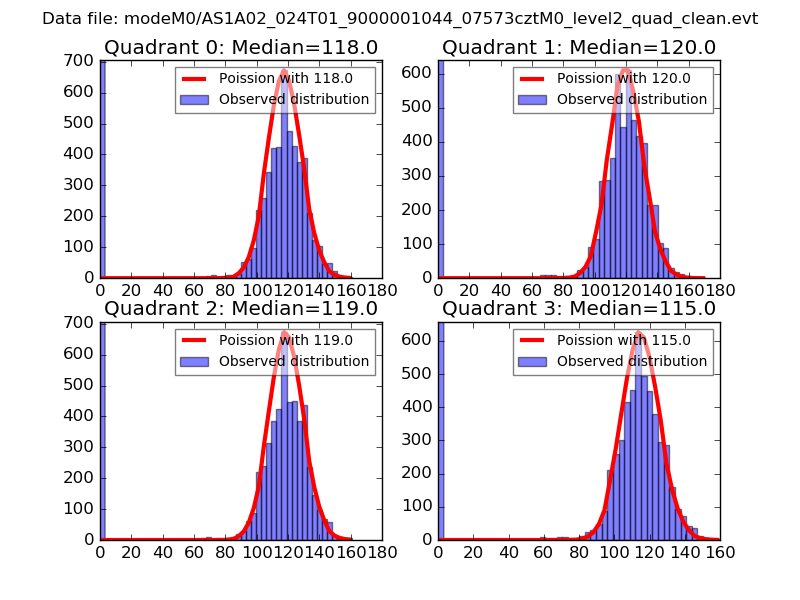 |
 |
| Quadrant-wise count rates Data is divided into 100 sec bins |
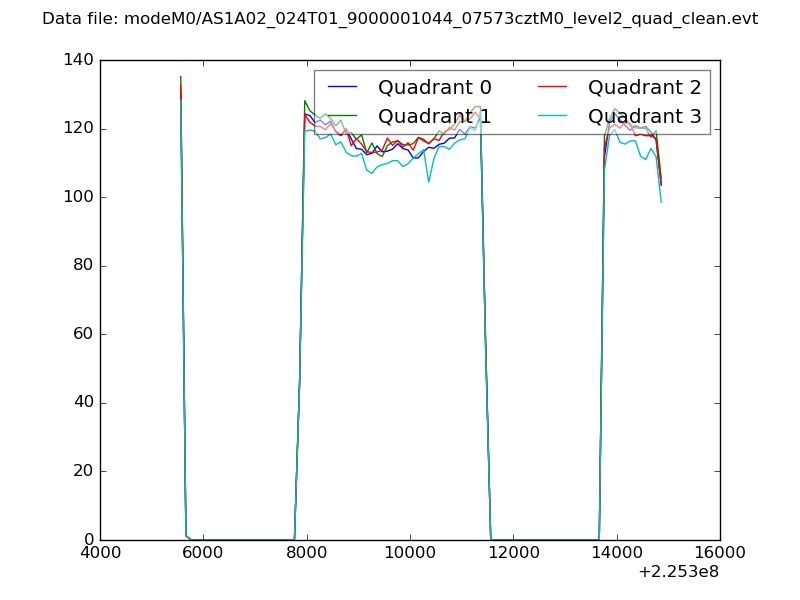 |
|
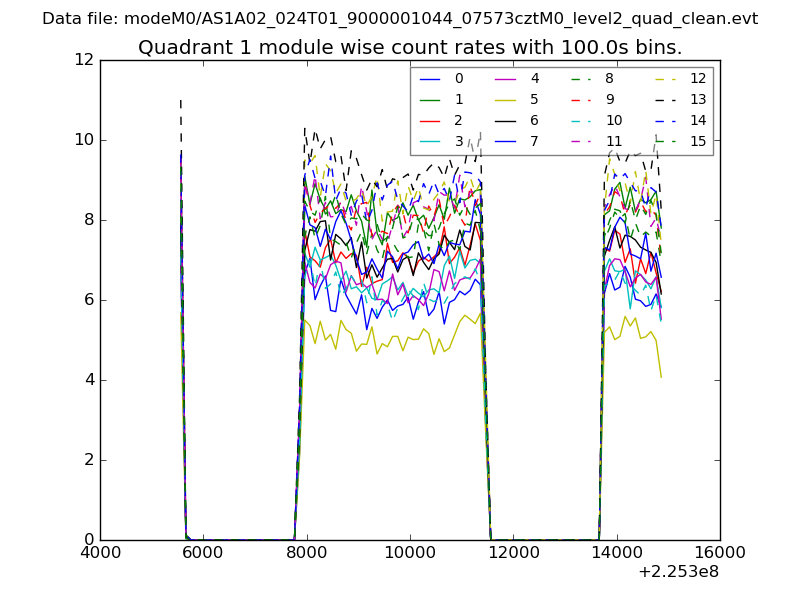
| Module-wise count rates for Quadrant A Data is divided into 100 sec bins |
 |
 |
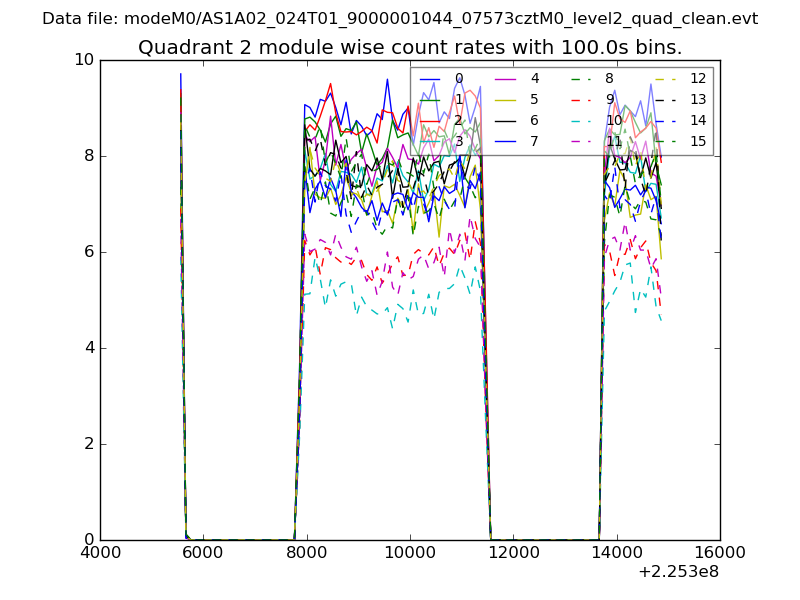
| Module-wise count rates for Quadrant B Data is divided into 100 sec bins |
 |
 |
| Module-wise count rates for Quadrant C Data is divided into 100 sec bins |
 |
 |
| Module-wise count rates for Quadrant D Data is divided into 100 sec bins |
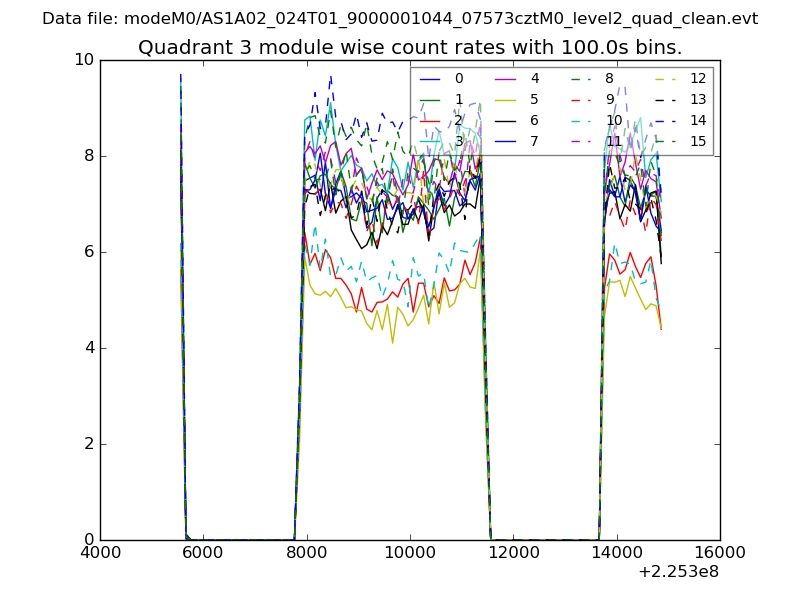 |
 |
| Parameter | Plot |
|---|---|
| CZT HV Monitor |  |
| D_VDD | 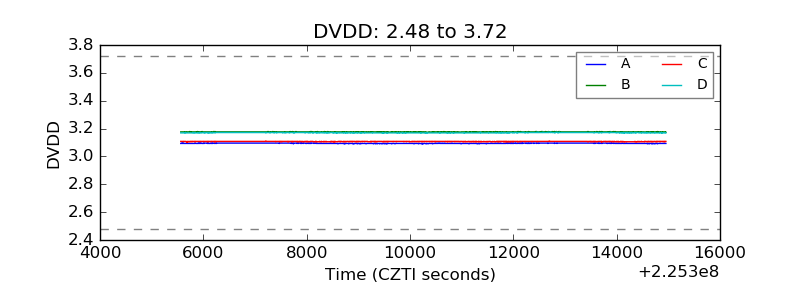 |
| Temperature 1 |  |
| Veto HV Monitor | 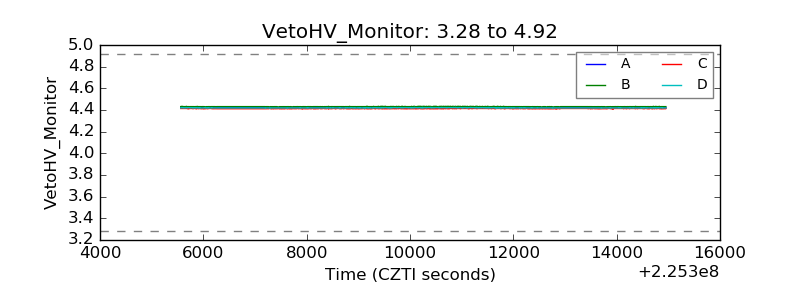 |
| Veto LLD | 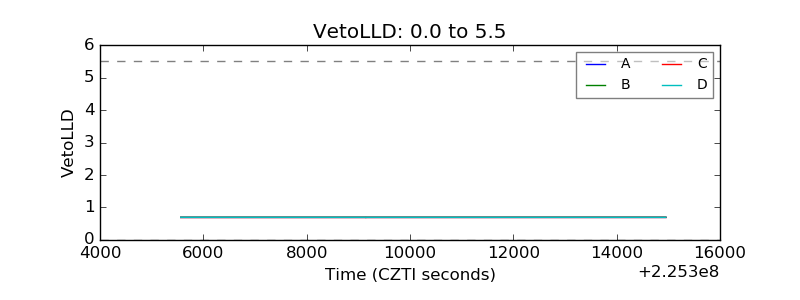 |
| Alpha Counter | 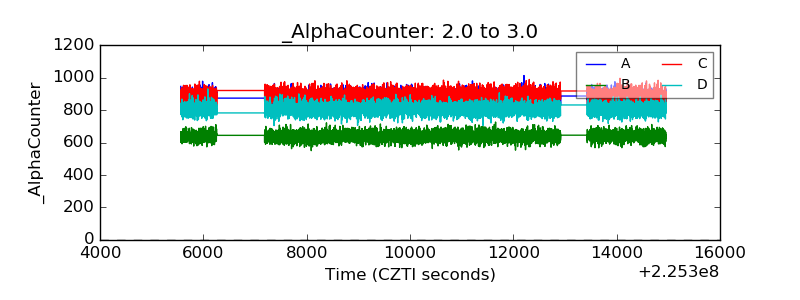 |
| _CPM_Rate | 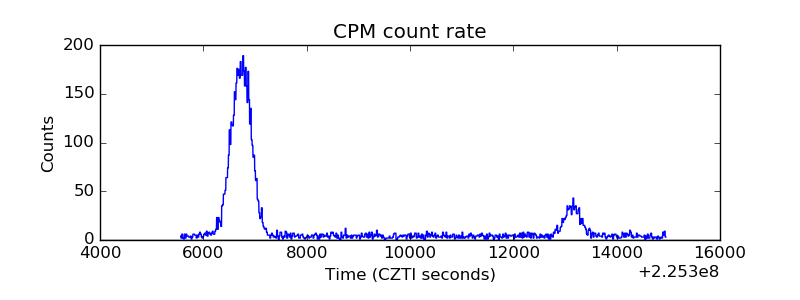 |
| CZT Counter | 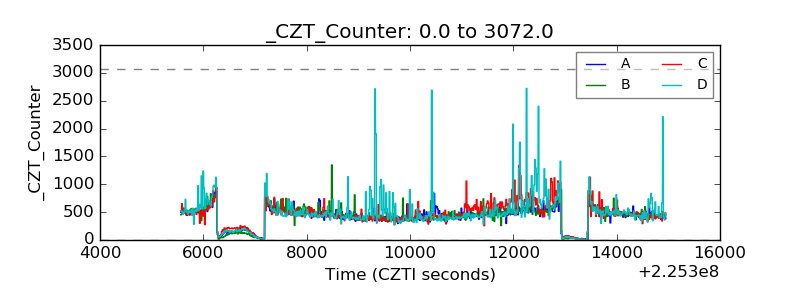 |
| +2.5 Volts monitor |  |
| +5 Volts monitor |  |
| _ROLL_ROT | 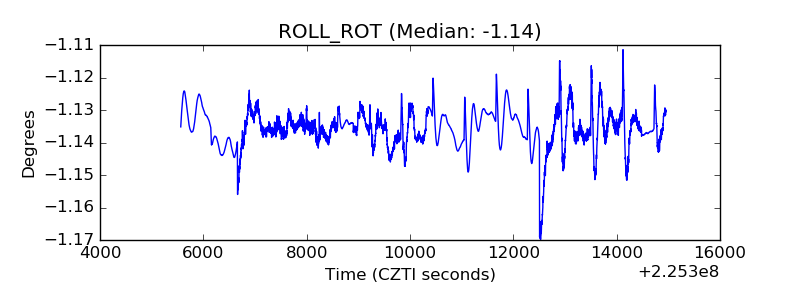 |
| _Roll_DEC | 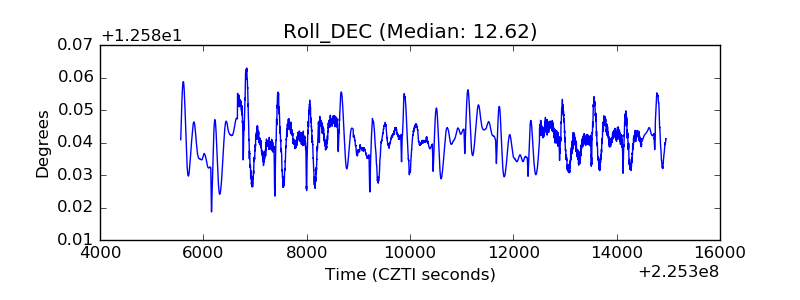 |
| _Roll_RA | 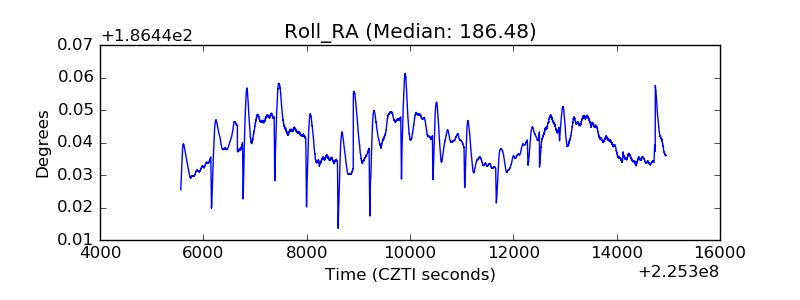 |
| Veto Counter | 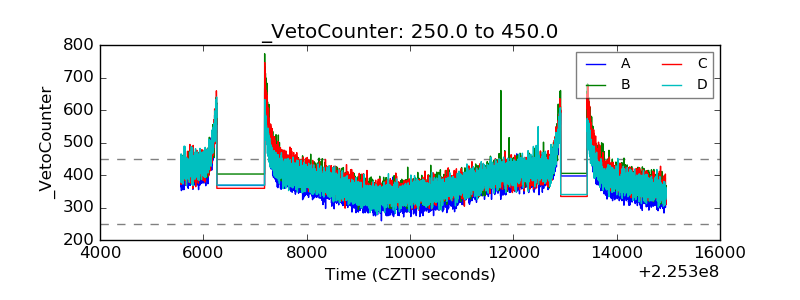 |