| Param | Original file | Final file |
|---|---|---|
| Filename | modeM0/AS1A02_024T01_9000001044_07574cztM0_level2.evt | modeM0/AS1A02_024T01_9000001044_07574cztM0_level2_quad_clean.evt |
| Size (bytes) | 542,427,840 | 96,289,920 |
| Size | 517.3 MB | 91.8 MB |
| Events in quadrant A | 3,946,859 | 596,500 |
| Events in quadrant B | 3,778,704 | 609,841 |
| Events in quadrant C | 3,764,352 | 602,038 |
| Events in quadrant D | 4,417,641 | 574,893 |
| Mode SS | |||
|---|---|---|---|
| Quadrant | BADHDUFLAG | Total packets | Discarded packets |
| A | 0 | 154 | 0 |
| B | 0 | 154 | 0 |
| C | 0 | 154 | 0 |
| D | 0 | 154 | 0 |
| Mode M0 | |||
|---|---|---|---|
| Quadrant | BADHDUFLAG | Total packets | Discarded packets |
| A | 0 | 16830 | 4 |
| B | 0 | 16451 | 3 |
| C | 0 | 16486 | 3 |
| D | 0 | 18415 | 3 |
| Mode M9 | |||
|---|---|---|---|
| Quadrant | BADHDUFLAG | Total packets | Discarded packets |
| A | 0 | 3 | 0 |
| B | 0 | 3 | 0 |
| C | 0 | 3 | 0 |
| D | 0 | 4 | 0 |
| Quadrant | Total seconds | Saturated seconds | Saturation percentage |
|---|---|---|---|
| A | 7656 | 143 | 1.867816% |
| B | 7656 | 180 | 2.351097% |
| C | 7656 | 58 | 0.757576% |
| D | 7656 | 167 | 2.181296% |
Noise dominated data is calculated using 1-second bins in cleaned event files. If a bin has >2000 counts, and if more than 50% of those come from <1% of pixels, then it is considered to be noise-dominated and hence unusable.
| Quadrant | # 1 sec bins | Bins with >0 counts | Bins with >2000 counts | High rate bins dominated by noise | Noise dominated (total time) | Noise dominated (detector-on time) | Marked lightcurve |
|---|---|---|---|---|---|---|---|
| A | 7696 | 7658 | 27 | 27 | 0.35% | 0.35% |  |
| B | 7696 | 7658 | 3 | 3 | 0.04% | 0.04% |  |
| C | 7696 | 7658 | 3 | 3 | 0.04% | 0.04% |  |
| D | 7696 | 7658 | 79 | 79 | 1.03% | 1.03% |  |
Top three noisy pixels from each quadrant. If the there are fewer than three noisy pixels in the level2.evt file, extra rows are filled as -1
| Pixel properties | Quadrant properties | ||||||
|---|---|---|---|---|---|---|---|
| Quadrant | DetID | PixID | Counts | Sigma | Mean | Median | Sigma |
| A | 15 | 239 | 347364 | 1810.16 | 932 | 910 | 191.4 |
| A | 3 | 1 | 14008 | 68.43 | 932 | 910 | 191.4 |
| A | 0 | 226 | 8919 | 41.84 | 932 | 910 | 191.4 |
| B | 0 | 214 | 58978 | 314.73 | 945 | 921 | 184.5 |
| B | 12 | 111 | 19153 | 98.84 | 945 | 921 | 184.5 |
| B | 0 | 230 | 17804 | 91.52 | 945 | 921 | 184.5 |
| C | 9 | 68 | 176591 | 815.86 | 911 | 915 | 215.3 |
| C | 1 | 16 | 19243 | 85.12 | 911 | 915 | 215.3 |
| C | 10 | 22 | 7460 | 30.4 | 911 | 915 | 215.3 |
| D | 2 | 152 | 554409 | 2477.0 | 902 | 874 | 223.5 |
| D | 2 | 14 | 291761 | 1301.68 | 902 | 874 | 223.5 |
| D | 5 | 233 | 122720 | 545.25 | 902 | 874 | 223.5 |
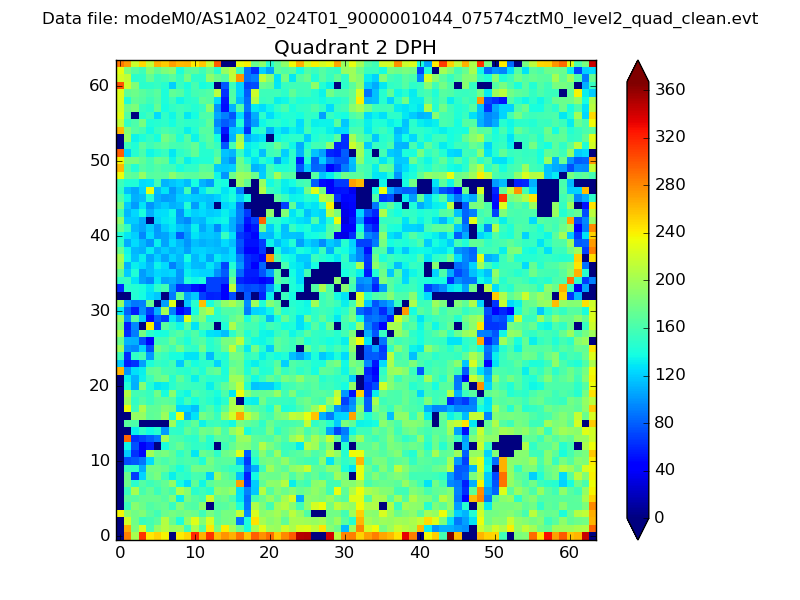
Histogram calculated using DETX and DETY for each event in the final _common_clean file
| Quadrant A | 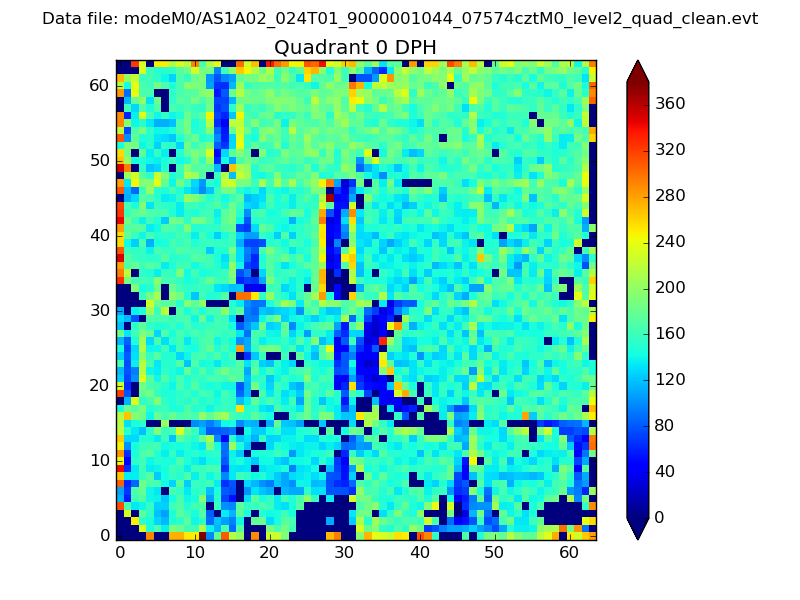 |
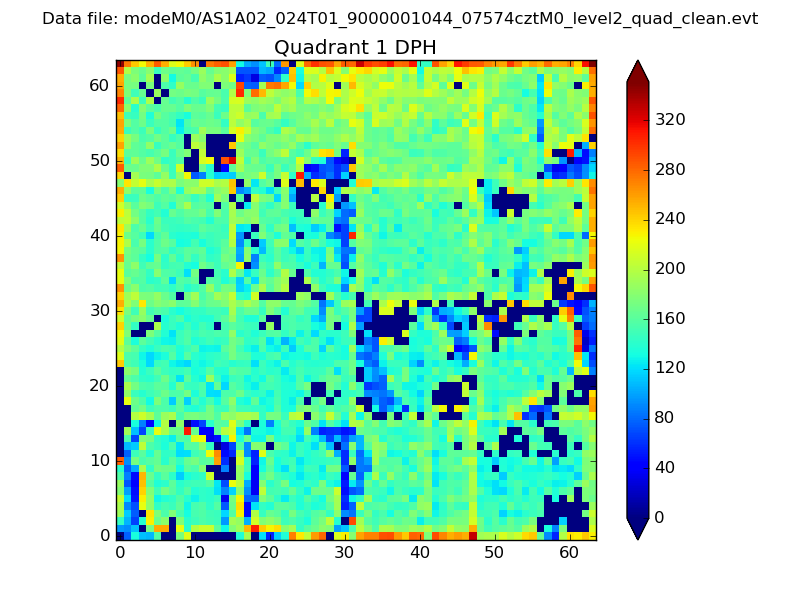 |
Quadrant B |
|---|---|---|---|
| Quadrant D | 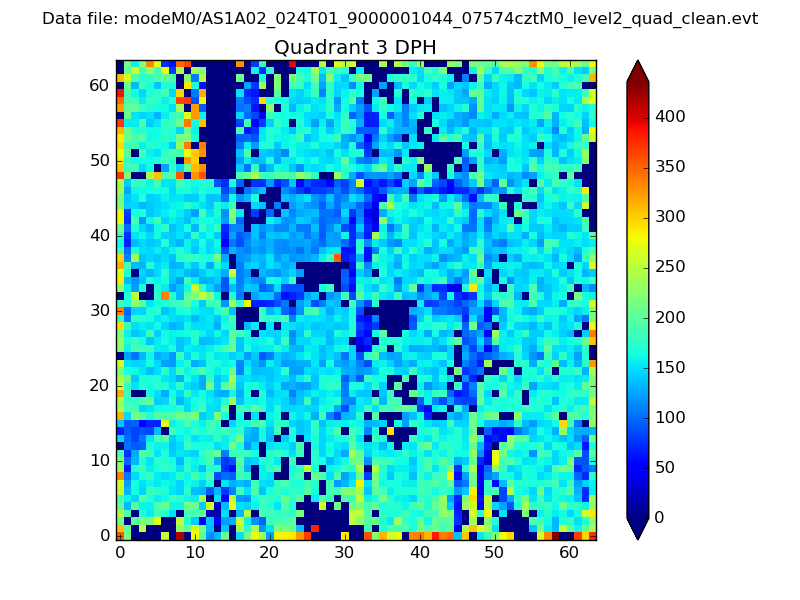 |
 |
Quadrant C |
| Plot type | Count rate plots | Images |
|---|---|---|
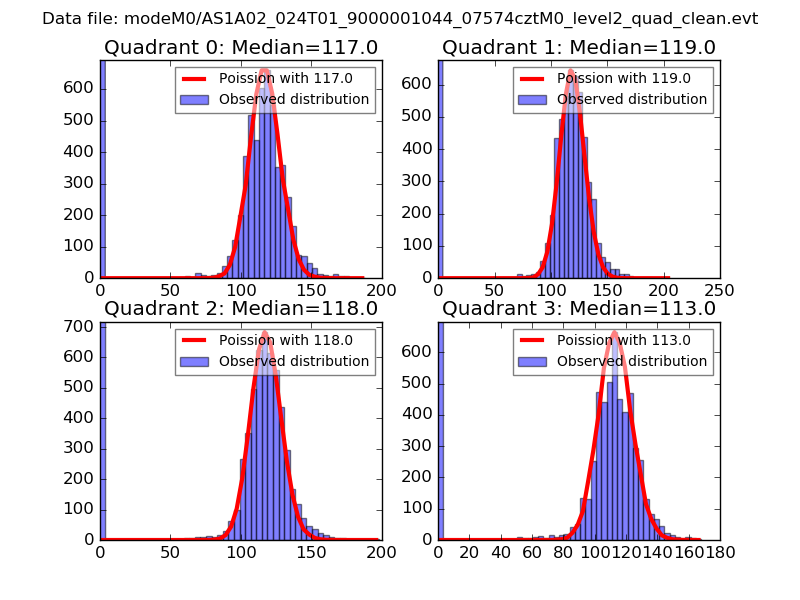
| Comparison with Poisson distribution Blue bars denote a histogram of data divided into 1 sec bins. Red curve is a Poisson curve with rate = median count rate of data. |
 |
 |
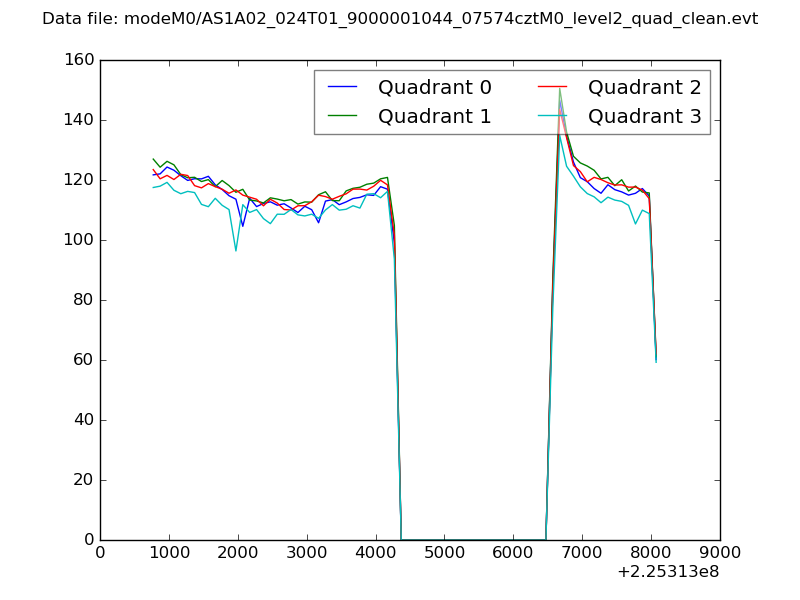
| Quadrant-wise count rates Data is divided into 100 sec bins |
 |
|
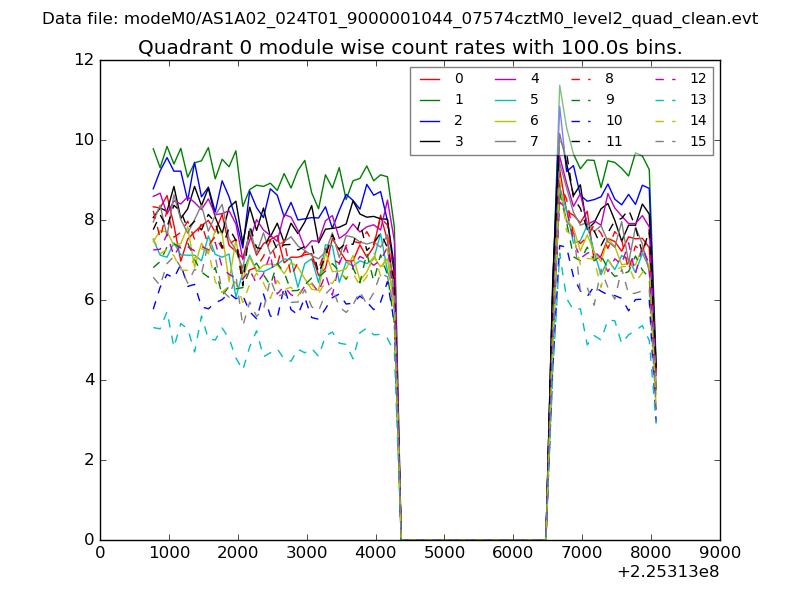
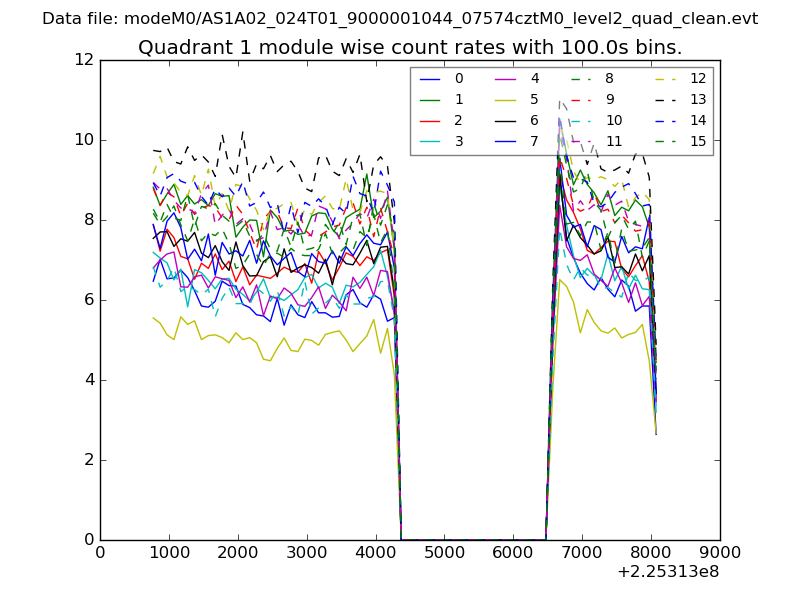
| Module-wise count rates for Quadrant A Data is divided into 100 sec bins |
 |
 |
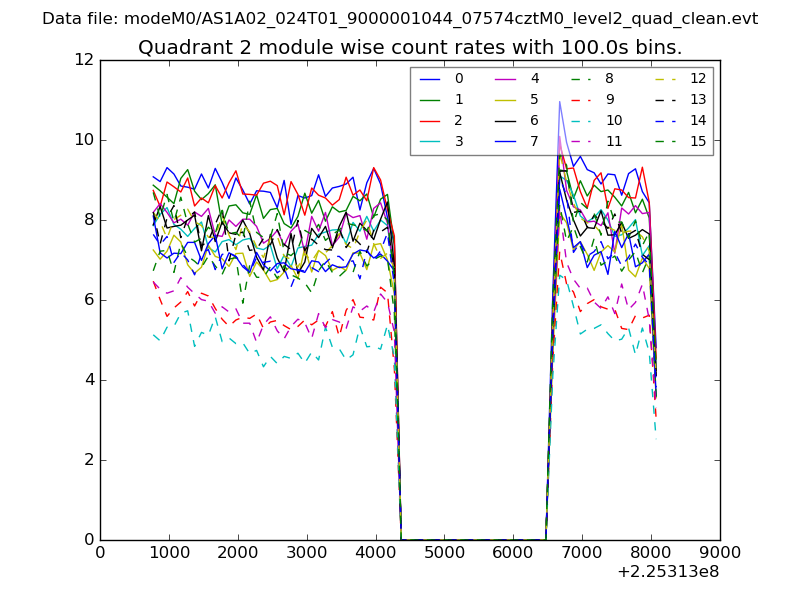
| Module-wise count rates for Quadrant B Data is divided into 100 sec bins |
 |
 |
| Module-wise count rates for Quadrant C Data is divided into 100 sec bins |
 |
 |
| Module-wise count rates for Quadrant D Data is divided into 100 sec bins |
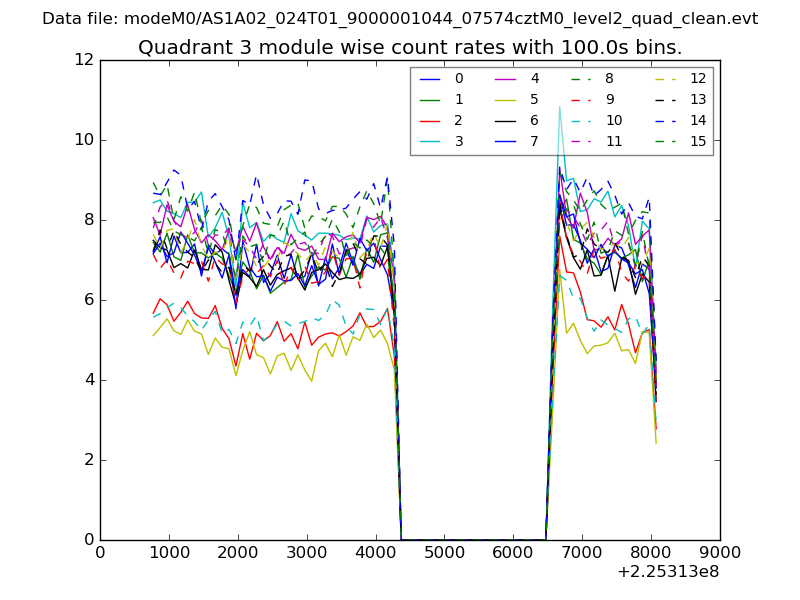 |
 |
| Parameter | Plot |
|---|---|
| CZT HV Monitor | 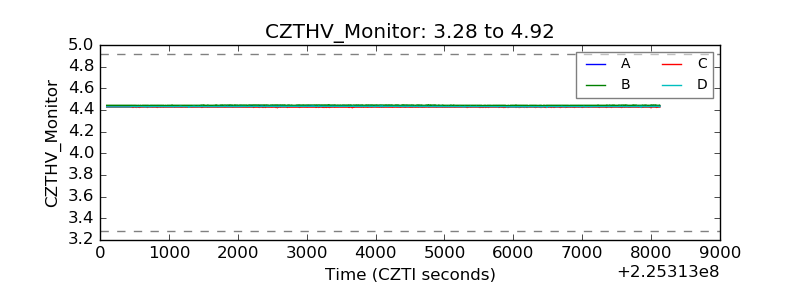 |
| D_VDD | 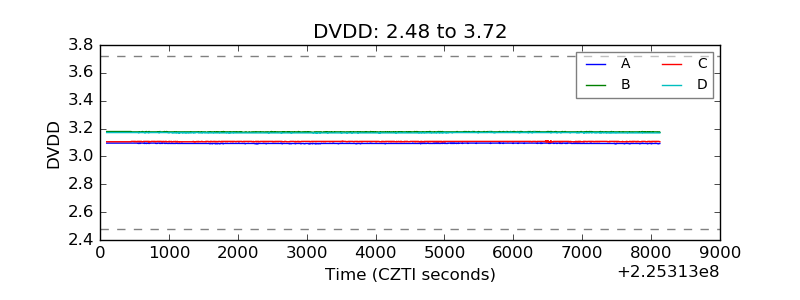 |
| Temperature 1 | 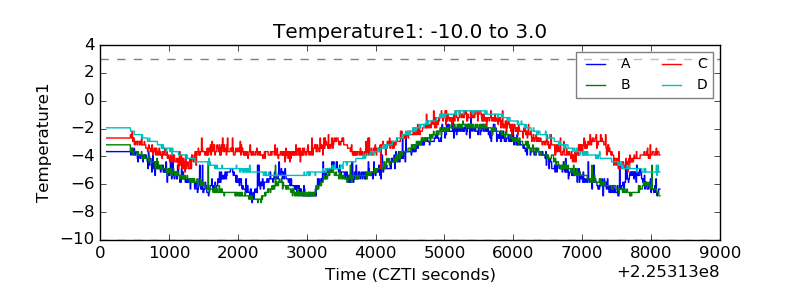 |
| Veto HV Monitor | 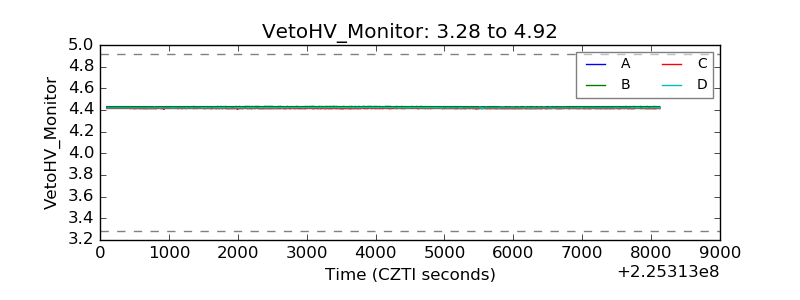 |
| Veto LLD | 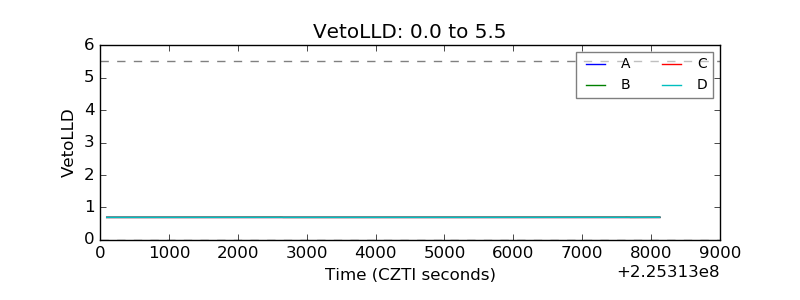 |
| Alpha Counter | 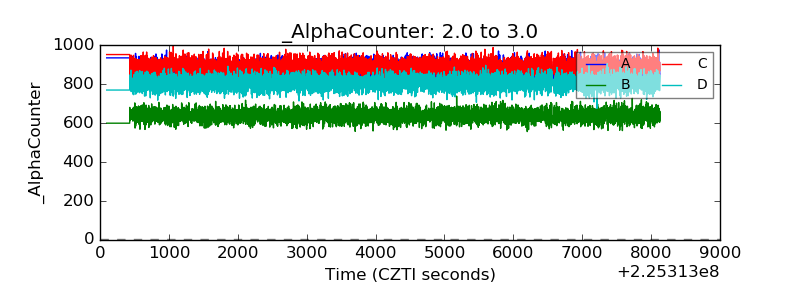 |
| _CPM_Rate | 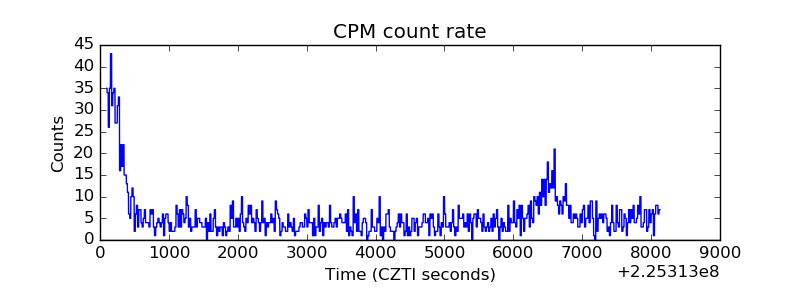 |
| CZT Counter | 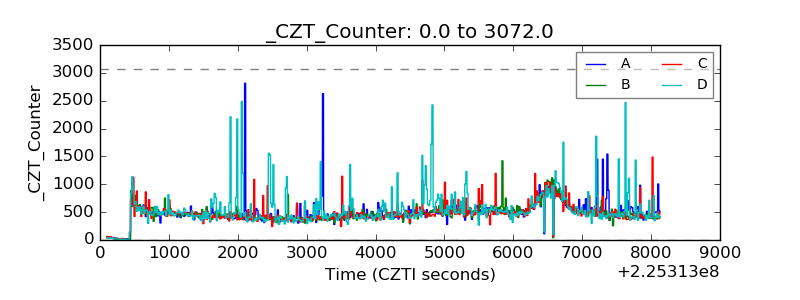 |
| +2.5 Volts monitor |  |
| +5 Volts monitor |  |
| _ROLL_ROT | 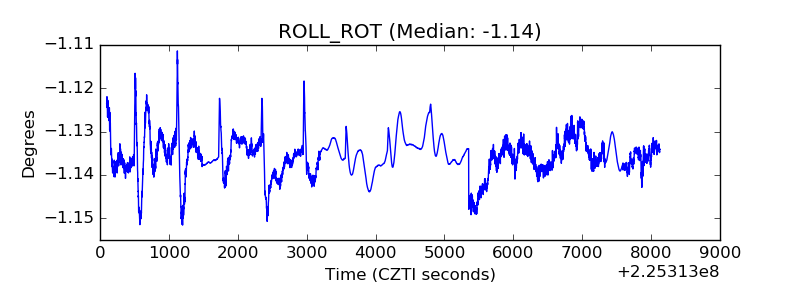 |
| _Roll_DEC | 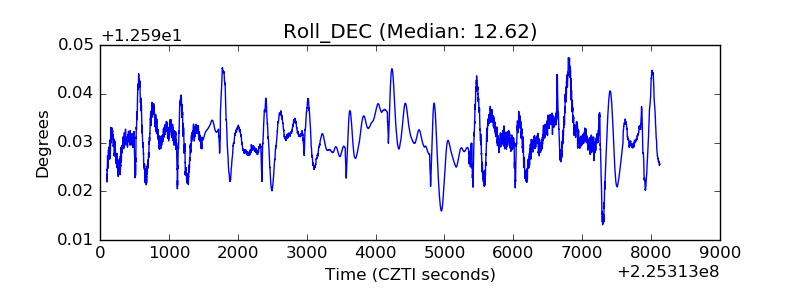 |
| _Roll_RA | 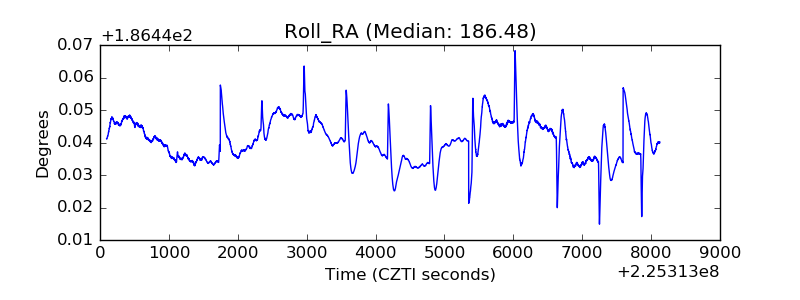 |
| Veto Counter | 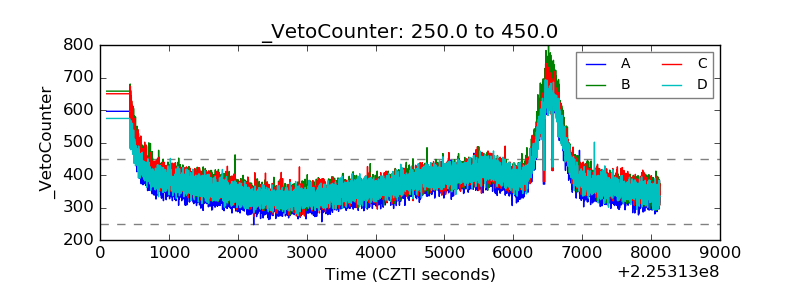 |