| Param | Original file | Final file |
|---|---|---|
| Filename | modeM0/AS1A02_024T01_9000001044_07578cztM0_level2.evt | modeM0/AS1A02_024T01_9000001044_07578cztM0_level2_quad_clean.evt |
| Size (bytes) | 1,193,215,680 | 171,794,880 |
| Size | 1.1 GB | 163.8 MB |
| Events in quadrant A | 10,893,326 | 1,041,280 |
| Events in quadrant B | 7,125,993 | 1,078,165 |
| Events in quadrant C | 8,051,606 | 1,067,766 |
| Events in quadrant D | 9,081,759 | 1,009,289 |
| Mode SS | |||
|---|---|---|---|
| Quadrant | BADHDUFLAG | Total packets | Discarded packets |
| A | 0 | 298 | 0 |
| B | 0 | 298 | 0 |
| C | 0 | 298 | 0 |
| D | 0 | 298 | 0 |
| Mode M0 | |||
|---|---|---|---|
| Quadrant | BADHDUFLAG | Total packets | Discarded packets |
| A | 0 | 42434 | 4 |
| B | 0 | 31080 | 3 |
| C | 0 | 33498 | 3 |
| D | 0 | 37062 | 3 |
| Mode M9 | |||
|---|---|---|---|
| Quadrant | BADHDUFLAG | Total packets | Discarded packets |
| A | 0 | 8 | 0 |
| B | 0 | 8 | 0 |
| C | 0 | 8 | 0 |
| D | 0 | 8 | 0 |
| Quadrant | Total seconds | Saturated seconds | Saturation percentage |
|---|---|---|---|
| A | 14580 | 905 | 6.207133% |
| B | 14580 | 374 | 2.565158% |
| C | 14580 | 213 | 1.460905% |
| D | 14580 | 639 | 4.382716% |
Noise dominated data is calculated using 1-second bins in cleaned event files. If a bin has >2000 counts, and if more than 50% of those come from <1% of pixels, then it is considered to be noise-dominated and hence unusable.
| Quadrant | # 1 sec bins | Bins with >0 counts | Bins with >2000 counts | High rate bins dominated by noise | Noise dominated (total time) | Noise dominated (detector-on time) | Marked lightcurve |
|---|---|---|---|---|---|---|---|
| A | 15220 | 14585 | 492 | 492 | 3.23% | 3.37% | 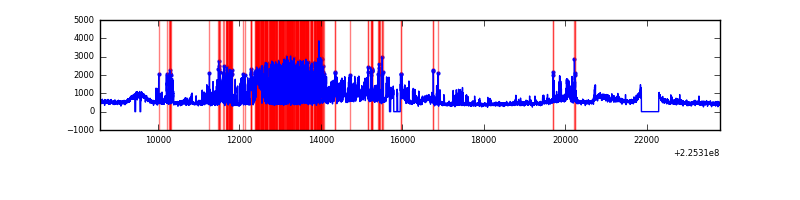 |
| B | 15220 | 14586 | 2 | 2 | 0.01% | 0.01% | 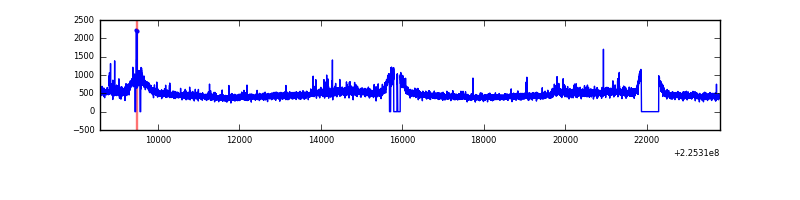 |
| C | 15220 | 14586 | 15 | 15 | 0.10% | 0.10% | 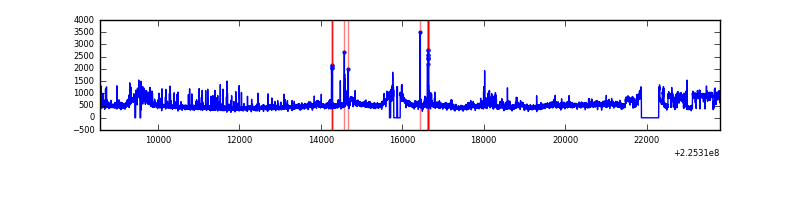 |
| D | 15220 | 14585 | 387 | 387 | 2.54% | 2.65% | 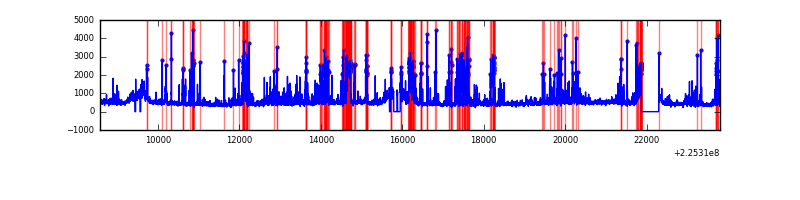 |
Top three noisy pixels from each quadrant. If the there are fewer than three noisy pixels in the level2.evt file, extra rows are filled as -1
| Pixel properties | Quadrant properties | ||||||
|---|---|---|---|---|---|---|---|
| Quadrant | DetID | PixID | Counts | Sigma | Mean | Median | Sigma |
| A | 15 | 239 | 4117351 | 11357.84 | 1759 | 1723 | 362.4 |
| A | 3 | 1 | 20541 | 51.93 | 1759 | 1723 | 362.4 |
| A | 0 | 226 | 16763 | 41.51 | 1759 | 1723 | 362.4 |
| B | 0 | 214 | 94892 | 268.43 | 1789 | 1739 | 347.0 |
| B | 0 | 219 | 49661 | 138.09 | 1789 | 1739 | 347.0 |
| B | 12 | 111 | 36984 | 101.56 | 1789 | 1739 | 347.0 |
| C | 9 | 68 | 1200136 | 2973.28 | 1725 | 1731 | 403.1 |
| C | 8 | 229 | 71806 | 173.86 | 1725 | 1731 | 403.1 |
| C | 9 | 54 | 35647 | 84.15 | 1725 | 1731 | 403.1 |
| D | 2 | 152 | 1157148 | 2760.81 | 1696 | 1645 | 418.5 |
| D | 2 | 14 | 551975 | 1314.89 | 1696 | 1645 | 418.5 |
| D | 12 | 233 | 526909 | 1255.0 | 1696 | 1645 | 418.5 |
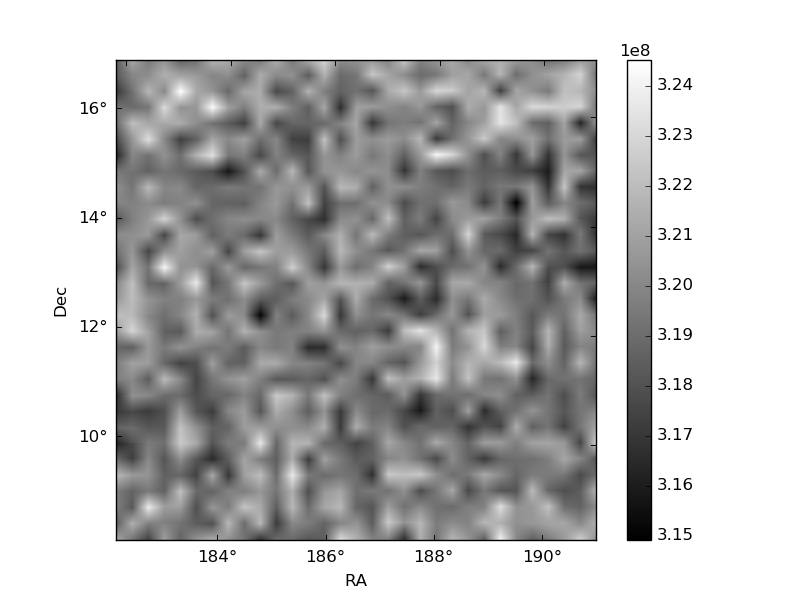
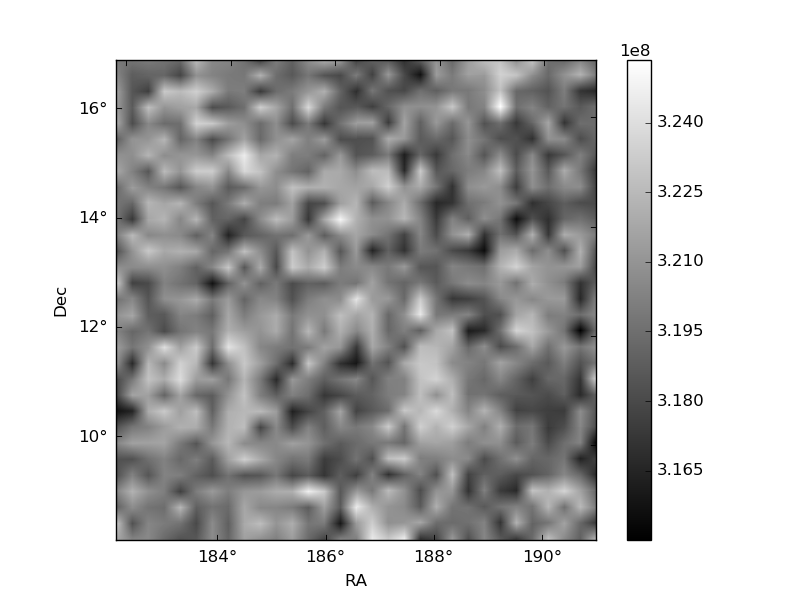
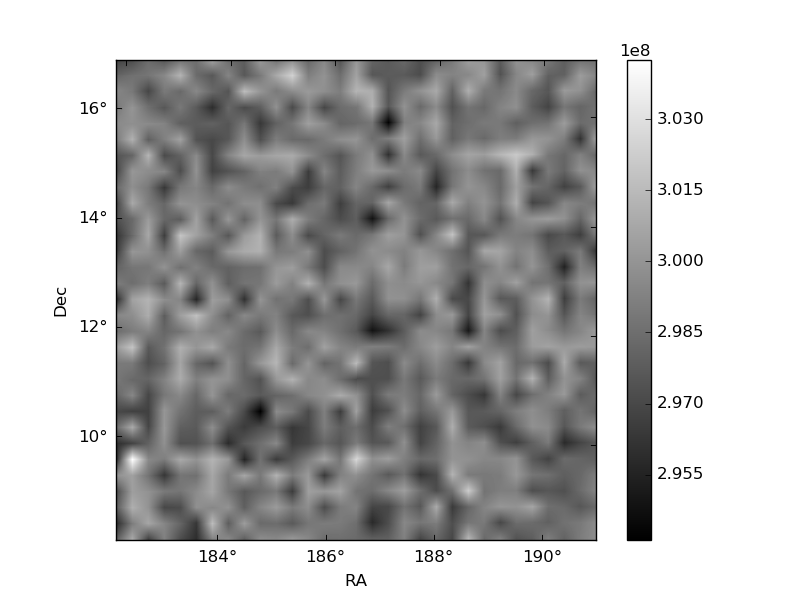
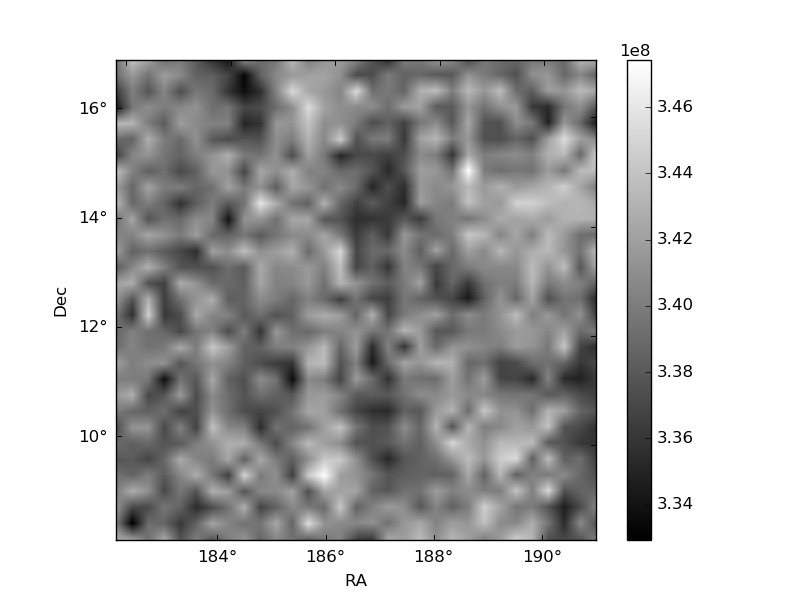
Histogram calculated using DETX and DETY for each event in the final _common_clean file
| Quadrant A |  |
 |
Quadrant B |
|---|---|---|---|
| Quadrant D |  |
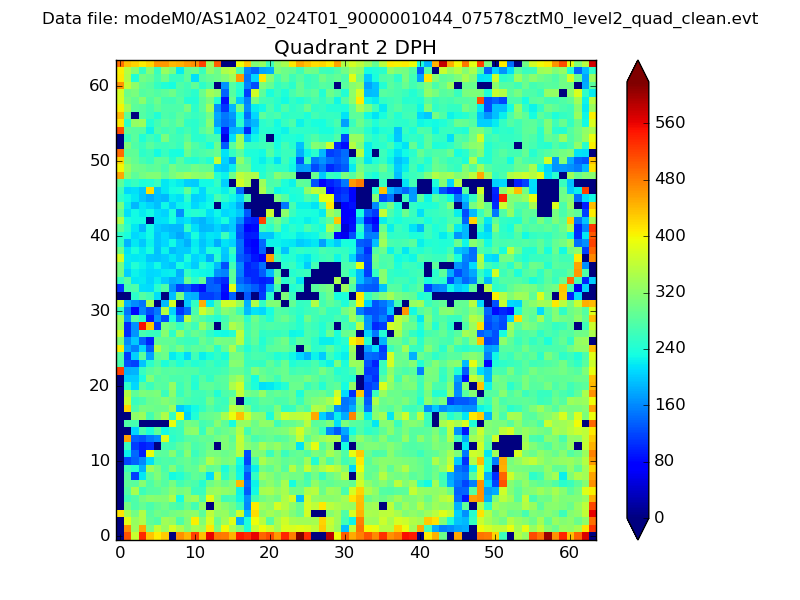 |
Quadrant C |
| Plot type | Count rate plots | Images |
|---|---|---|
| Comparison with Poisson distribution Blue bars denote a histogram of data divided into 1 sec bins. Red curve is a Poisson curve with rate = median count rate of data. |
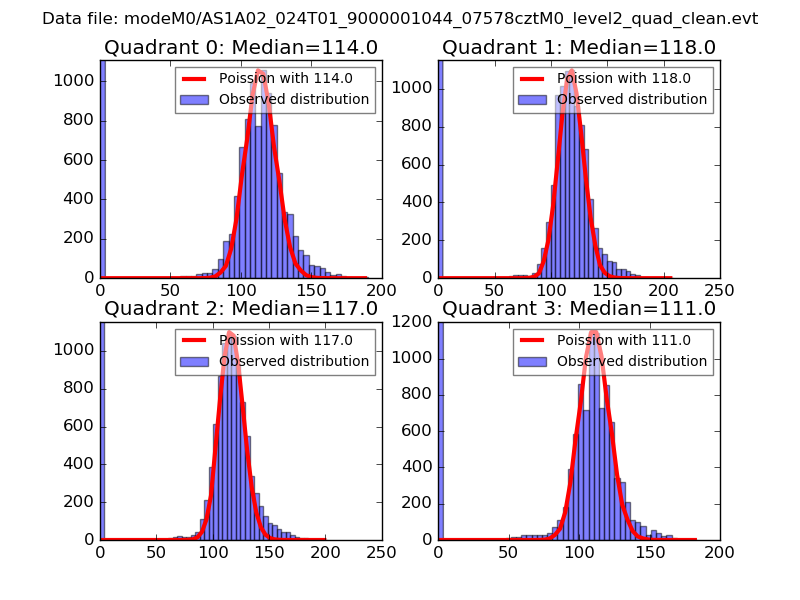 |
 |
| Quadrant-wise count rates Data is divided into 100 sec bins |
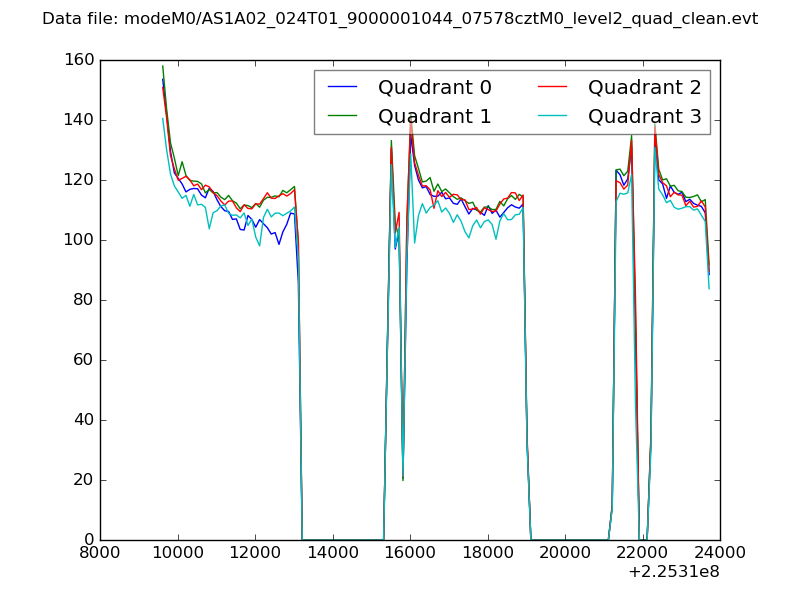 |
|
| Module-wise count rates for Quadrant A Data is divided into 100 sec bins |
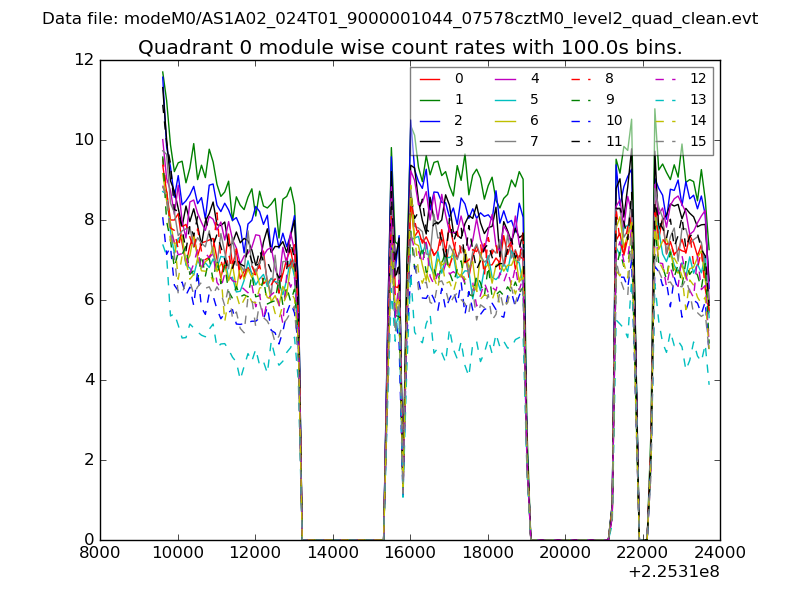 |
 |
| Module-wise count rates for Quadrant B Data is divided into 100 sec bins |
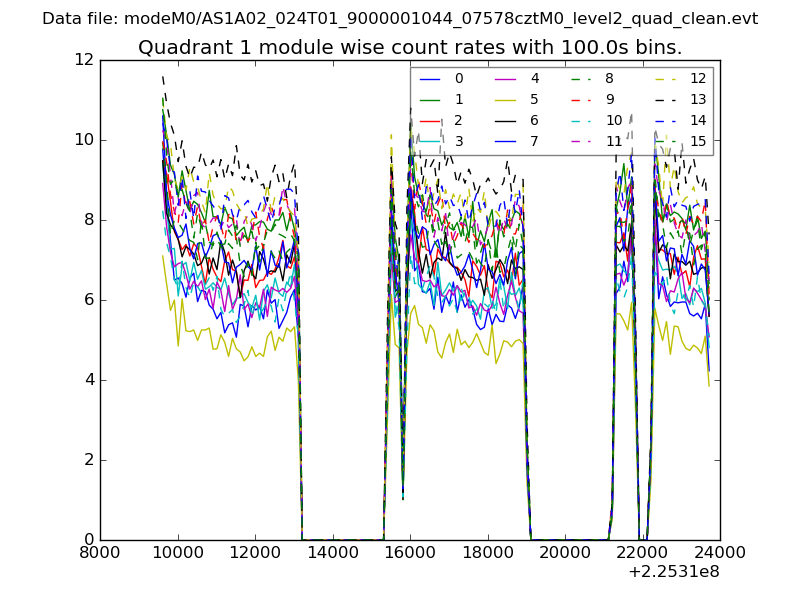 |
 |
| Module-wise count rates for Quadrant C Data is divided into 100 sec bins |
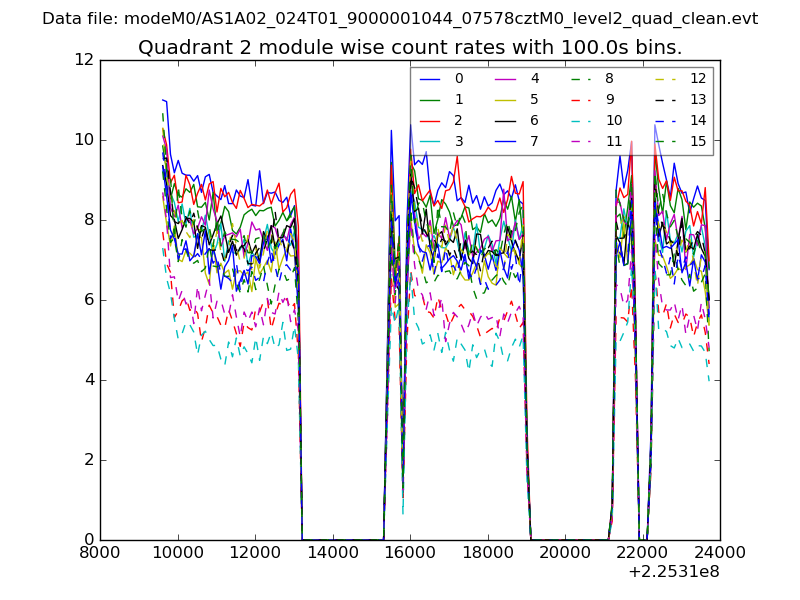 |
 |
| Module-wise count rates for Quadrant D Data is divided into 100 sec bins |
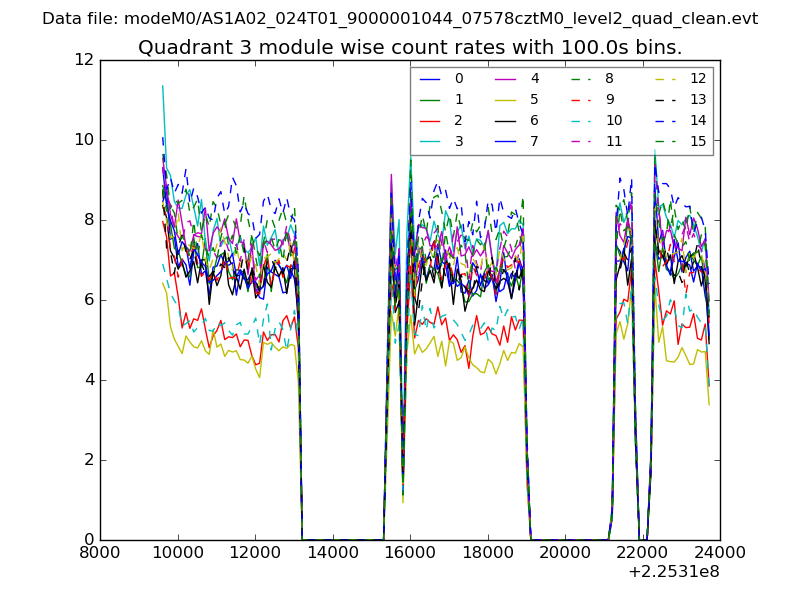 |
 |
| Parameter | Plot |
|---|---|
| CZT HV Monitor | 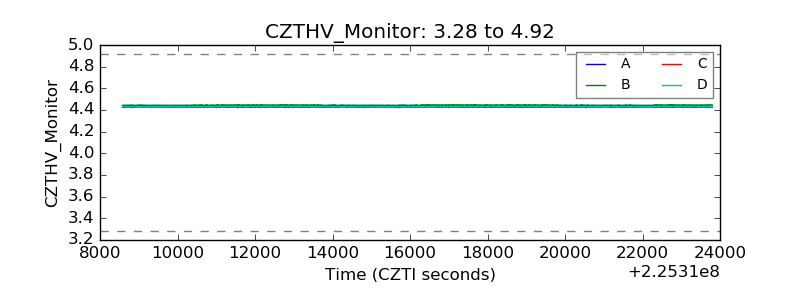 |
| D_VDD | 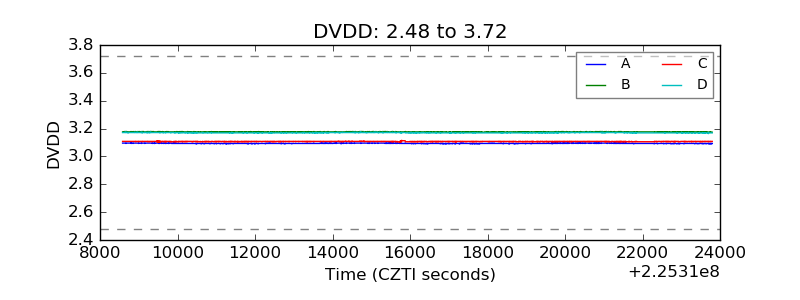 |
| Temperature 1 | 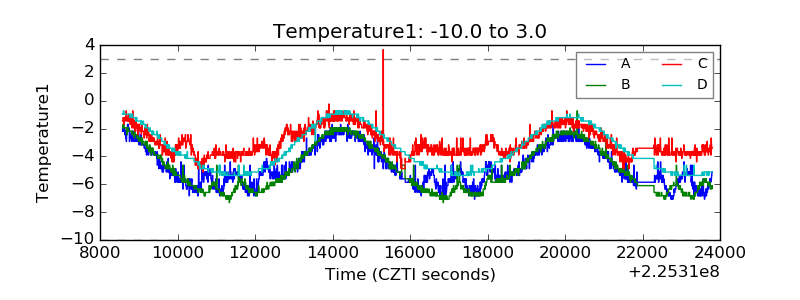 |
| Veto HV Monitor | 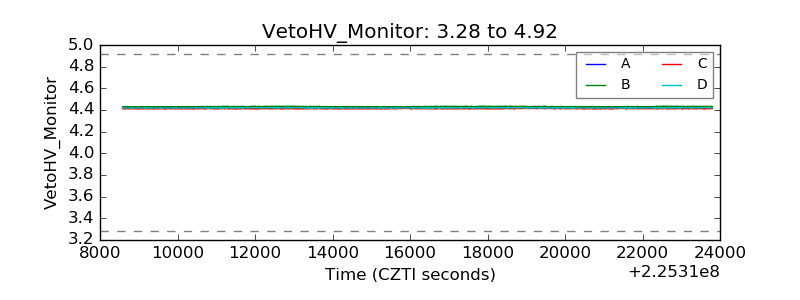 |
| Veto LLD | 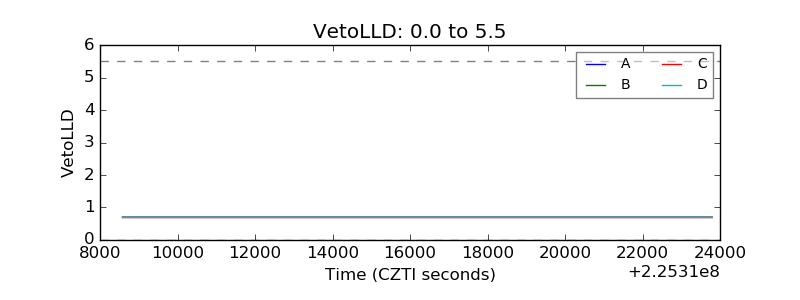 |
| Alpha Counter | 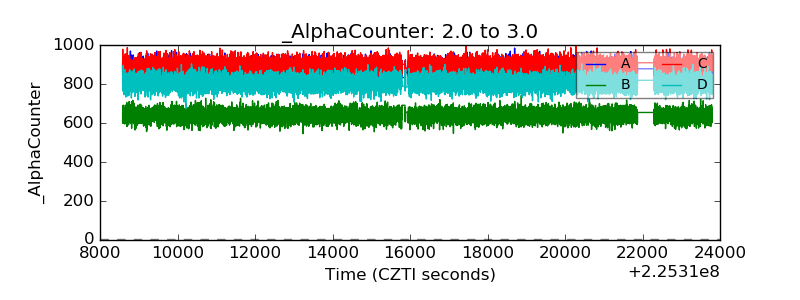 |
| _CPM_Rate | 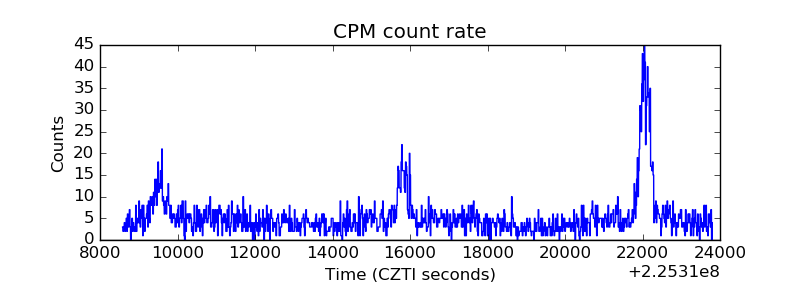 |
| CZT Counter | 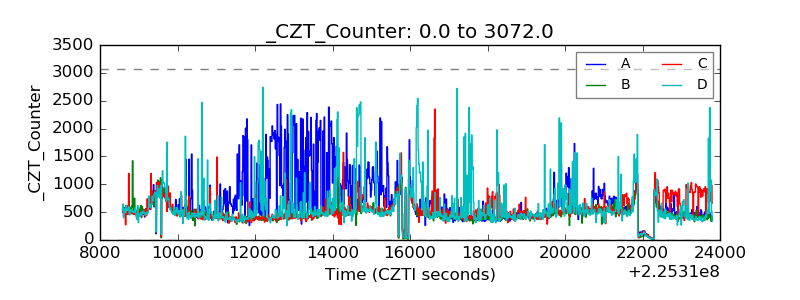 |
| +2.5 Volts monitor |  |
| +5 Volts monitor |  |
| _ROLL_ROT | 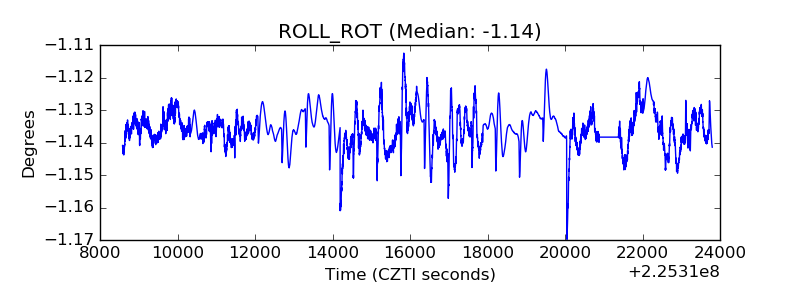 |
| _Roll_DEC | 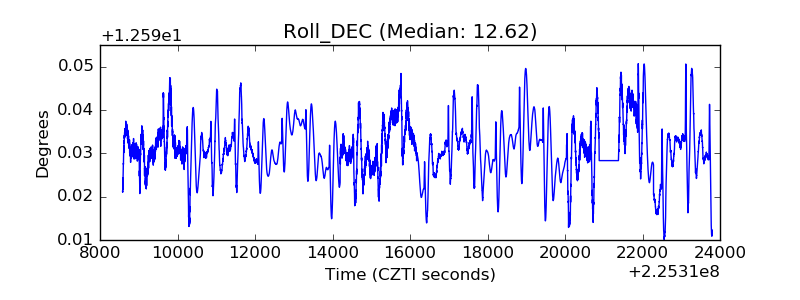 |
| _Roll_RA | 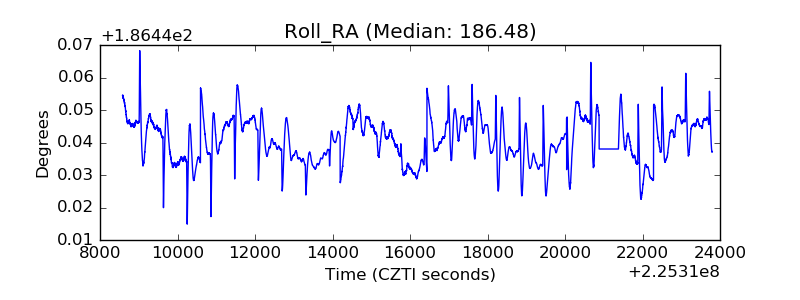 |
| Veto Counter | 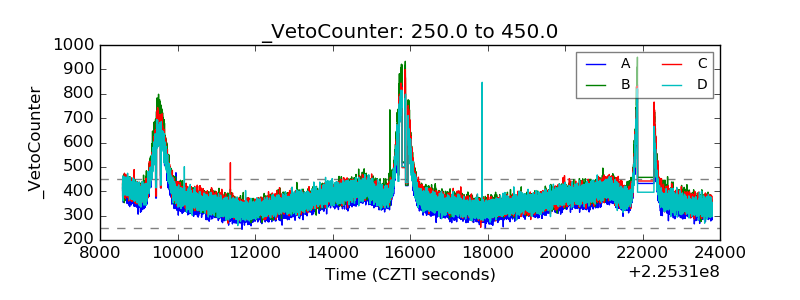 |