| Param | Original file | Final file |
|---|---|---|
| Filename | modeM0/AS1A02_024T01_9000001044_07581cztM0_level2.evt | modeM0/AS1A02_024T01_9000001044_07581cztM0_level2_quad_clean.evt |
| Size (bytes) | 2,075,385,600 | 328,752,000 |
| Size | 1.9 GB | 313.5 MB |
| Events in quadrant A | 15,667,881 | 1,998,523 |
| Events in quadrant B | 13,410,426 | 2,049,527 |
| Events in quadrant C | 14,607,057 | 2,020,942 |
| Events in quadrant D | 17,251,947 | 1,935,946 |
| Mode SS | |||
|---|---|---|---|
| Quadrant | BADHDUFLAG | Total packets | Discarded packets |
| A | 0 | 578 | 0 |
| B | 0 | 578 | 0 |
| C | 0 | 578 | 0 |
| D | 0 | 578 | 0 |
| Mode M0 | |||
|---|---|---|---|
| Quadrant | BADHDUFLAG | Total packets | Discarded packets |
| A | 0 | 65508 | 6 |
| B | 0 | 58592 | 5 |
| C | 0 | 62332 | 5 |
| D | 0 | 70601 | 5 |
| Mode M9 | |||
|---|---|---|---|
| Quadrant | BADHDUFLAG | Total packets | Discarded packets |
| A | 0 | 38 | 0 |
| B | 0 | 38 | 0 |
| C | 0 | 38 | 0 |
| D | 0 | 38 | 0 |
| Quadrant | Total seconds | Saturated seconds | Saturation percentage |
|---|---|---|---|
| A | 28388 | 573 | 2.018459% |
| B | 28388 | 330 | 1.162463% |
| C | 28388 | 346 | 1.218825% |
| D | 28388 | 994 | 3.501479% |
Noise dominated data is calculated using 1-second bins in cleaned event files. If a bin has >2000 counts, and if more than 50% of those come from <1% of pixels, then it is considered to be noise-dominated and hence unusable.
| Quadrant | # 1 sec bins | Bins with >0 counts | Bins with >2000 counts | High rate bins dominated by noise | Noise dominated (total time) | Noise dominated (detector-on time) | Marked lightcurve |
|---|---|---|---|---|---|---|---|
| A | 32238 | 28390 | 197 | 197 | 0.61% | 0.69% | 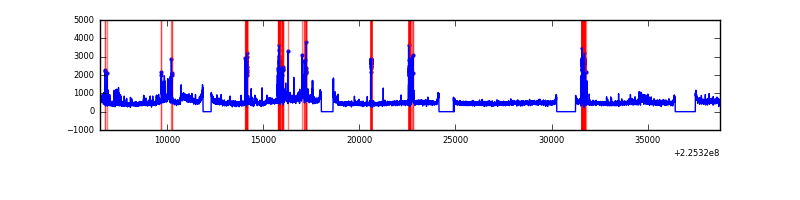 |
| B | 32238 | 28393 | 3 | 3 | 0.01% | 0.01% | 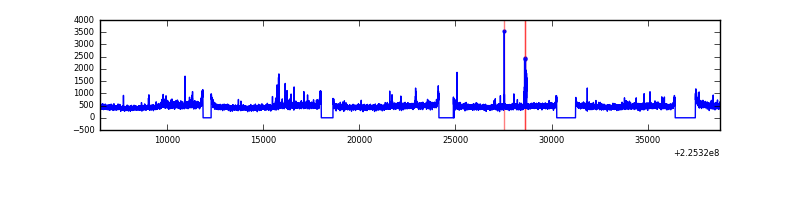 |
| C | 32238 | 28393 | 78 | 78 | 0.24% | 0.27% | 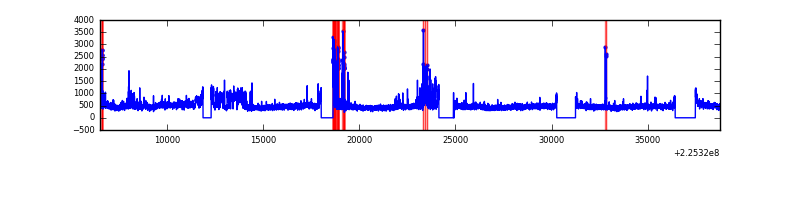 |
| D | 32238 | 28391 | 625 | 625 | 1.94% | 2.20% | 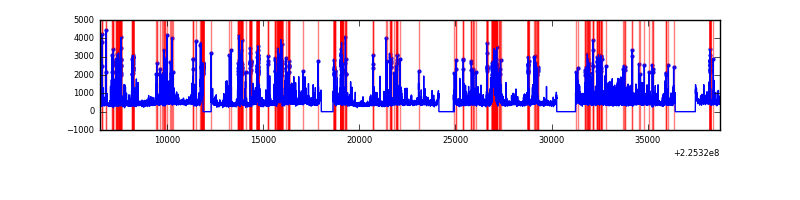 |
Top three noisy pixels from each quadrant. If the there are fewer than three noisy pixels in the level2.evt file, extra rows are filled as -1
| Pixel properties | Quadrant properties | ||||||
|---|---|---|---|---|---|---|---|
| Quadrant | DetID | PixID | Counts | Sigma | Mean | Median | Sigma |
| A | 15 | 239 | 2054464 | 3032.48 | 3346 | 3277 | 676.4 |
| A | 0 | 128 | 718513 | 1057.41 | 3346 | 3277 | 676.4 |
| A | 3 | 1 | 40727 | 55.37 | 3346 | 3277 | 676.4 |
| B | 0 | 219 | 149661 | 228.56 | 3373 | 3285 | 640.4 |
| B | 0 | 214 | 118651 | 180.14 | 3373 | 3285 | 640.4 |
| B | 12 | 111 | 69603 | 103.55 | 3373 | 3285 | 640.4 |
| C | 9 | 68 | 1488631 | 1961.15 | 3262 | 3272 | 757.4 |
| C | 8 | 229 | 240530 | 313.26 | 3262 | 3272 | 757.4 |
| C | 1 | 16 | 111839 | 143.34 | 3262 | 3272 | 757.4 |
| D | 2 | 152 | 2643258 | 3326.72 | 3238 | 3134 | 793.6 |
| D | 2 | 14 | 966902 | 1214.41 | 3238 | 3134 | 793.6 |
| D | 5 | 233 | 625160 | 783.79 | 3238 | 3134 | 793.6 |
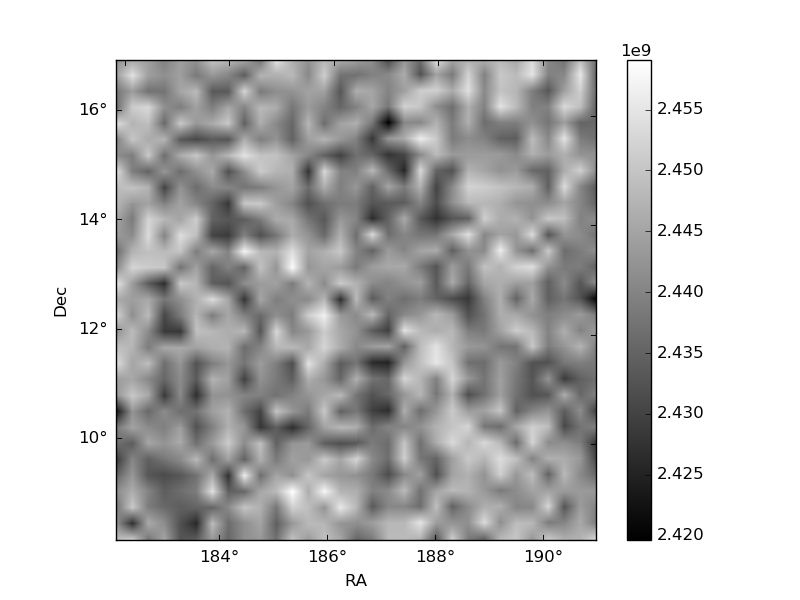
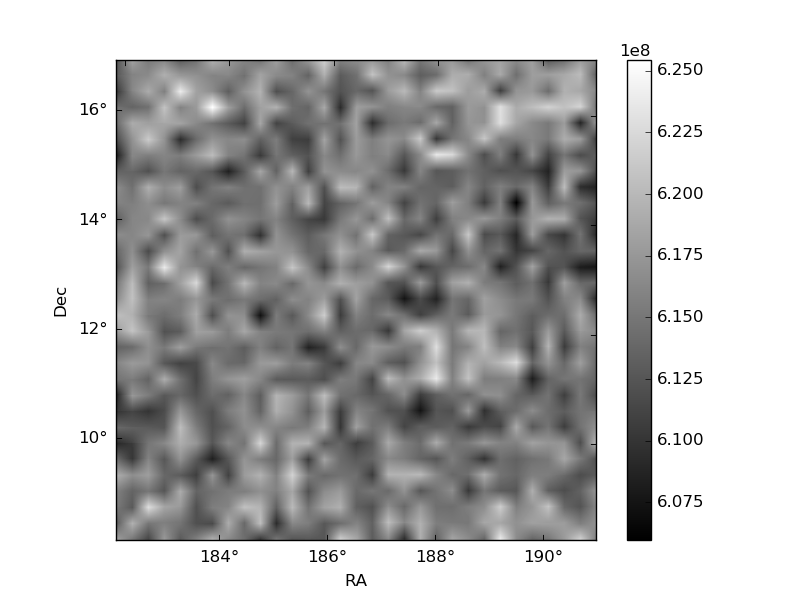
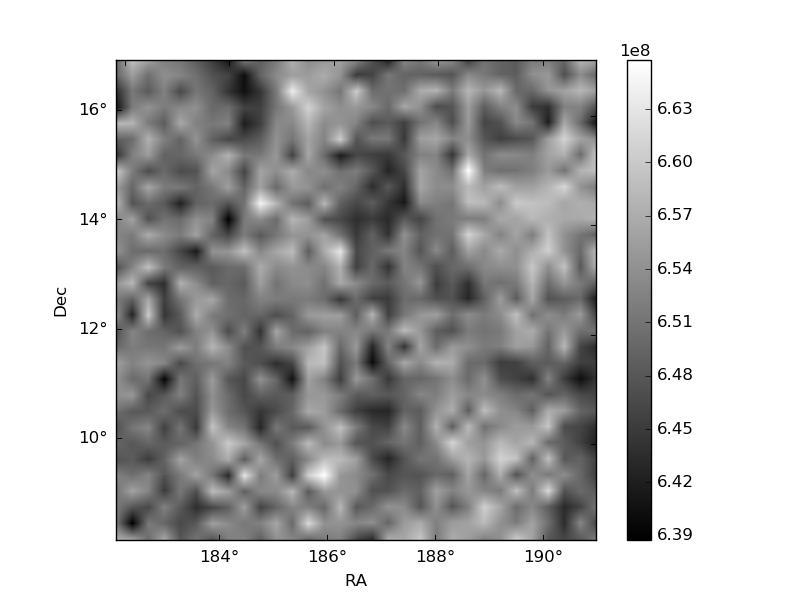
Histogram calculated using DETX and DETY for each event in the final _common_clean file
| Quadrant A | 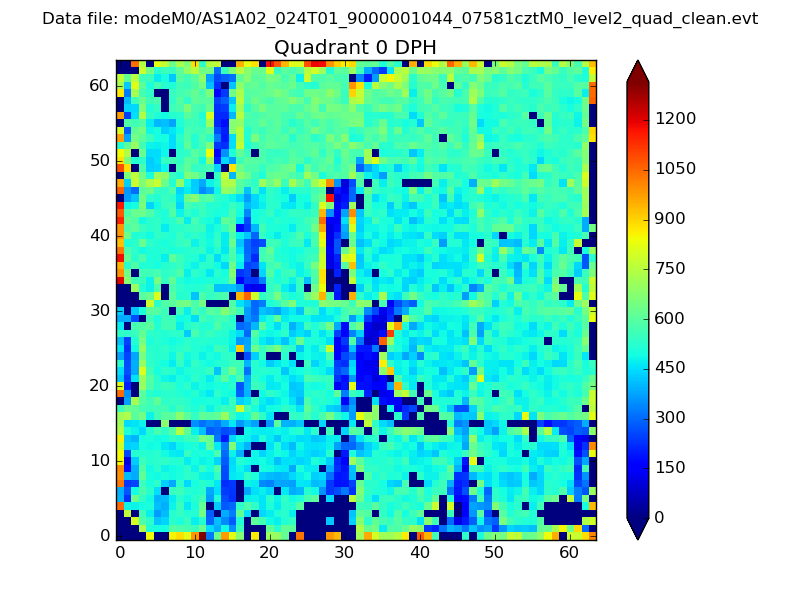 |
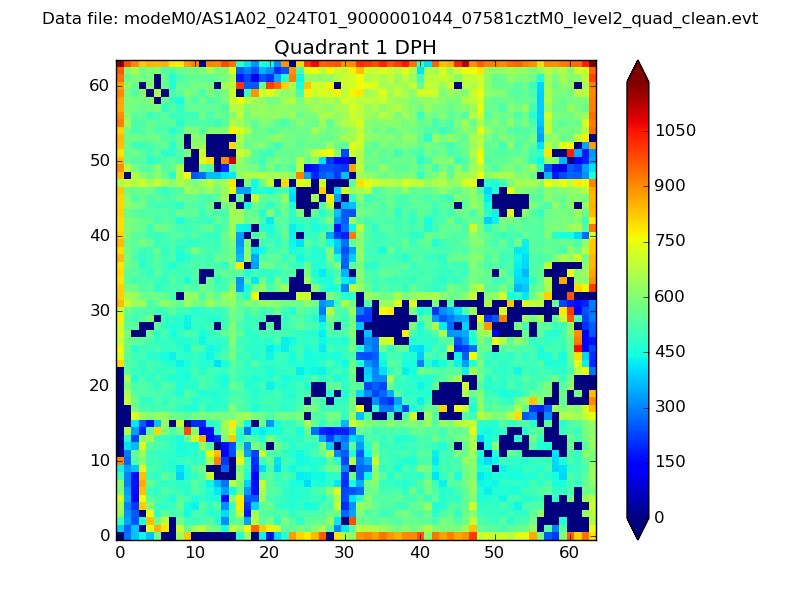 |
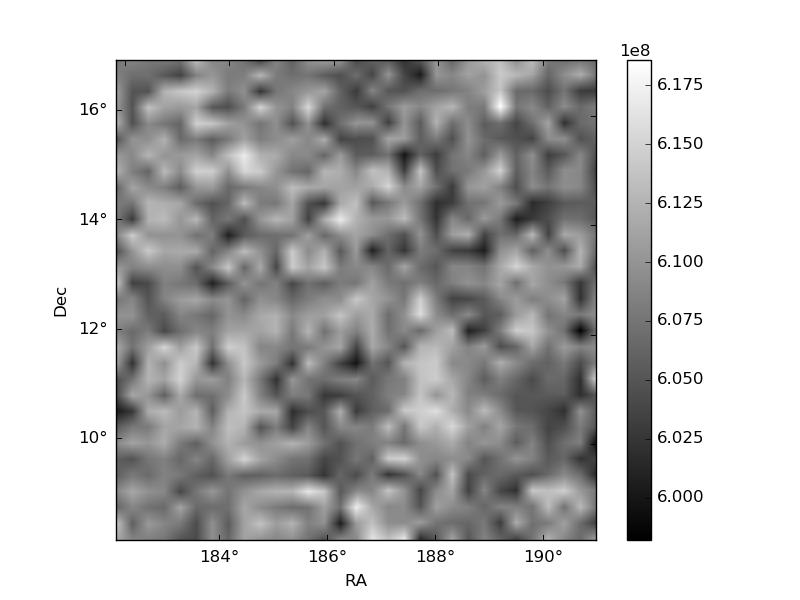
Quadrant B |
|---|---|---|---|
| Quadrant D | 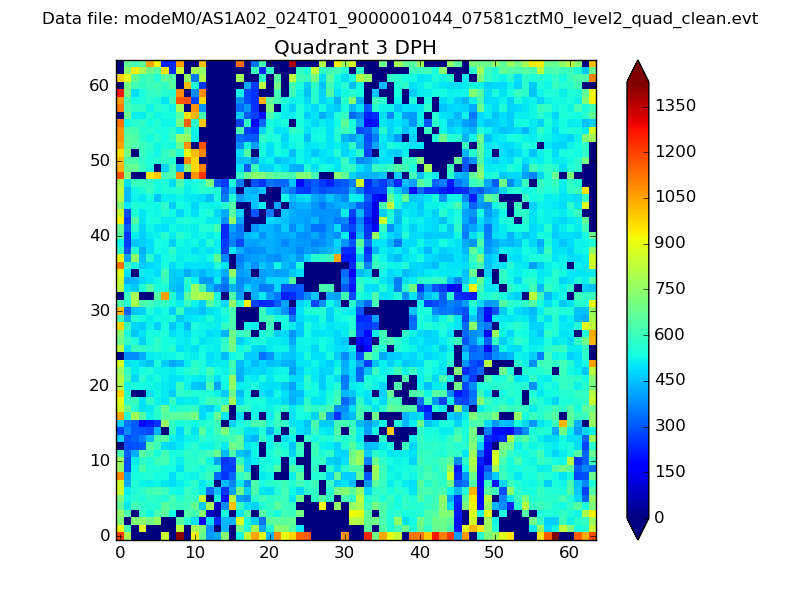 |
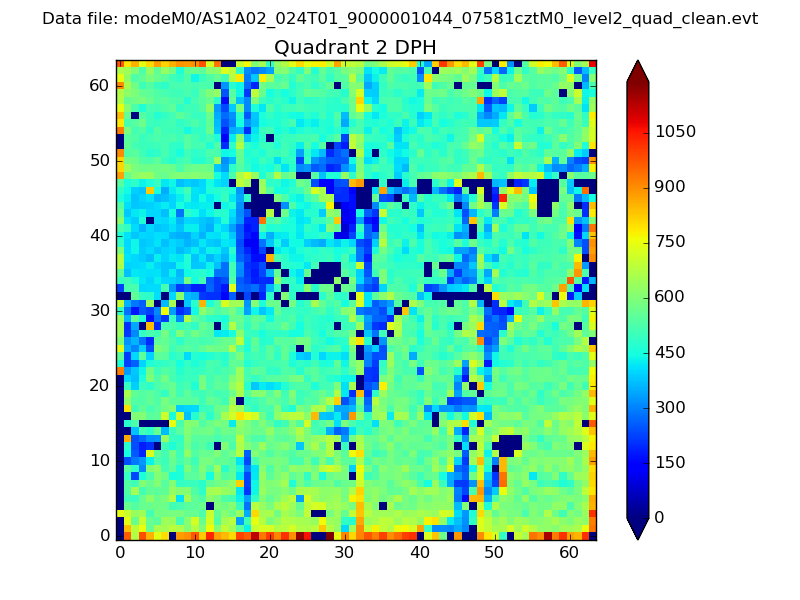 |
Quadrant C |
| Plot type | Count rate plots | Images |
|---|---|---|
| Comparison with Poisson distribution Blue bars denote a histogram of data divided into 1 sec bins. Red curve is a Poisson curve with rate = median count rate of data. |
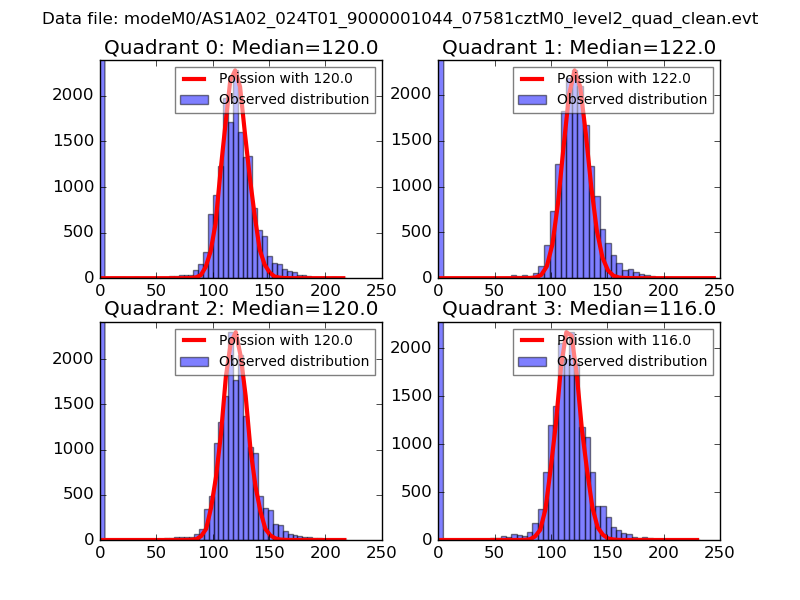 |
 |
| Quadrant-wise count rates Data is divided into 100 sec bins |
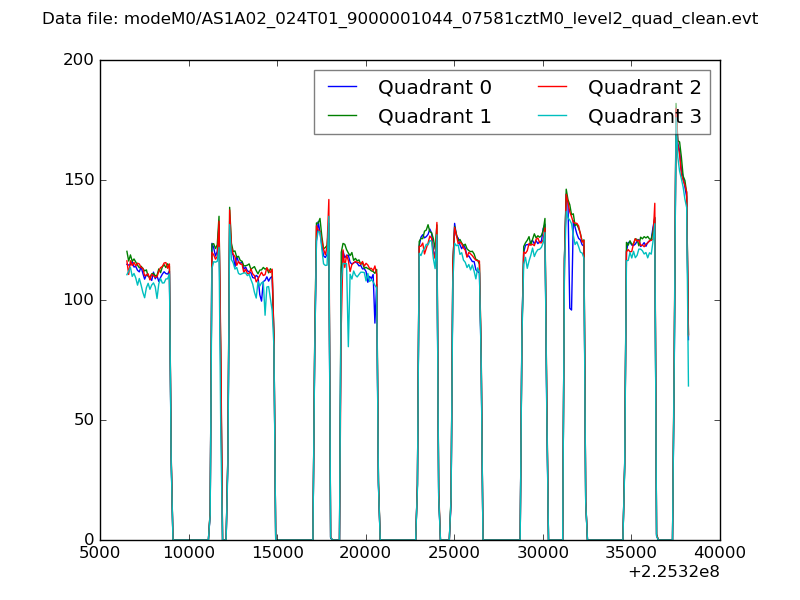 |
|
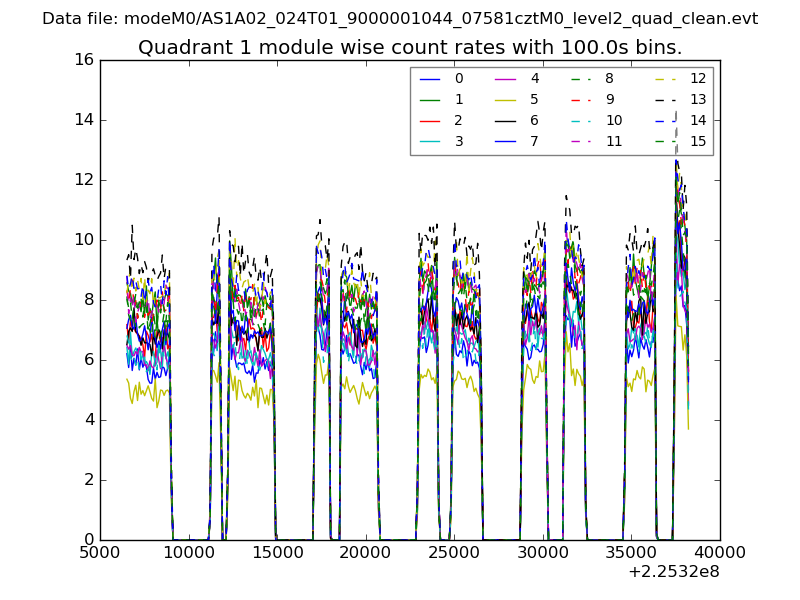
| Module-wise count rates for Quadrant A Data is divided into 100 sec bins |
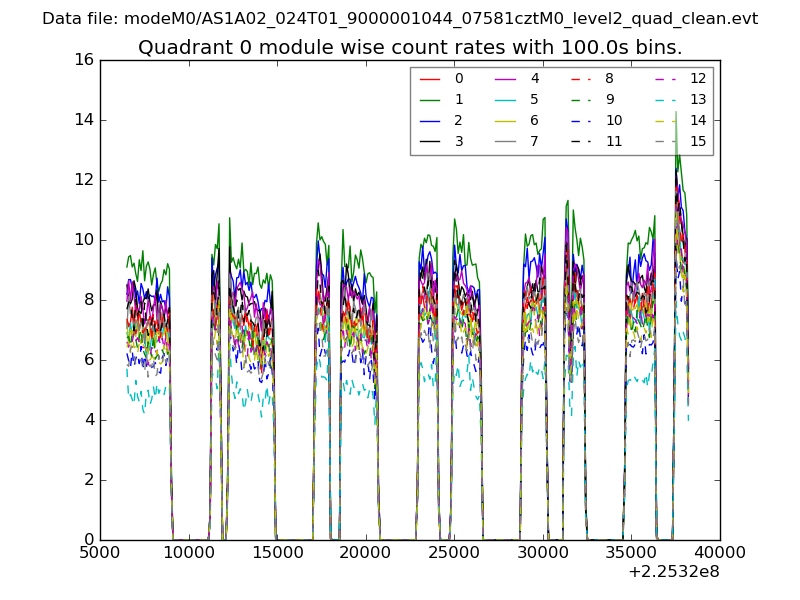 |
 |
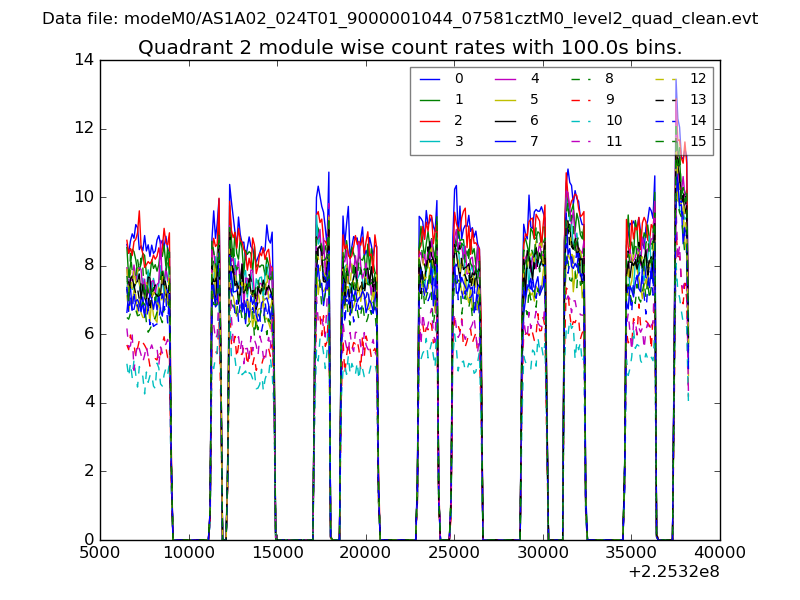
| Module-wise count rates for Quadrant B Data is divided into 100 sec bins |
 |
 |
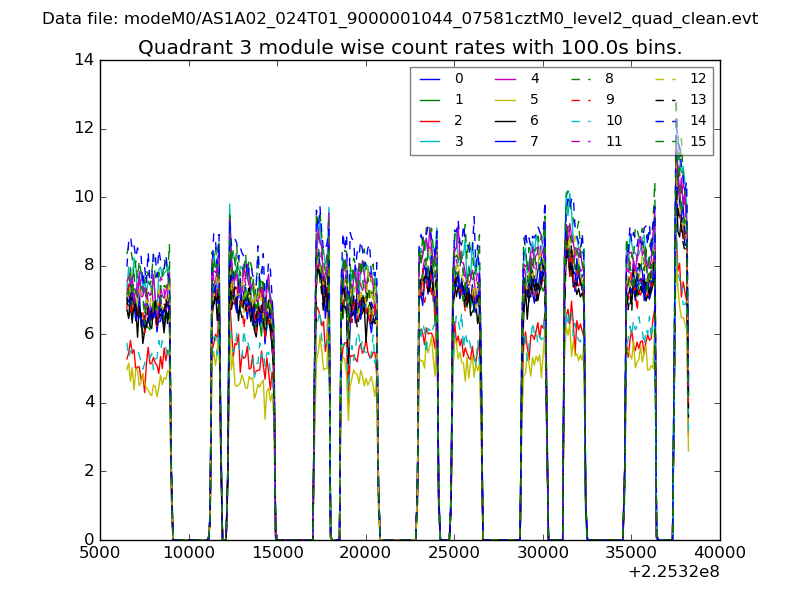
| Module-wise count rates for Quadrant C Data is divided into 100 sec bins |
 |
 |
| Module-wise count rates for Quadrant D Data is divided into 100 sec bins |
 |
 |
| Parameter | Plot |
|---|---|
| CZT HV Monitor | 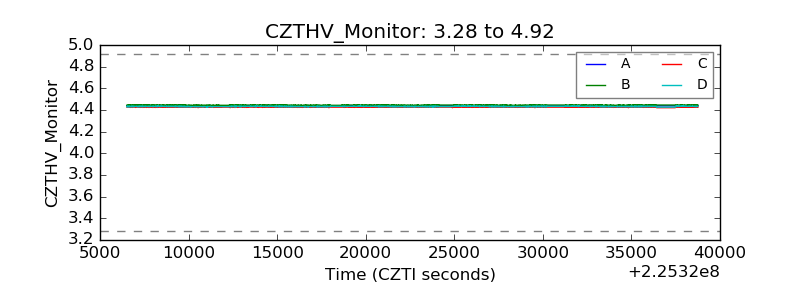 |
| D_VDD | 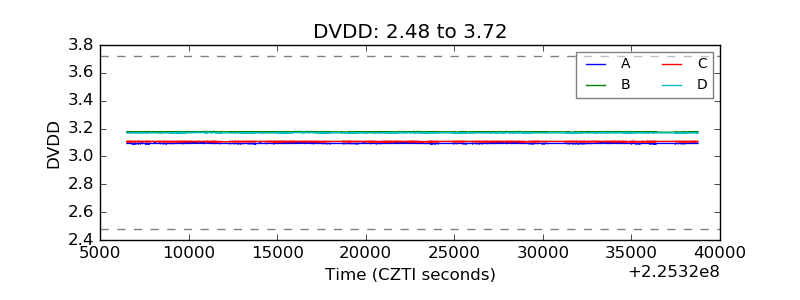 |
| Temperature 1 |  |
| Veto HV Monitor | 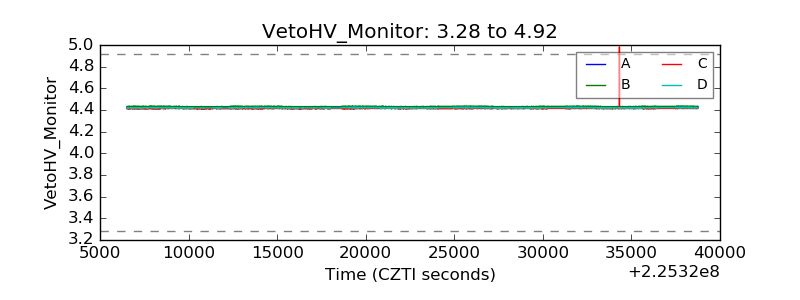 |
| Veto LLD | 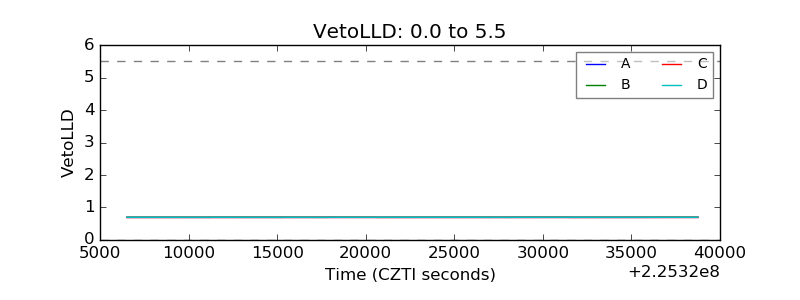 |
| Alpha Counter | 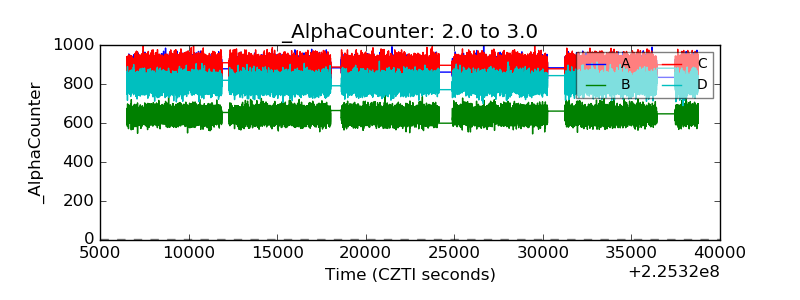 |
| _CPM_Rate | 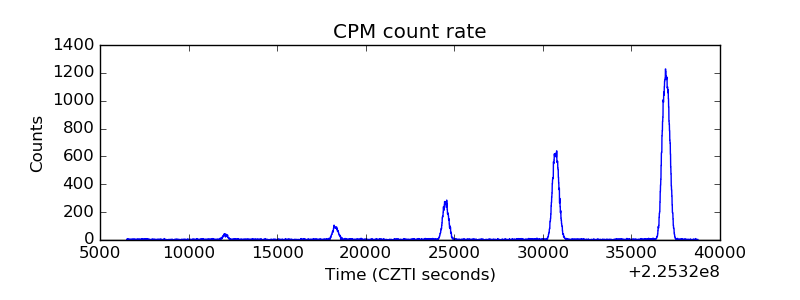 |
| CZT Counter | 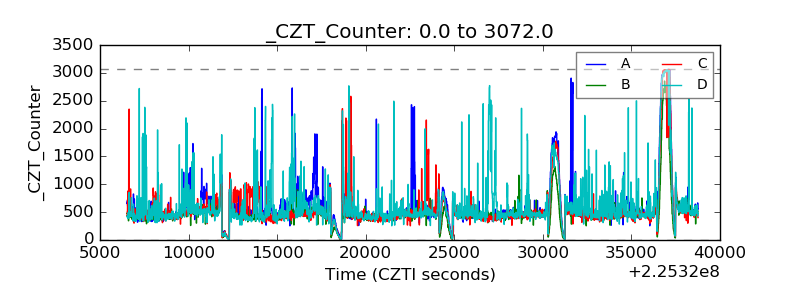 |
| +2.5 Volts monitor |  |
| +5 Volts monitor |  |
| _ROLL_ROT | 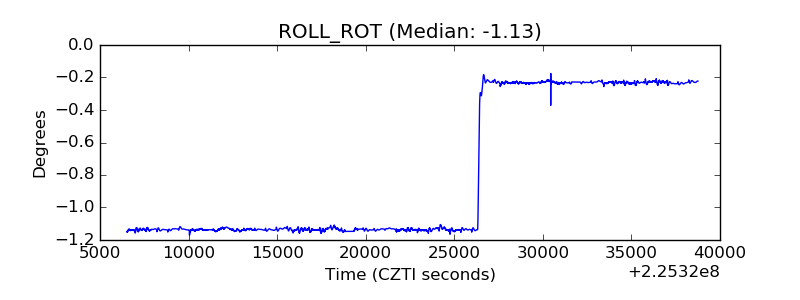 |
| _Roll_DEC |  |
| _Roll_RA | 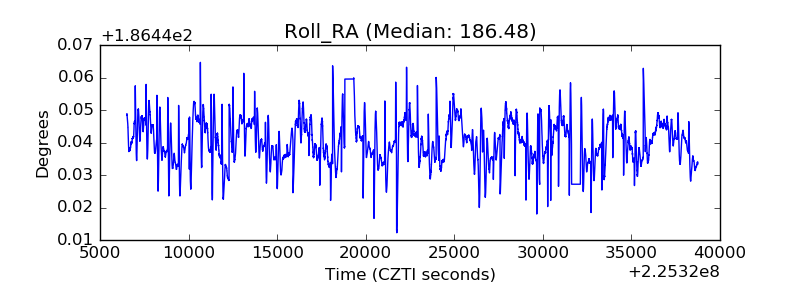 |
| Veto Counter |  |