| Param | Original file | Final file |
|---|---|---|
| Filename | modeM0/AS1A02_024T01_9000001044_07583cztM0_level2.evt | modeM0/AS1A02_024T01_9000001044_07583cztM0_level2_quad_clean.evt |
| Size (bytes) | 479,217,600 | 64,100,160 |
| Size | 457.0 MB | 61.1 MB |
| Events in quadrant A | 3,380,389 | 375,004 |
| Events in quadrant B | 3,391,107 | 381,366 |
| Events in quadrant C | 3,356,408 | 375,204 |
| Events in quadrant D | 3,947,648 | 359,440 |
| Mode SS | |||
|---|---|---|---|
| Quadrant | BADHDUFLAG | Total packets | Discarded packets |
| A | 0 | 132 | 0 |
| B | 0 | 132 | 0 |
| C | 0 | 132 | 0 |
| D | 0 | 132 | 0 |
| Mode M0 | |||
|---|---|---|---|
| Quadrant | BADHDUFLAG | Total packets | Discarded packets |
| A | 0 | 13976 | 3 |
| B | 0 | 14012 | 2 |
| C | 0 | 14010 | 2 |
| D | 0 | 15932 | 2 |
| Mode M9 | |||
|---|---|---|---|
| Quadrant | BADHDUFLAG | Total packets | Discarded packets |
| A | 0 | 14 | 0 |
| B | 0 | 14 | 0 |
| C | 0 | 14 | 0 |
| D | 0 | 15 | 0 |
| Quadrant | Total seconds | Saturated seconds | Saturation percentage |
|---|---|---|---|
| A | 6443 | 85 | 1.319261% |
| B | 6443 | 82 | 1.272699% |
| C | 6443 | 63 | 0.977805% |
| D | 6443 | 174 | 2.700605% |
Noise dominated data is calculated using 1-second bins in cleaned event files. If a bin has >2000 counts, and if more than 50% of those come from <1% of pixels, then it is considered to be noise-dominated and hence unusable.
| Quadrant | # 1 sec bins | Bins with >0 counts | Bins with >2000 counts | High rate bins dominated by noise | Noise dominated (total time) | Noise dominated (detector-on time) | Marked lightcurve |
|---|---|---|---|---|---|---|---|
| A | 7738 | 6443 | 0 | 0 | 0.00% | 0.00% | 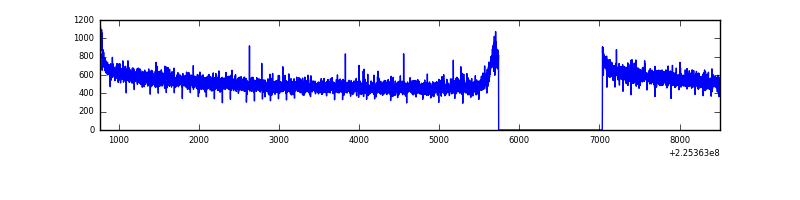 |
| B | 7738 | 6443 | 0 | 0 | 0.00% | 0.00% | 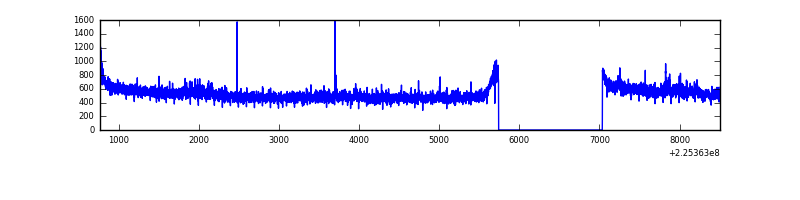 |
| C | 7738 | 6443 | 0 | 0 | 0.00% | 0.00% | 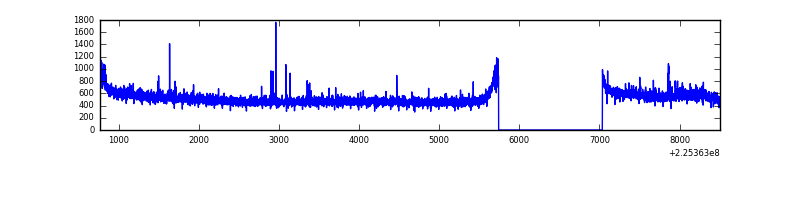 |
| D | 7738 | 6443 | 62 | 62 | 0.80% | 0.96% | 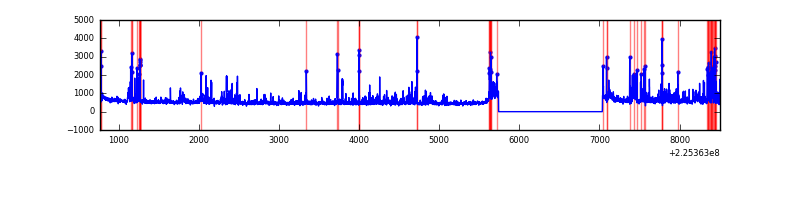 |
Top three noisy pixels from each quadrant. If the there are fewer than three noisy pixels in the level2.evt file, extra rows are filled as -1
| Pixel properties | Quadrant properties | ||||||
|---|---|---|---|---|---|---|---|
| Quadrant | DetID | PixID | Counts | Sigma | Mean | Median | Sigma |
| A | 15 | 239 | 41947 | 238.78 | 865 | 850 | 172.1 |
| A | 3 | 1 | 10766 | 57.61 | 865 | 850 | 172.1 |
| A | 0 | 226 | 8198 | 42.69 | 865 | 850 | 172.1 |
| B | 0 | 214 | 31970 | 192.09 | 861 | 843 | 162.0 |
| B | 12 | 111 | 16197 | 94.75 | 861 | 843 | 162.0 |
| B | 11 | 111 | 13294 | 76.84 | 861 | 843 | 162.0 |
| C | 9 | 68 | 48334 | 248.15 | 839 | 846 | 191.4 |
| C | 1 | 16 | 22047 | 110.79 | 839 | 846 | 191.4 |
| C | 8 | 229 | 16246 | 80.47 | 839 | 846 | 191.4 |
| D | 2 | 152 | 470776 | 2292.44 | 839 | 815 | 205.0 |
| D | 2 | 14 | 148090 | 718.4 | 839 | 815 | 205.0 |
| D | 5 | 233 | 82983 | 400.81 | 839 | 815 | 205.0 |
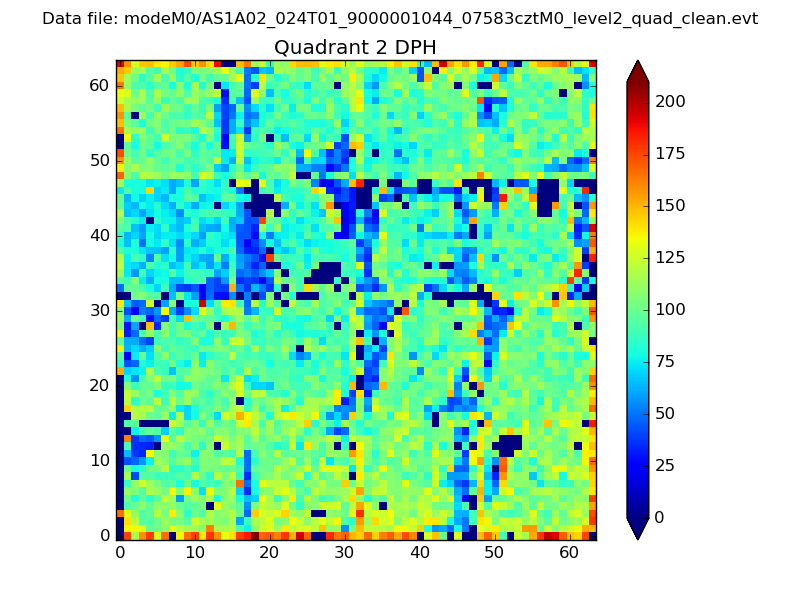
Histogram calculated using DETX and DETY for each event in the final _common_clean file
| Quadrant A | 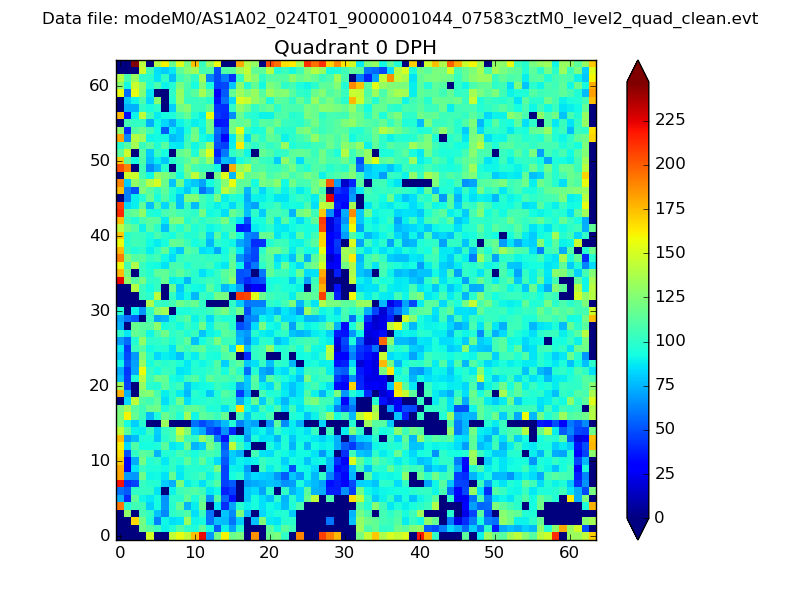 |
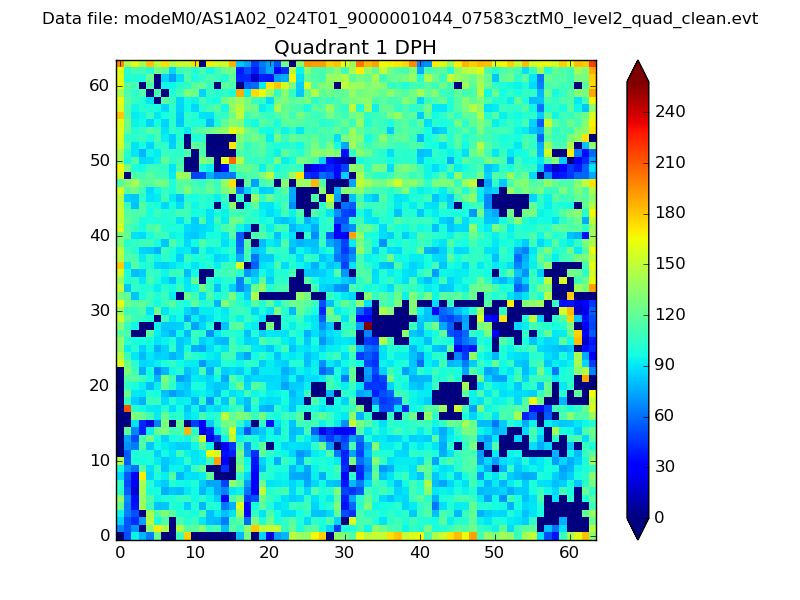 |
Quadrant B |
|---|---|---|---|
| Quadrant D | 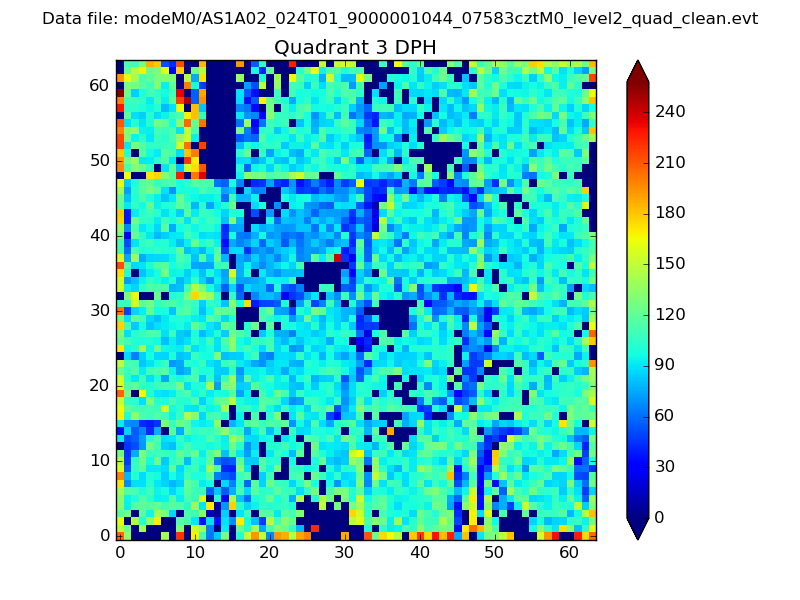 |
 |
Quadrant C |
| Plot type | Count rate plots | Images |
|---|---|---|
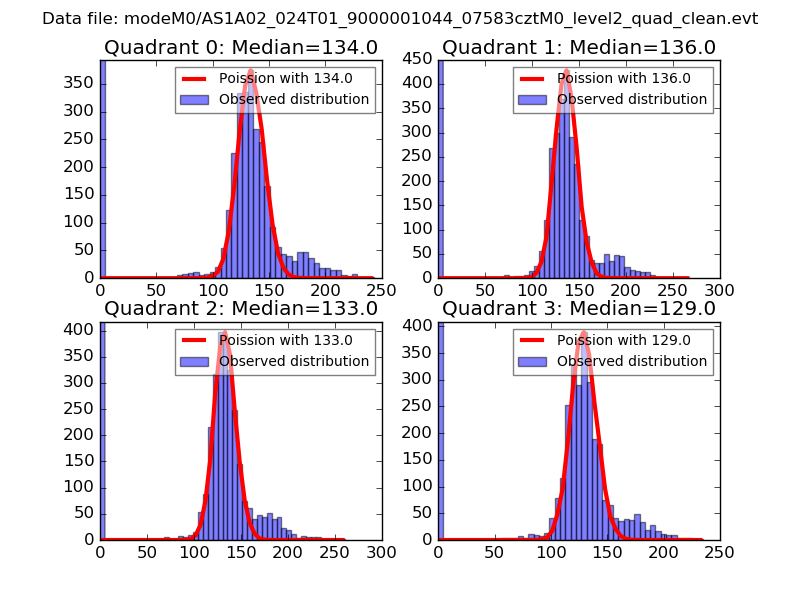
| Comparison with Poisson distribution Blue bars denote a histogram of data divided into 1 sec bins. Red curve is a Poisson curve with rate = median count rate of data. |
 |
 |
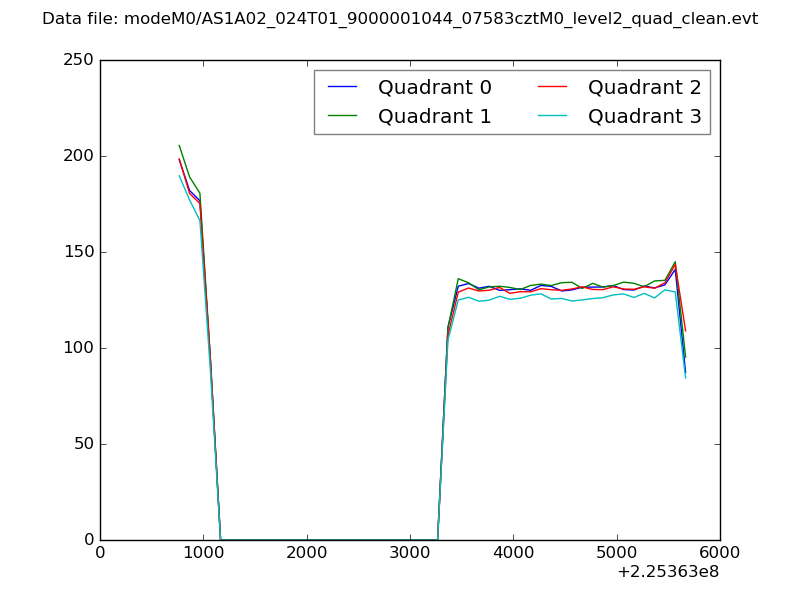
| Quadrant-wise count rates Data is divided into 100 sec bins |
 |
|
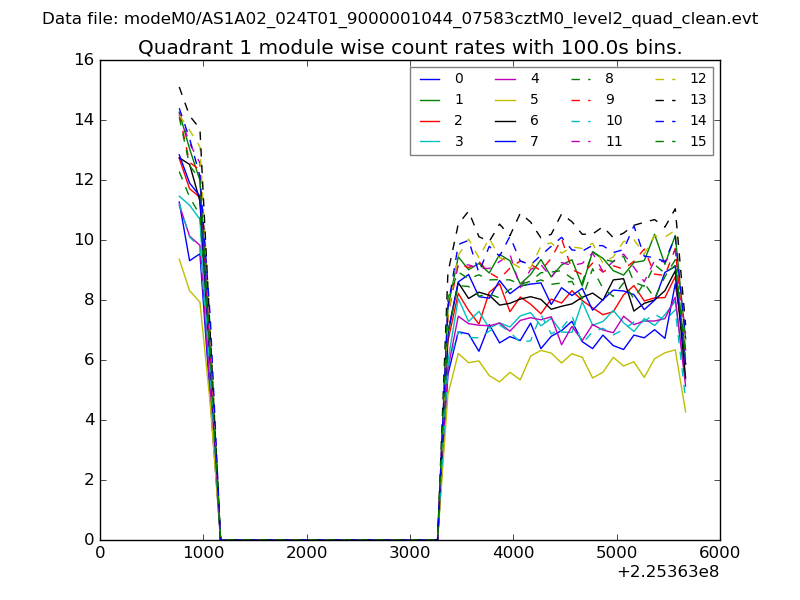
| Module-wise count rates for Quadrant A Data is divided into 100 sec bins |
 |
 |
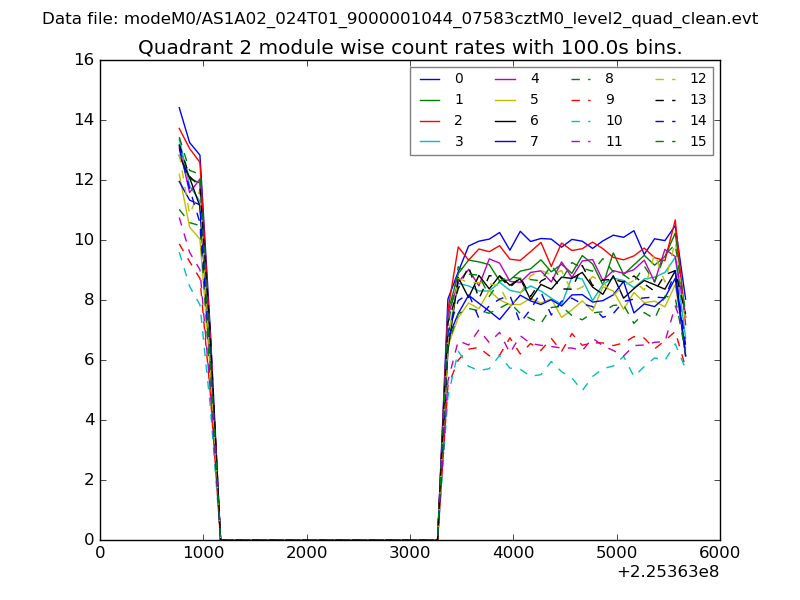
| Module-wise count rates for Quadrant B Data is divided into 100 sec bins |
 |
 |
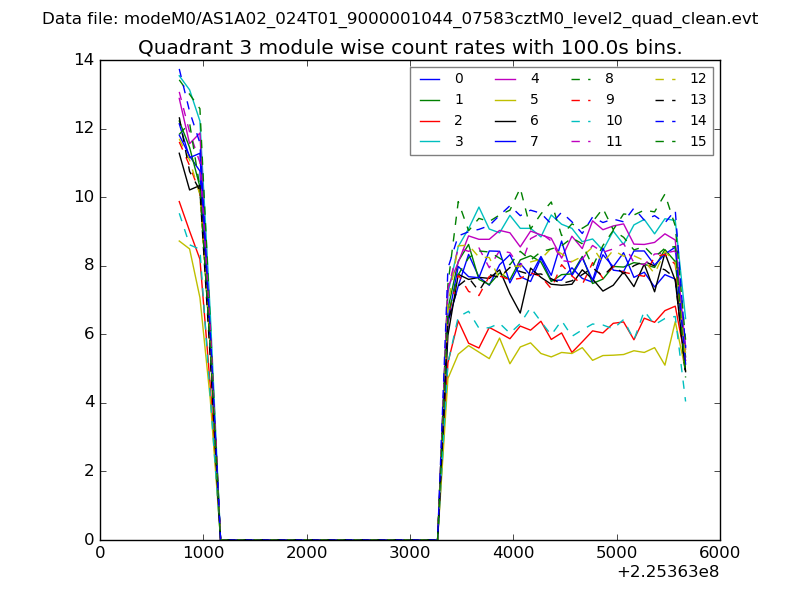
| Module-wise count rates for Quadrant C Data is divided into 100 sec bins |
 |
 |
| Module-wise count rates for Quadrant D Data is divided into 100 sec bins |
 |
 |
| Parameter | Plot |
|---|---|
| CZT HV Monitor |  |
| D_VDD | 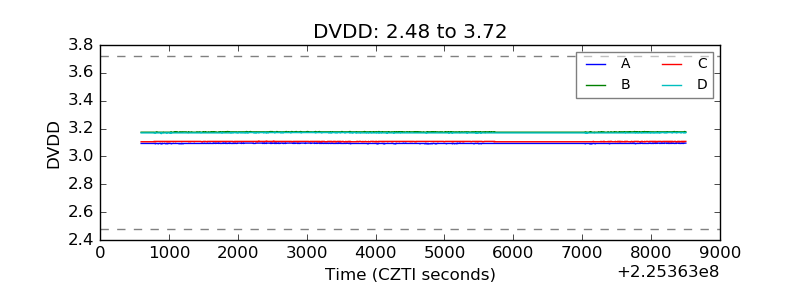 |
| Temperature 1 |  |
| Veto HV Monitor | 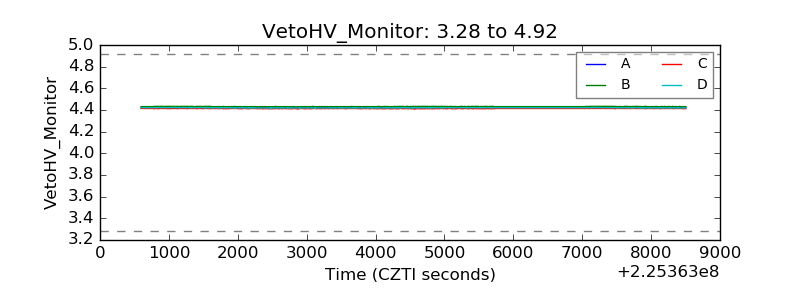 |
| Veto LLD | 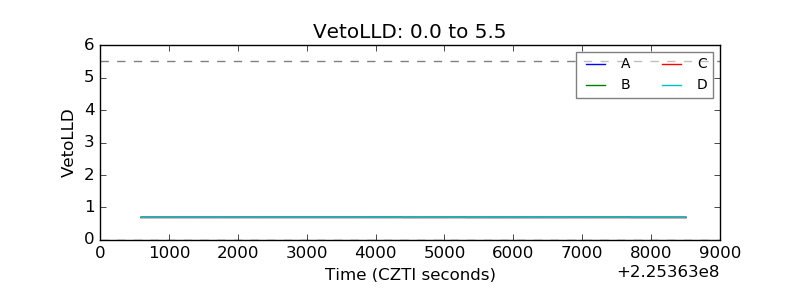 |
| Alpha Counter | 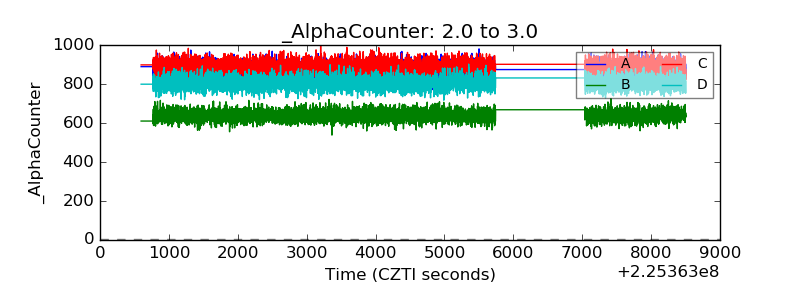 |
| _CPM_Rate | 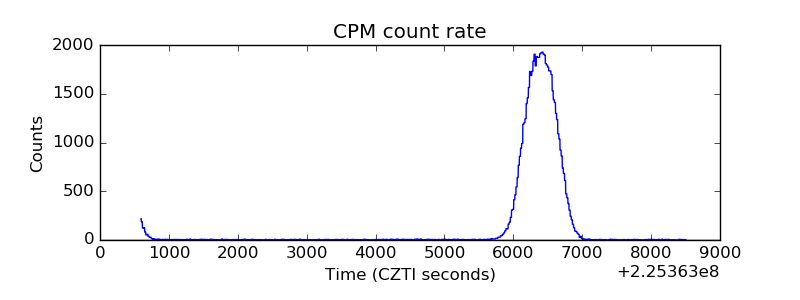 |
| CZT Counter | 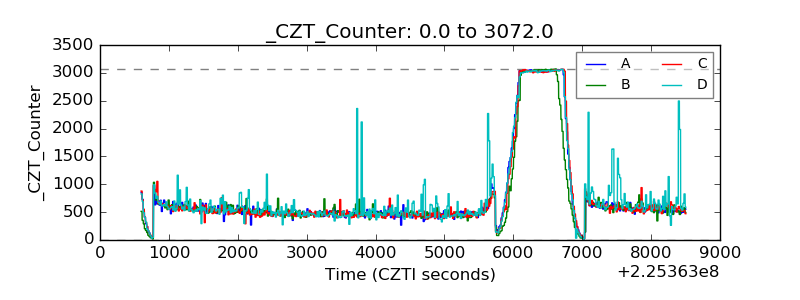 |
| +2.5 Volts monitor |  |
| +5 Volts monitor |  |
| _ROLL_ROT | 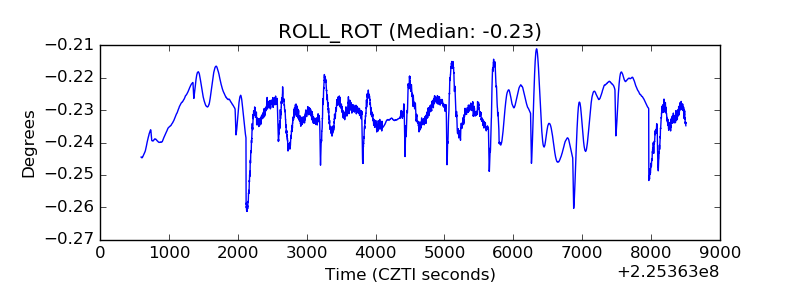 |
| _Roll_DEC | 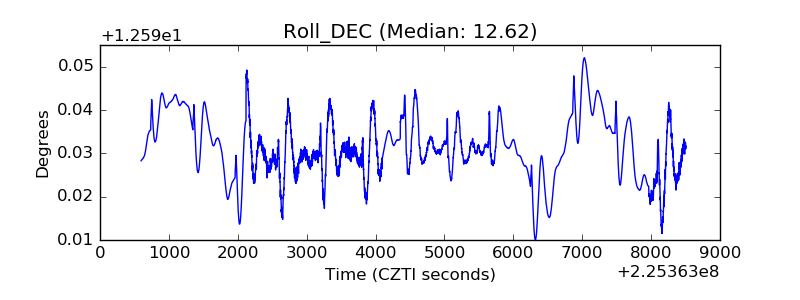 |
| _Roll_RA | 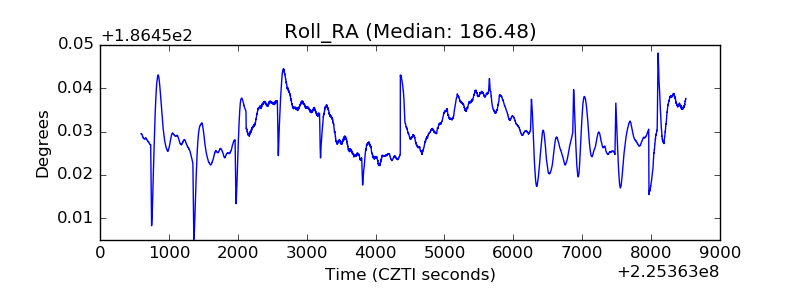 |
| Veto Counter | 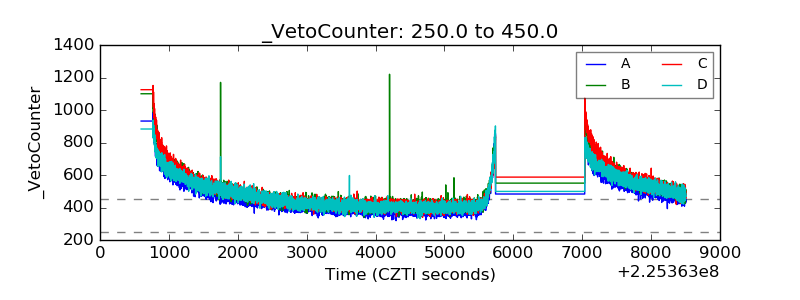 |