| Param | Original file | Final file |
|---|---|---|
| Filename | modeM0/AS1A02_024T01_9000001044_07584cztM0_level2.evt | modeM0/AS1A02_024T01_9000001044_07584cztM0_level2_quad_clean.evt |
| Size (bytes) | 533,396,160 | 62,213,760 |
| Size | 508.7 MB | 59.3 MB |
| Events in quadrant A | 3,427,619 | 367,364 |
| Events in quadrant B | 3,435,633 | 371,301 |
| Events in quadrant C | 3,392,650 | 367,655 |
| Events in quadrant D | 5,463,164 | 329,485 |
| Mode SS | |||
|---|---|---|---|
| Quadrant | BADHDUFLAG | Total packets | Discarded packets |
| A | 0 | 130 | 0 |
| B | 0 | 130 | 0 |
| C | 0 | 130 | 0 |
| D | 0 | 130 | 0 |
| Mode M0 | |||
|---|---|---|---|
| Quadrant | BADHDUFLAG | Total packets | Discarded packets |
| A | 0 | 14128 | 3 |
| B | 0 | 14166 | 2 |
| C | 0 | 14099 | 2 |
| D | 0 | 20508 | 2 |
| Mode M9 | |||
|---|---|---|---|
| Quadrant | BADHDUFLAG | Total packets | Discarded packets |
| A | 0 | 20 | 0 |
| B | 0 | 20 | 0 |
| C | 0 | 20 | 0 |
| D | 0 | 21 | 0 |
| Quadrant | Total seconds | Saturated seconds | Saturation percentage |
|---|---|---|---|
| A | 6415 | 111 | 1.730320% |
| B | 6415 | 104 | 1.621200% |
| C | 6415 | 86 | 1.340608% |
| D | 6415 | 660 | 10.288387% |
Noise dominated data is calculated using 1-second bins in cleaned event files. If a bin has >2000 counts, and if more than 50% of those come from <1% of pixels, then it is considered to be noise-dominated and hence unusable.
| Quadrant | # 1 sec bins | Bins with >0 counts | Bins with >2000 counts | High rate bins dominated by noise | Noise dominated (total time) | Noise dominated (detector-on time) | Marked lightcurve |
|---|---|---|---|---|---|---|---|
| A | 7715 | 6416 | 0 | 0 | 0.00% | 0.00% | 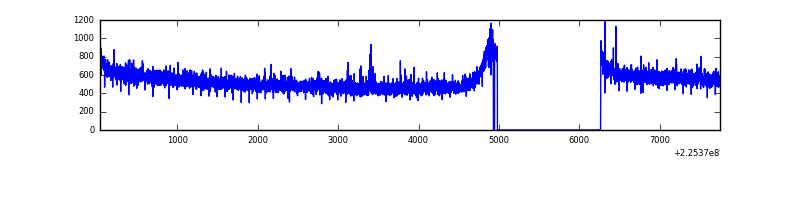 |
| B | 7715 | 6416 | 0 | 0 | 0.00% | 0.00% | 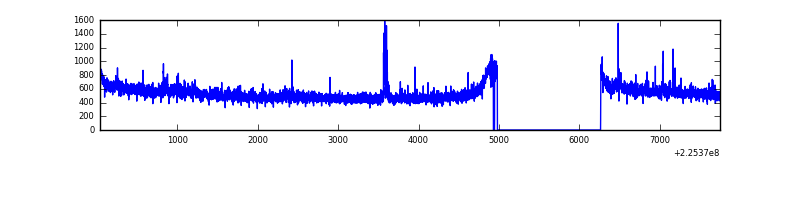 |
| C | 7715 | 6416 | 0 | 0 | 0.00% | 0.00% | 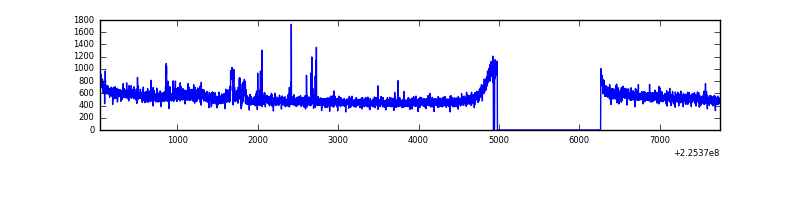 |
| D | 7715 | 6416 | 476 | 476 | 6.17% | 7.42% | 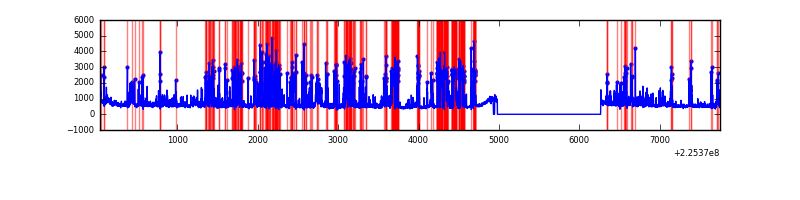 |
Top three noisy pixels from each quadrant. If the there are fewer than three noisy pixels in the level2.evt file, extra rows are filled as -1
| Pixel properties | Quadrant properties | ||||||
|---|---|---|---|---|---|---|---|
| Quadrant | DetID | PixID | Counts | Sigma | Mean | Median | Sigma |
| A | 15 | 239 | 80208 | 458.67 | 864 | 849 | 173.0 |
| A | 3 | 1 | 22661 | 126.07 | 864 | 849 | 173.0 |
| A | 0 | 226 | 8295 | 43.04 | 864 | 849 | 173.0 |
| B | 0 | 214 | 31588 | 188.03 | 864 | 845 | 163.5 |
| B | 0 | 229 | 26904 | 159.38 | 864 | 845 | 163.5 |
| B | 0 | 219 | 19162 | 112.03 | 864 | 845 | 163.5 |
| C | 9 | 68 | 83455 | 427.38 | 842 | 849 | 193.3 |
| C | 1 | 16 | 15683 | 76.75 | 842 | 849 | 193.3 |
| C | 8 | 229 | 9994 | 47.31 | 842 | 849 | 193.3 |
| D | 2 | 152 | 1391621 | 6939.75 | 819 | 795 | 200.4 |
| D | 15 | 217 | 478541 | 2383.79 | 819 | 795 | 200.4 |
| D | 2 | 14 | 310898 | 1547.31 | 819 | 795 | 200.4 |
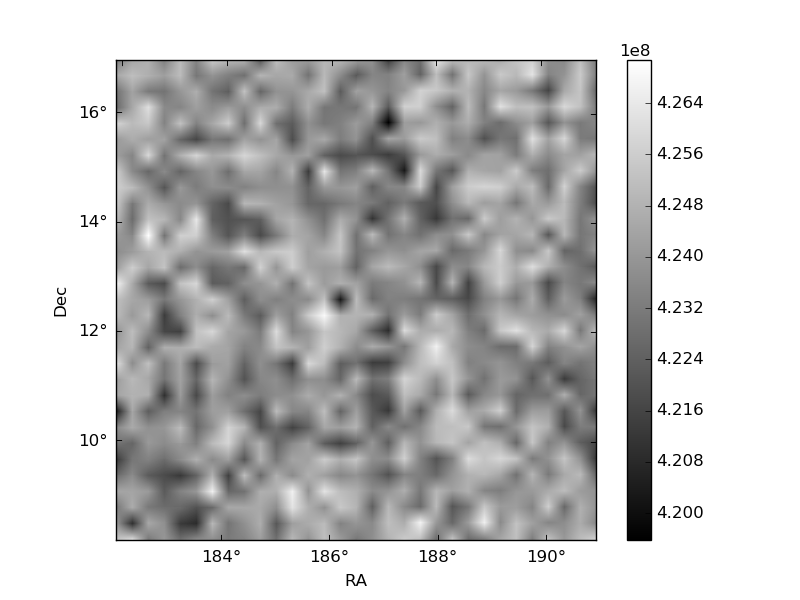
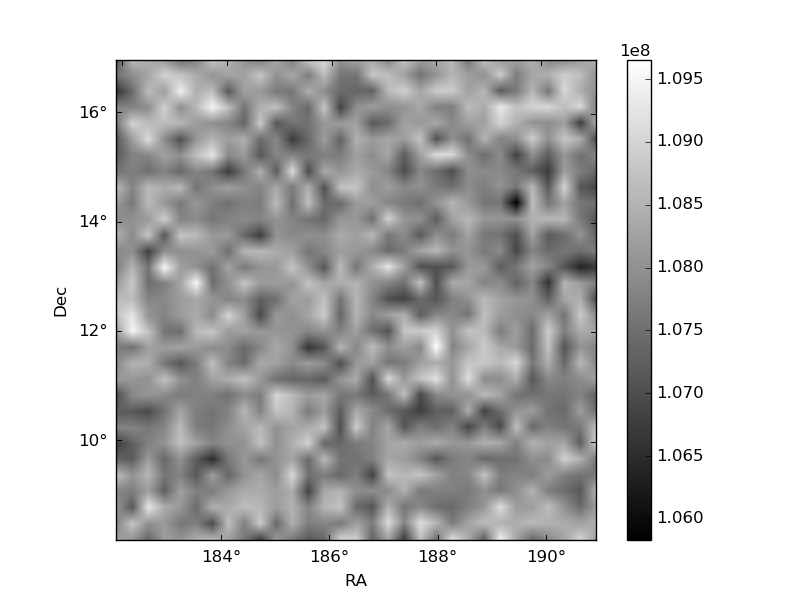
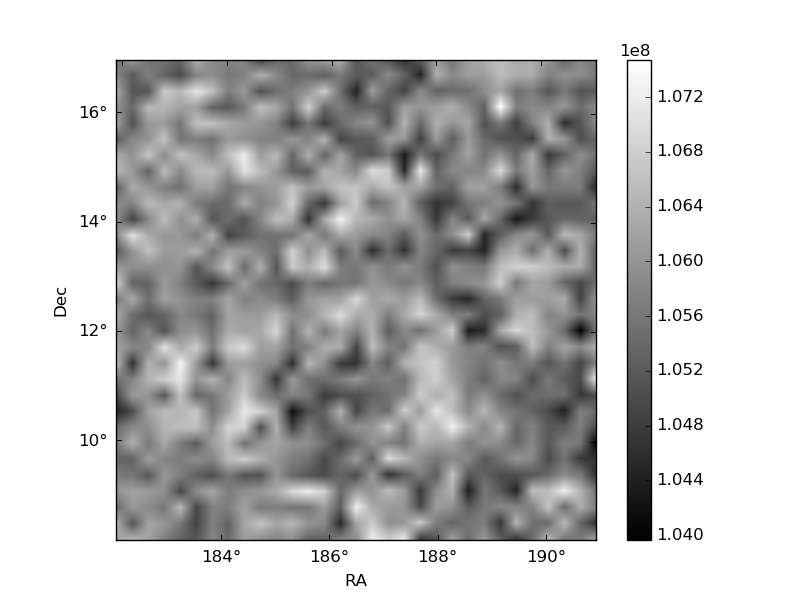
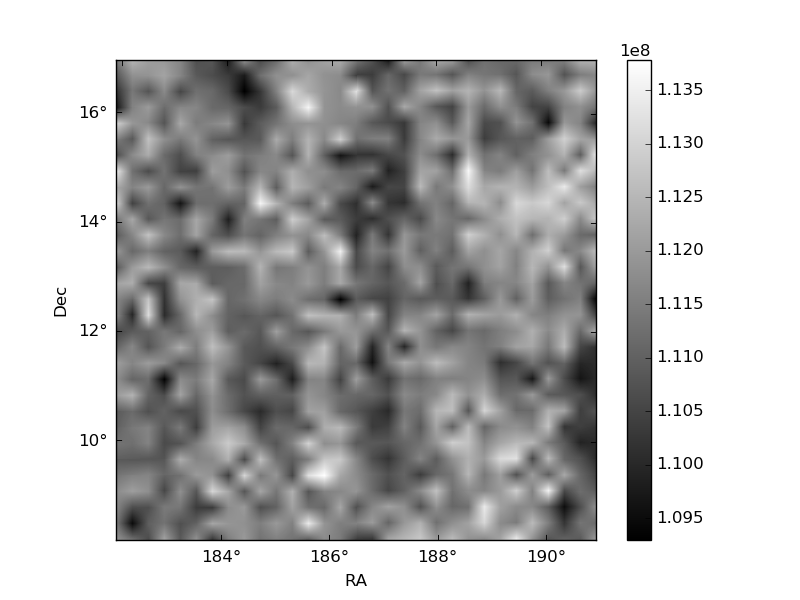
Histogram calculated using DETX and DETY for each event in the final _common_clean file
| Quadrant A | 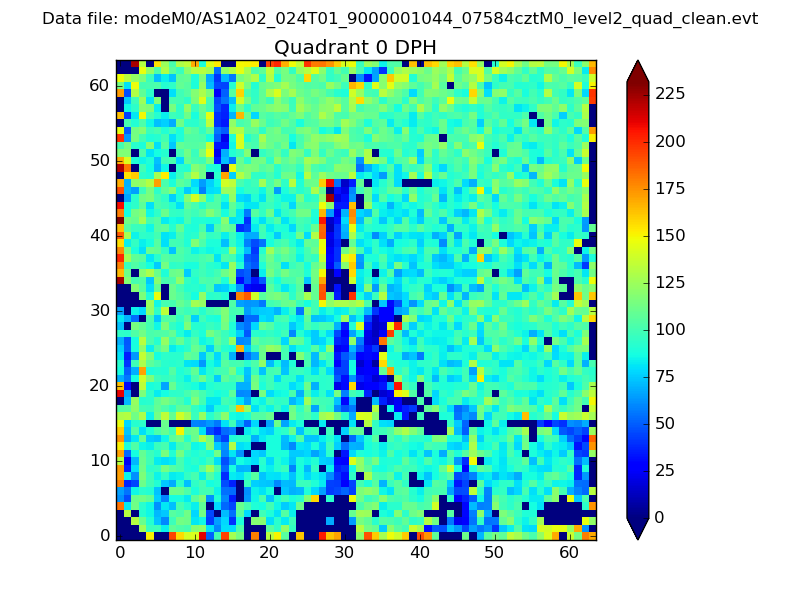 |
 |
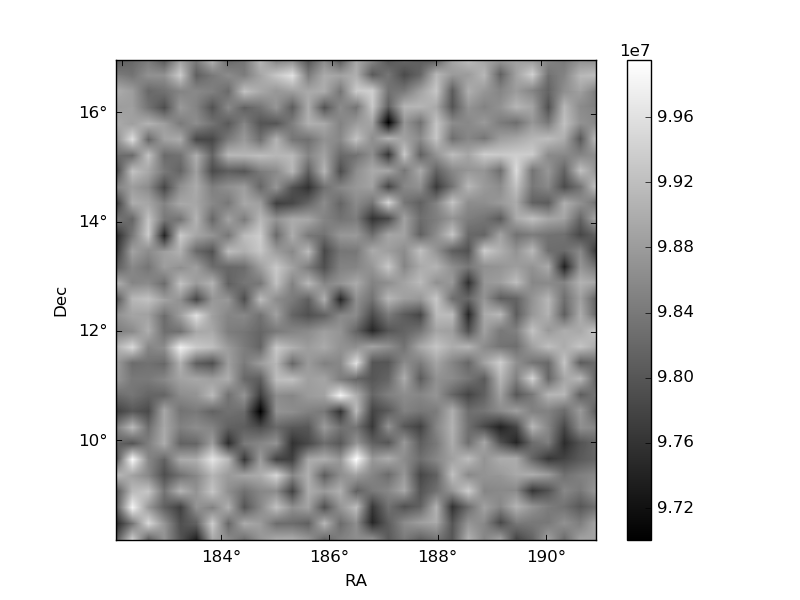
Quadrant B |
|---|---|---|---|
| Quadrant D | 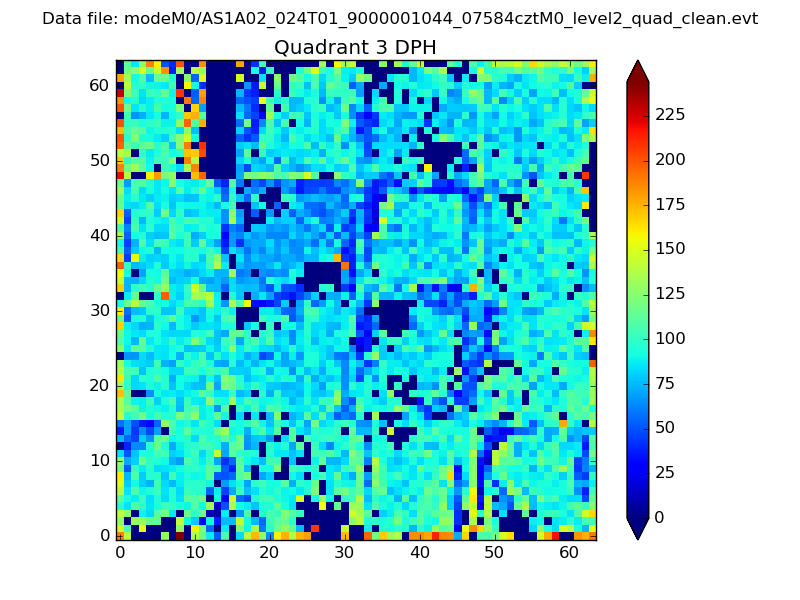 |
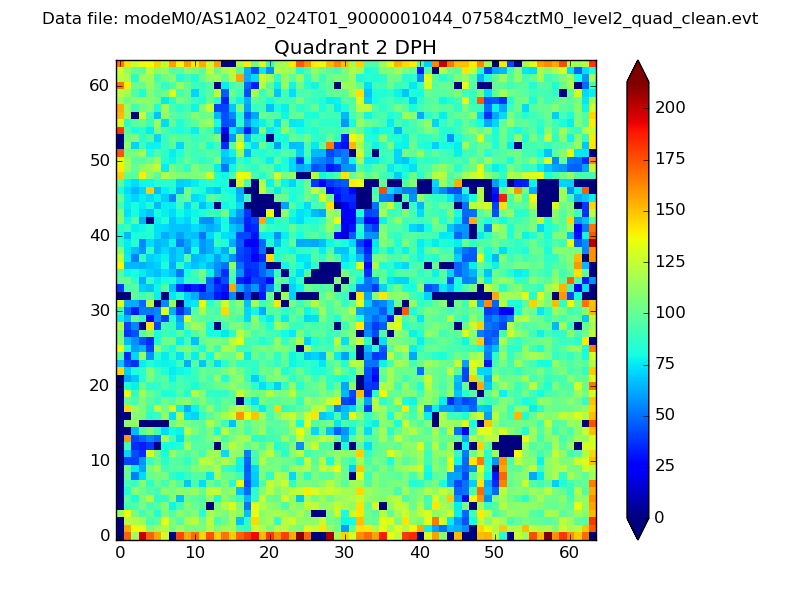 |
Quadrant C |
| Plot type | Count rate plots | Images |
|---|---|---|
| Comparison with Poisson distribution Blue bars denote a histogram of data divided into 1 sec bins. Red curve is a Poisson curve with rate = median count rate of data. |
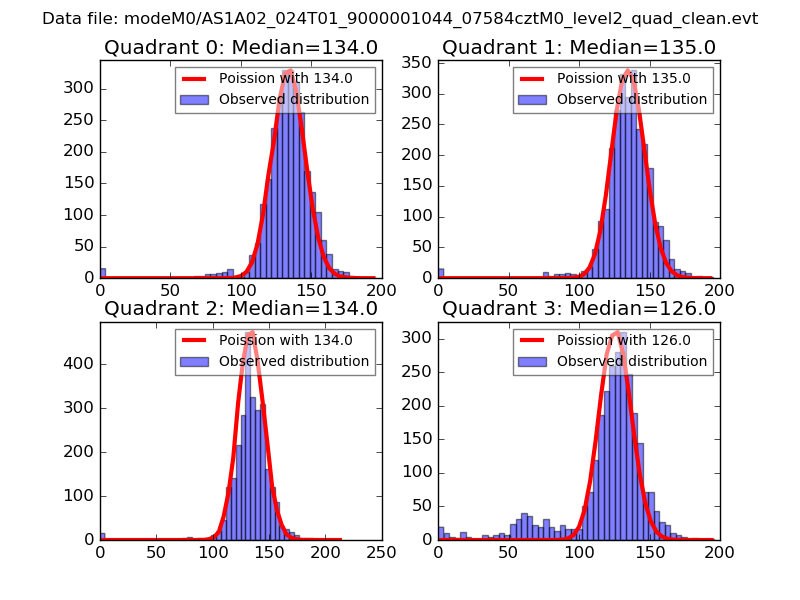 |
 |
| Quadrant-wise count rates Data is divided into 100 sec bins |
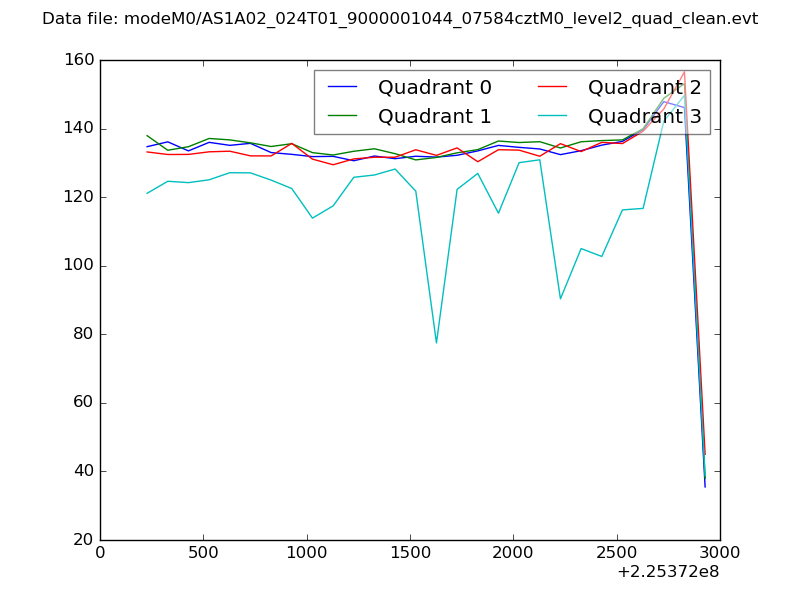 |
|
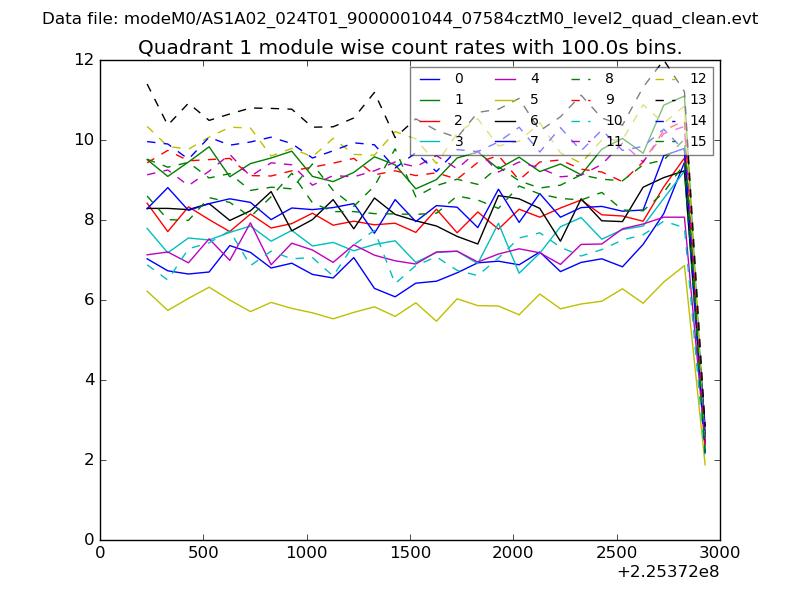
| Module-wise count rates for Quadrant A Data is divided into 100 sec bins |
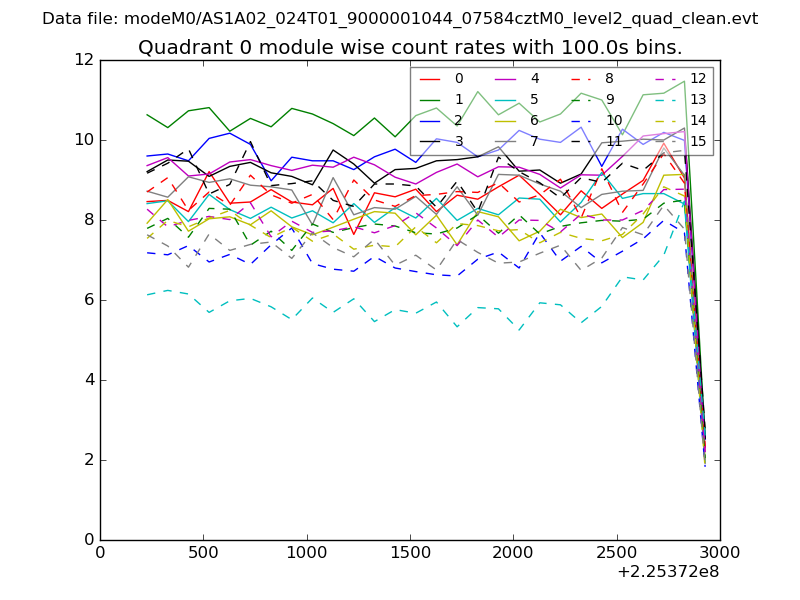 |
 |
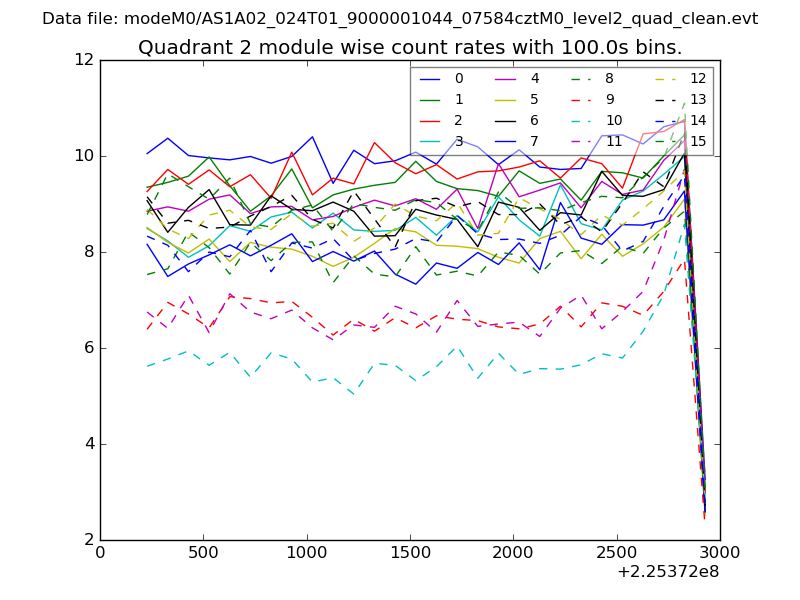
| Module-wise count rates for Quadrant B Data is divided into 100 sec bins |
 |
 |
| Module-wise count rates for Quadrant C Data is divided into 100 sec bins |
 |
 |
| Module-wise count rates for Quadrant D Data is divided into 100 sec bins |
 |
 |
| Parameter | Plot |
|---|---|
| CZT HV Monitor | 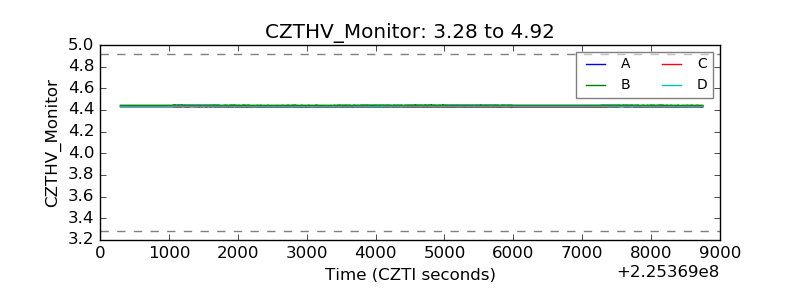 |
| D_VDD | 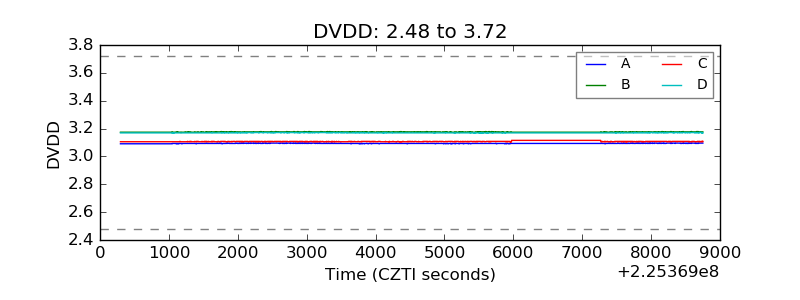 |
| Temperature 1 | 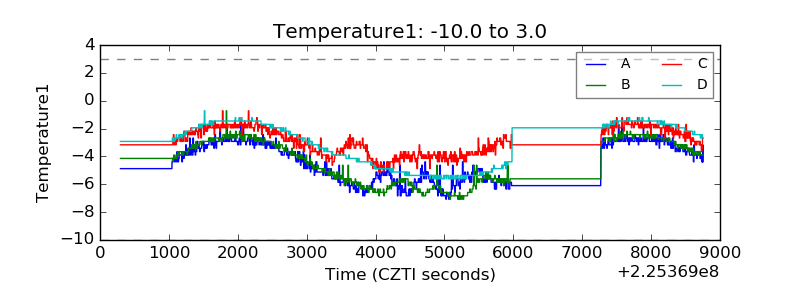 |
| Veto HV Monitor | 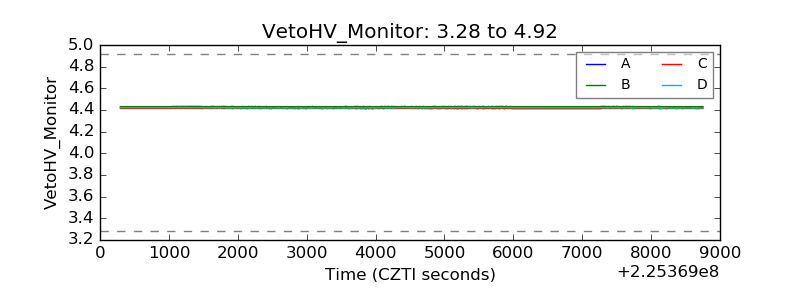 |
| Veto LLD |  |
| Alpha Counter | 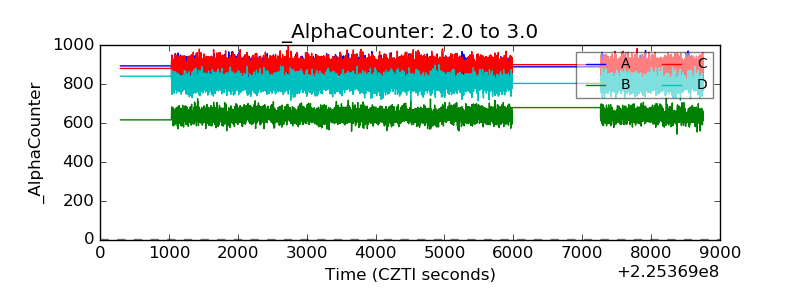 |
| _CPM_Rate | 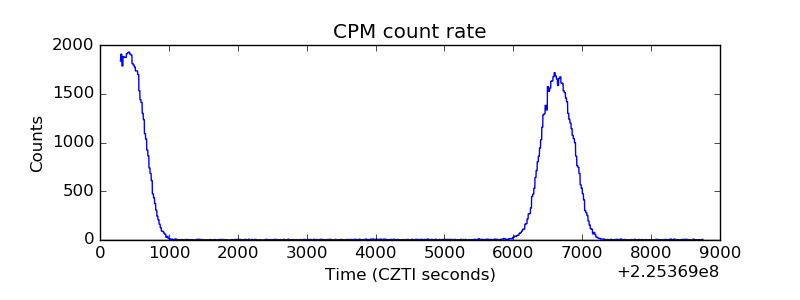 |
| CZT Counter | 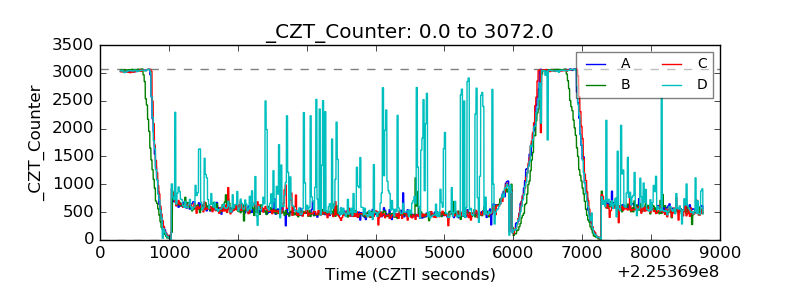 |
| +2.5 Volts monitor |  |
| +5 Volts monitor |  |
| _ROLL_ROT |  |
| _Roll_DEC | 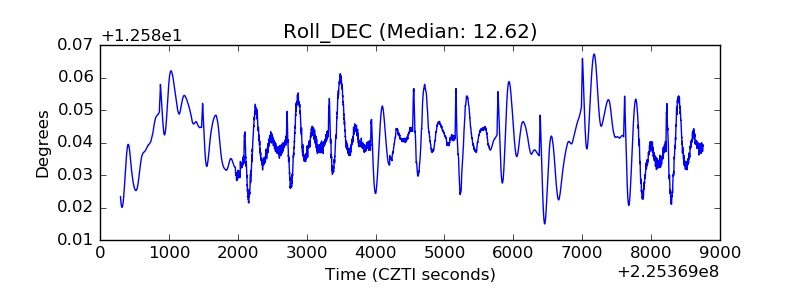 |
| _Roll_RA | 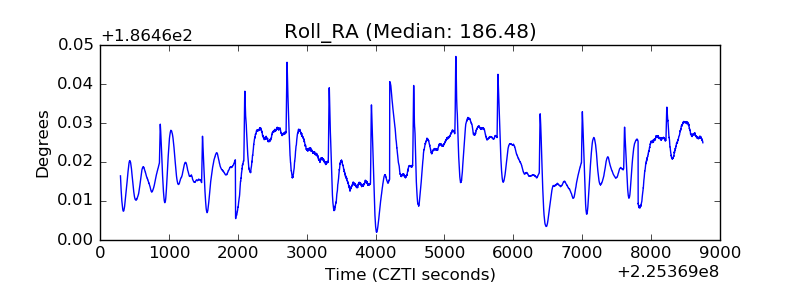 |
| Veto Counter |  |