| Param | Original file | Final file |
|---|---|---|
| Filename | modeM0/AS1A02_024T01_9000001044_07586cztM0_level2.evt | modeM0/AS1A02_024T01_9000001044_07586cztM0_level2_quad_clean.evt |
| Size (bytes) | 984,219,840 | 144,593,280 |
| Size | 938.6 MB | 137.9 MB |
| Events in quadrant A | 7,081,436 | 906,646 |
| Events in quadrant B | 5,770,584 | 922,439 |
| Events in quadrant C | 7,078,942 | 915,769 |
| Events in quadrant D | 9,103,903 | 842,551 |
| Mode SS | |||
|---|---|---|---|
| Quadrant | BADHDUFLAG | Total packets | Discarded packets |
| A | 0 | 234 | 0 |
| B | 0 | 234 | 0 |
| C | 0 | 234 | 0 |
| D | 0 | 234 | 0 |
| Mode M0 | |||
|---|---|---|---|
| Quadrant | BADHDUFLAG | Total packets | Discarded packets |
| A | 0 | 28413 | 4 |
| B | 0 | 24425 | 3 |
| C | 0 | 28492 | 3 |
| D | 0 | 34756 | 3 |
| Mode M9 | |||
|---|---|---|---|
| Quadrant | BADHDUFLAG | Total packets | Discarded packets |
| A | 0 | 24 | 0 |
| B | 0 | 24 | 0 |
| C | 0 | 24 | 0 |
| D | 0 | 24 | 0 |
| Quadrant | Total seconds | Saturated seconds | Saturation percentage |
|---|---|---|---|
| A | 11435 | 202 | 1.766506% |
| B | 11435 | 133 | 1.163096% |
| C | 11435 | 360 | 3.148229% |
| D | 11435 | 1018 | 8.902492% |
Noise dominated data is calculated using 1-second bins in cleaned event files. If a bin has >2000 counts, and if more than 50% of those come from <1% of pixels, then it is considered to be noise-dominated and hence unusable.
| Quadrant | # 1 sec bins | Bins with >0 counts | Bins with >2000 counts | High rate bins dominated by noise | Noise dominated (total time) | Noise dominated (detector-on time) | Marked lightcurve |
|---|---|---|---|---|---|---|---|
| A | 13805 | 11437 | 0 | 0 | 0.00% | 0.00% | 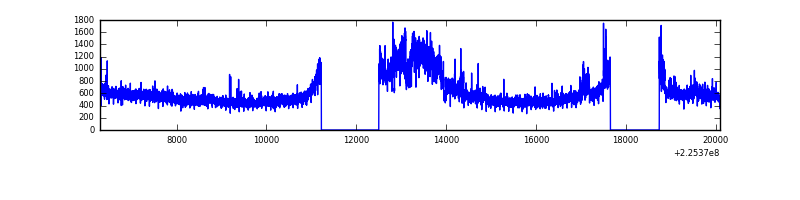 |
| B | 13805 | 11437 | 3 | 3 | 0.02% | 0.03% |  |
| C | 13805 | 11437 | 122 | 122 | 0.88% | 1.07% | 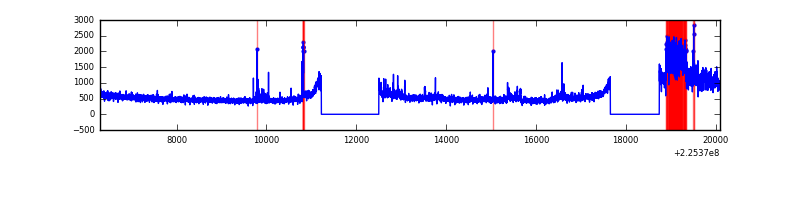 |
| D | 13805 | 11437 | 795 | 795 | 5.76% | 6.95% | 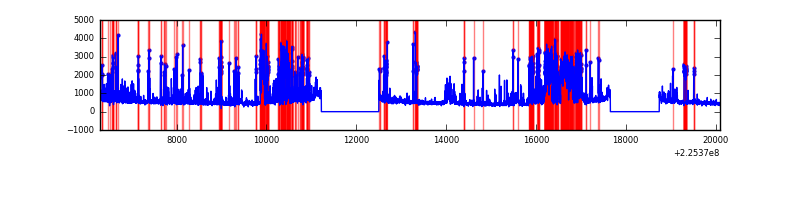 |
Top three noisy pixels from each quadrant. If the there are fewer than three noisy pixels in the level2.evt file, extra rows are filled as -1
| Pixel properties | Quadrant properties | ||||||
|---|---|---|---|---|---|---|---|
| Quadrant | DetID | PixID | Counts | Sigma | Mean | Median | Sigma |
| A | 15 | 239 | 1499214 | 5165.15 | 1445 | 1416 | 290.0 |
| A | 0 | 128 | 15025 | 46.93 | 1445 | 1416 | 290.0 |
| A | 3 | 1 | 14065 | 43.62 | 1445 | 1416 | 290.0 |
| B | 0 | 214 | 42517 | 148.92 | 1457 | 1424 | 275.9 |
| B | 11 | 51 | 29037 | 100.07 | 1457 | 1424 | 275.9 |
| B | 12 | 111 | 28216 | 97.09 | 1457 | 1424 | 275.9 |
| C | 9 | 68 | 1497859 | 4593.55 | 1414 | 1427 | 325.8 |
| C | 8 | 229 | 39137 | 115.76 | 1414 | 1427 | 325.8 |
| C | 1 | 16 | 24649 | 71.28 | 1414 | 1427 | 325.8 |
| D | 2 | 14 | 1946629 | 5718.23 | 1386 | 1347 | 340.2 |
| D | 2 | 152 | 1545766 | 4539.88 | 1386 | 1347 | 340.2 |
| D | 5 | 233 | 128882 | 374.89 | 1386 | 1347 | 340.2 |
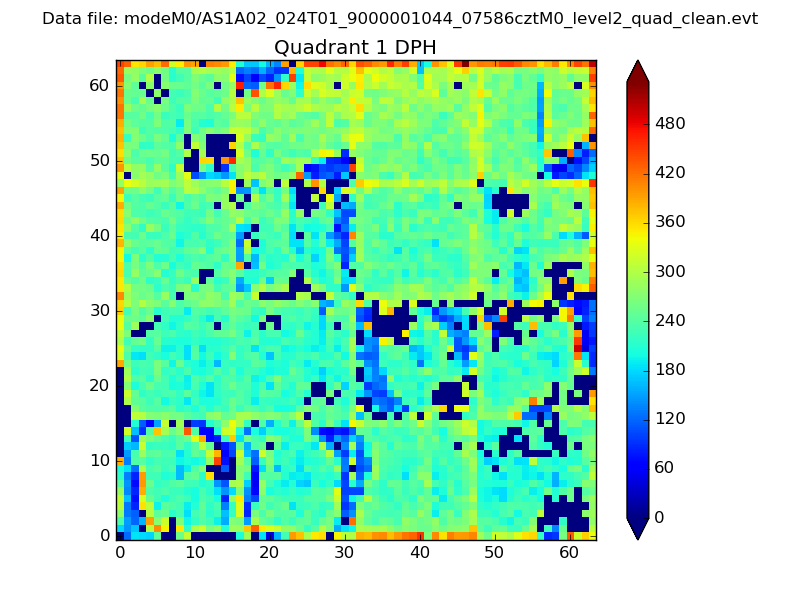
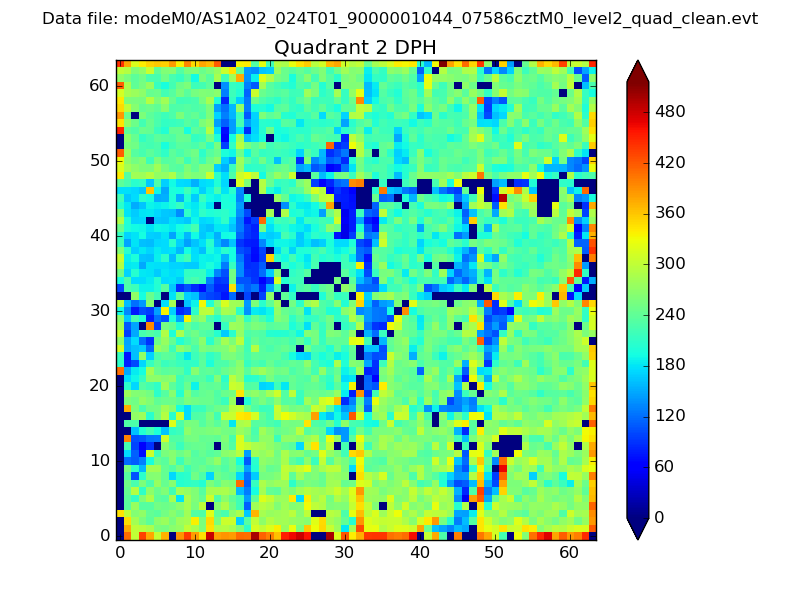
Histogram calculated using DETX and DETY for each event in the final _common_clean file
| Quadrant A | 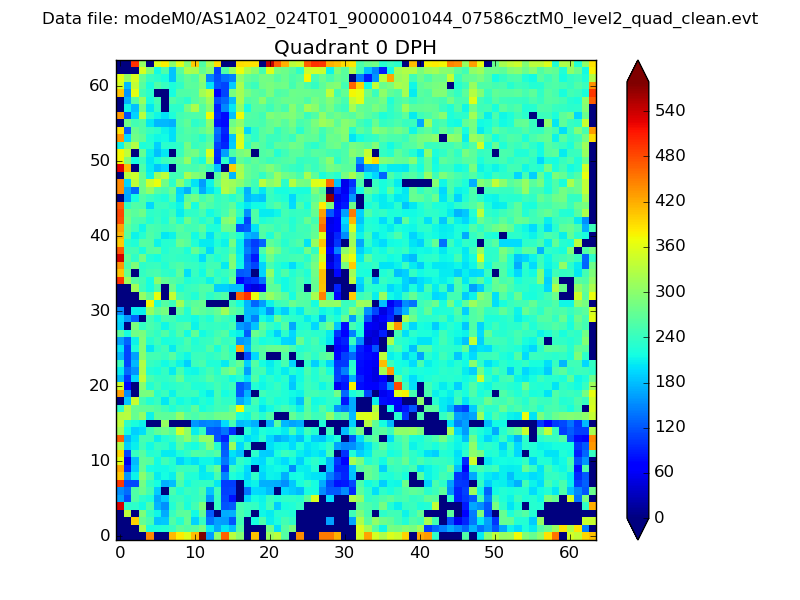 |
 |
Quadrant B |
|---|---|---|---|
| Quadrant D | 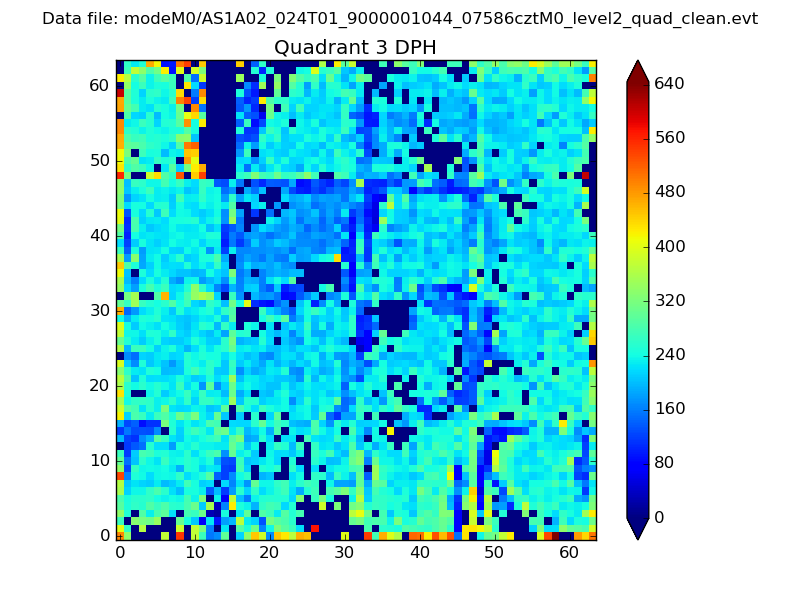 |
 |
Quadrant C |
| Plot type | Count rate plots | Images |
|---|---|---|
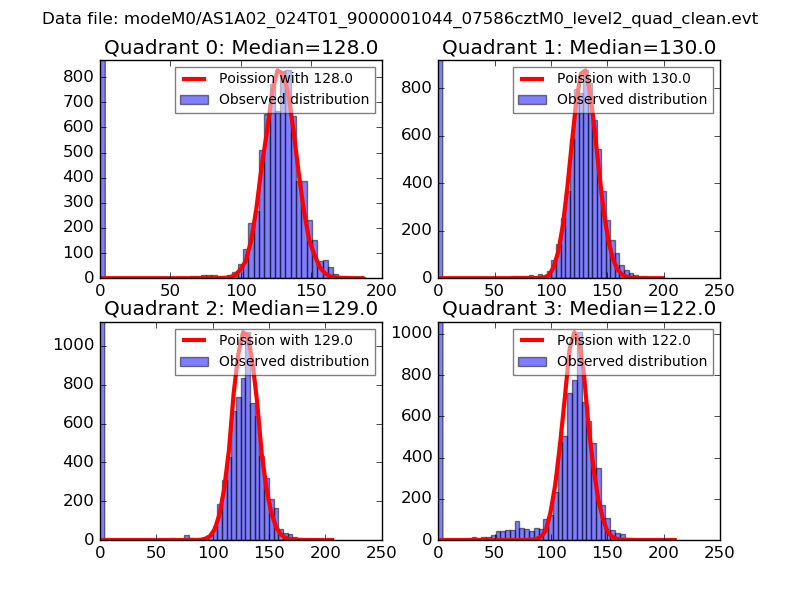
| Comparison with Poisson distribution Blue bars denote a histogram of data divided into 1 sec bins. Red curve is a Poisson curve with rate = median count rate of data. |
 |
 |
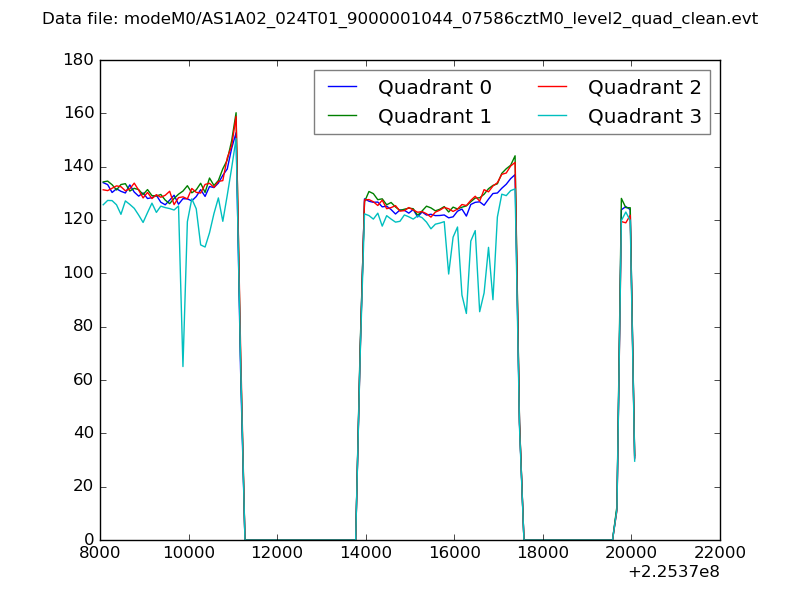
| Quadrant-wise count rates Data is divided into 100 sec bins |
 |
|
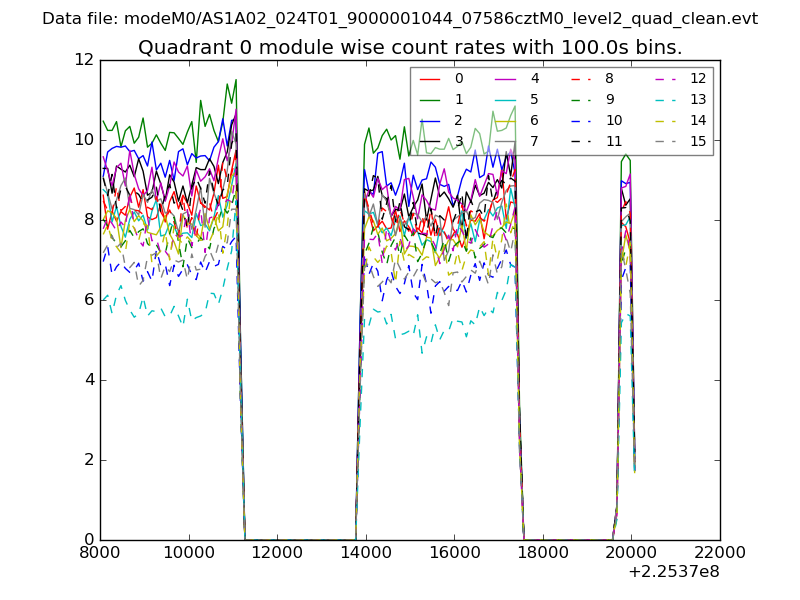
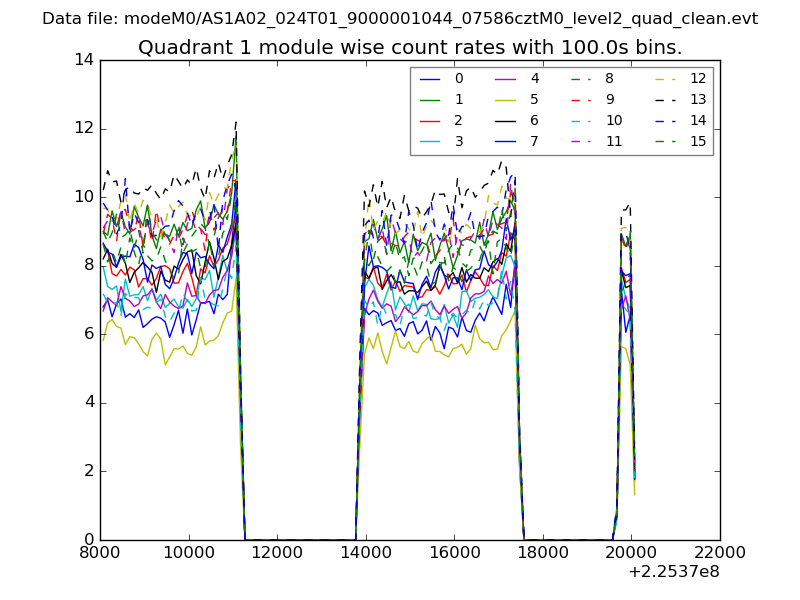
| Module-wise count rates for Quadrant A Data is divided into 100 sec bins |
 |
 |
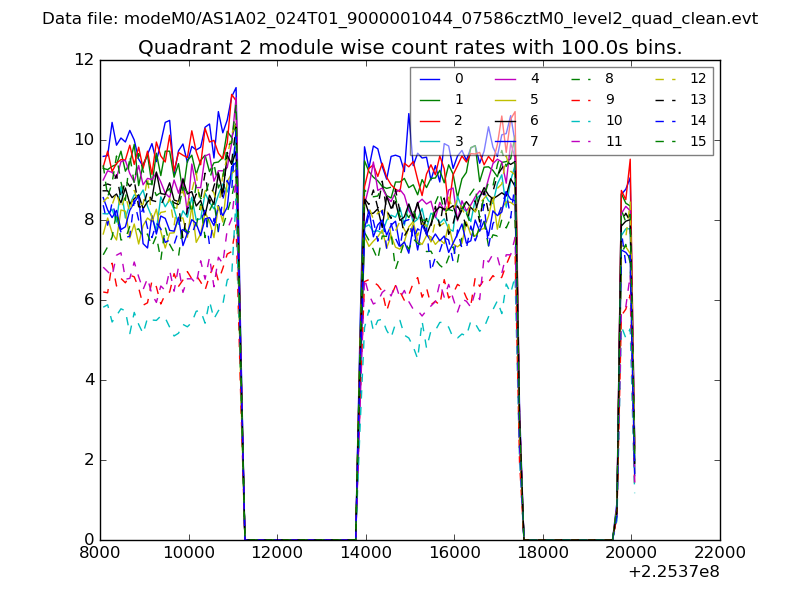
| Module-wise count rates for Quadrant B Data is divided into 100 sec bins |
 |
 |
| Module-wise count rates for Quadrant C Data is divided into 100 sec bins |
 |
 |
| Module-wise count rates for Quadrant D Data is divided into 100 sec bins |
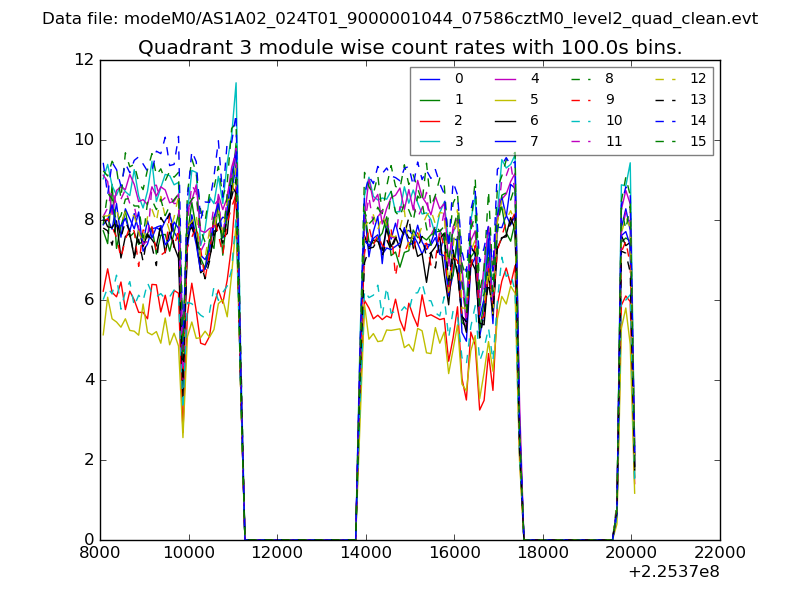 |
 |
| Parameter | Plot |
|---|---|
| CZT HV Monitor | 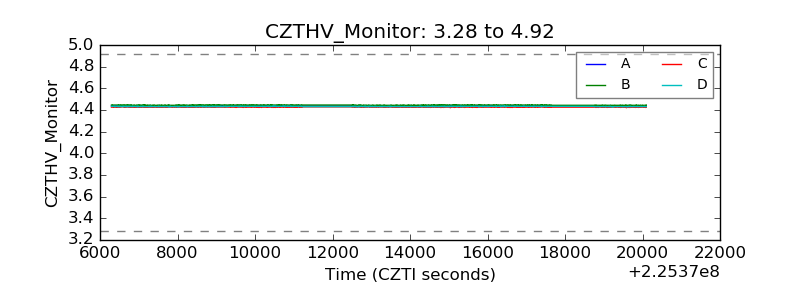 |
| D_VDD | 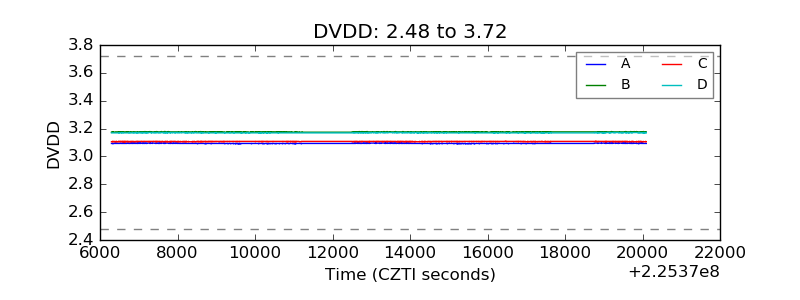 |
| Temperature 1 | 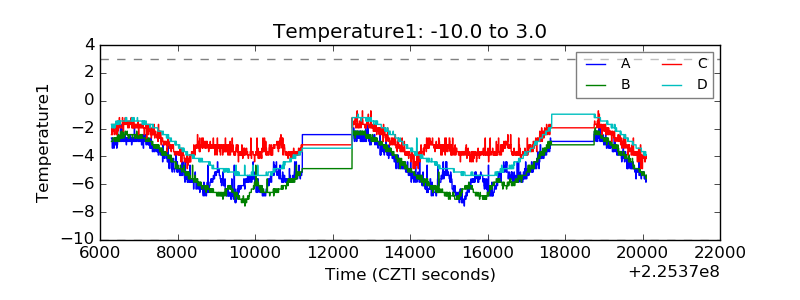 |
| Veto HV Monitor | 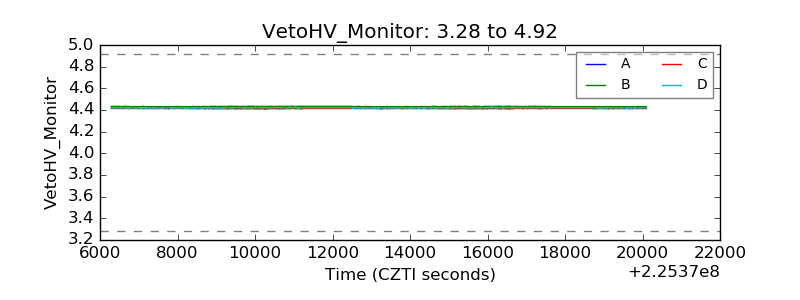 |
| Veto LLD | 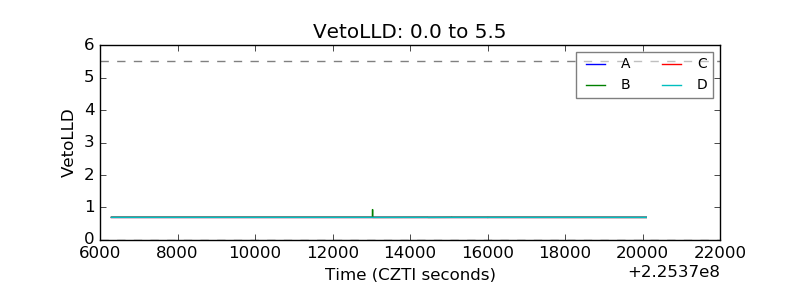 |
| Alpha Counter | 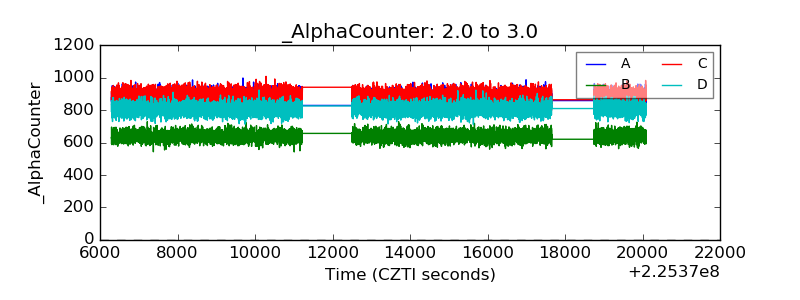 |
| _CPM_Rate | 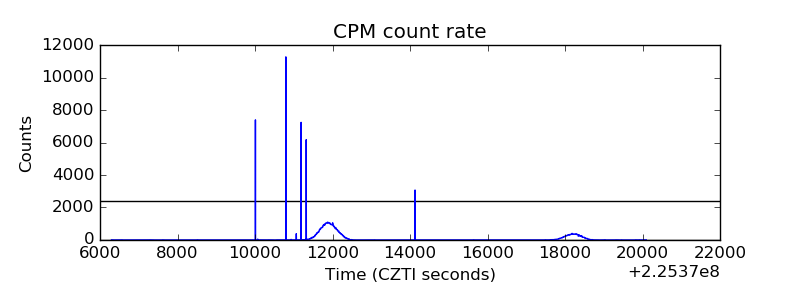 |
| CZT Counter | 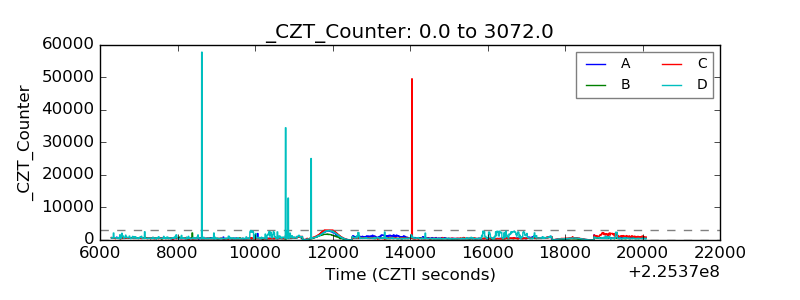 |
| +2.5 Volts monitor |  |
| +5 Volts monitor |  |
| _ROLL_ROT | 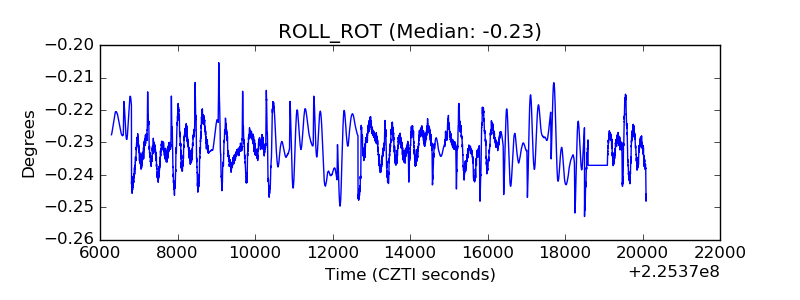 |
| _Roll_DEC | 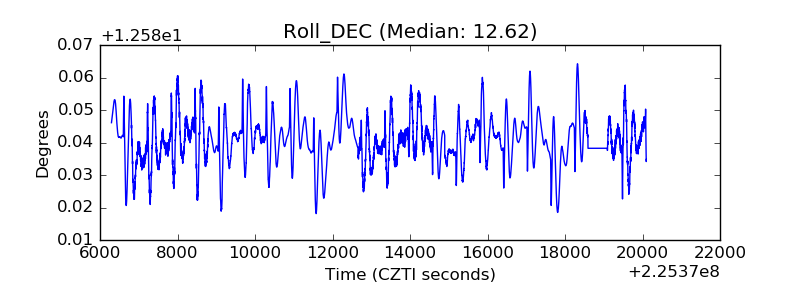 |
| _Roll_RA | 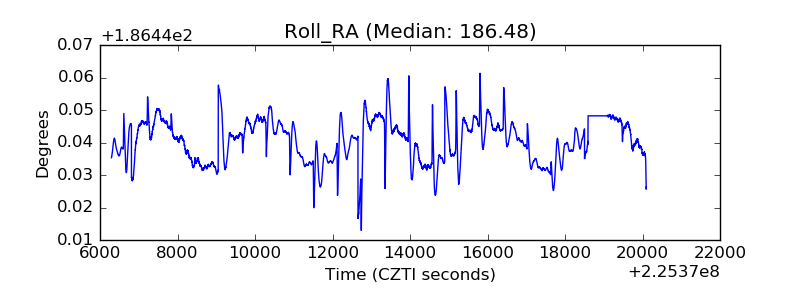 |
| Veto Counter | 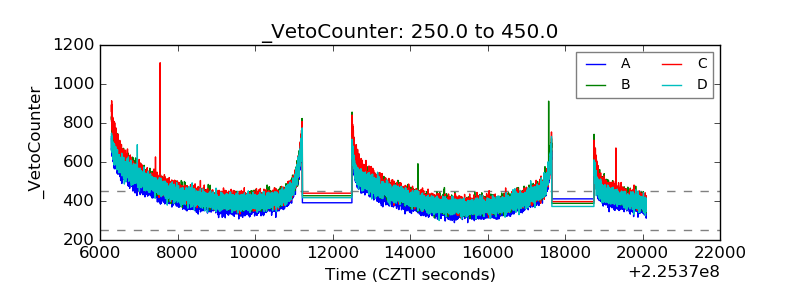 |