| Param | Original file | Final file |
|---|---|---|
| Filename | modeM0/AS1A02_024T01_9000001044_07587cztM0_level2.evt | modeM0/AS1A02_024T01_9000001044_07587cztM0_level2_quad_clean.evt |
| Size (bytes) | 695,102,400 | 88,865,280 |
| Size | 662.9 MB | 84.7 MB |
| Events in quadrant A | 3,932,156 | 551,841 |
| Events in quadrant B | 3,739,890 | 561,221 |
| Events in quadrant C | 7,679,395 | 541,017 |
| Events in quadrant D | 5,205,199 | 527,105 |
| Mode SS | |||
|---|---|---|---|
| Quadrant | BADHDUFLAG | Total packets | Discarded packets |
| A | 0 | 150 | 0 |
| B | 0 | 150 | 0 |
| C | 0 | 150 | 0 |
| D | 0 | 150 | 0 |
| Mode M0 | |||
|---|---|---|---|
| Quadrant | BADHDUFLAG | Total packets | Discarded packets |
| A | 0 | 16368 | 3 |
| B | 0 | 15897 | 2 |
| C | 0 | 27825 | 2 |
| D | 0 | 20553 | 2 |
| Mode M9 | |||
|---|---|---|---|
| Quadrant | BADHDUFLAG | Total packets | Discarded packets |
| A | 0 | 18 | 0 |
| B | 0 | 18 | 0 |
| C | 0 | 18 | 0 |
| D | 0 | 18 | 0 |
| Quadrant | Total seconds | Saturated seconds | Saturation percentage |
|---|---|---|---|
| A | 7325 | 115 | 1.569966% |
| B | 7325 | 121 | 1.651877% |
| C | 7325 | 488 | 6.662116% |
| D | 7325 | 365 | 4.982935% |
Noise dominated data is calculated using 1-second bins in cleaned event files. If a bin has >2000 counts, and if more than 50% of those come from <1% of pixels, then it is considered to be noise-dominated and hence unusable.
| Quadrant | # 1 sec bins | Bins with >0 counts | Bins with >2000 counts | High rate bins dominated by noise | Noise dominated (total time) | Noise dominated (detector-on time) | Marked lightcurve |
|---|---|---|---|---|---|---|---|
| A | 9095 | 7327 | 0 | 0 | 0.00% | 0.00% | 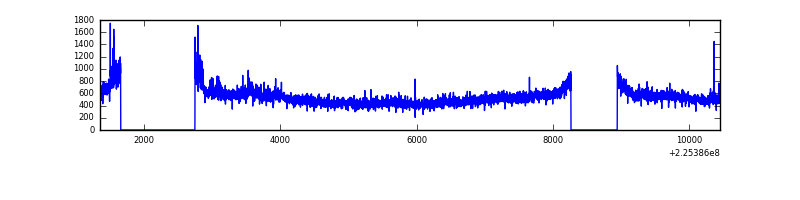 |
| B | 9095 | 7327 | 3 | 3 | 0.03% | 0.04% | 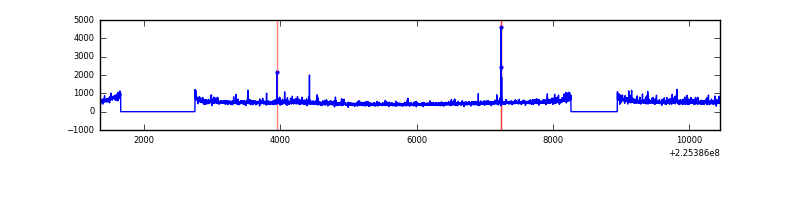 |
| C | 9095 | 7327 | 167 | 167 | 1.84% | 2.28% | 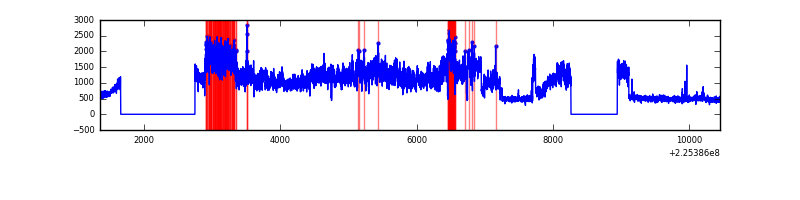 |
| D | 9095 | 7327 | 253 | 253 | 2.78% | 3.45% | 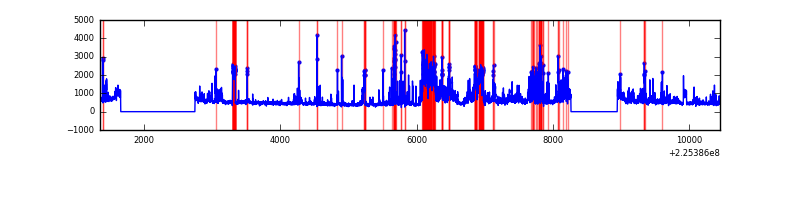 |
Top three noisy pixels from each quadrant. If the there are fewer than three noisy pixels in the level2.evt file, extra rows are filled as -1
| Pixel properties | Quadrant properties | ||||||
|---|---|---|---|---|---|---|---|
| Quadrant | DetID | PixID | Counts | Sigma | Mean | Median | Sigma |
| A | 15 | 239 | 451167 | 2442.52 | 901 | 880 | 184.4 |
| A | 3 | 1 | 9251 | 45.41 | 901 | 880 | 184.4 |
| A | 0 | 226 | 8561 | 41.66 | 901 | 880 | 184.4 |
| B | 11 | 51 | 137914 | 778.51 | 910 | 889 | 176.0 |
| B | 0 | 214 | 31007 | 171.12 | 910 | 889 | 176.0 |
| B | 4 | 173 | 20173 | 109.56 | 910 | 889 | 176.0 |
| C | 9 | 68 | 4236452 | 20747.68 | 870 | 875 | 204.1 |
| C | 8 | 229 | 32308 | 153.97 | 870 | 875 | 204.1 |
| C | 1 | 16 | 16141 | 74.78 | 870 | 875 | 204.1 |
| D | 2 | 152 | 1273068 | 5837.66 | 875 | 848 | 217.9 |
| D | 2 | 14 | 251316 | 1149.29 | 875 | 848 | 217.9 |
| D | 15 | 217 | 155906 | 711.49 | 875 | 848 | 217.9 |
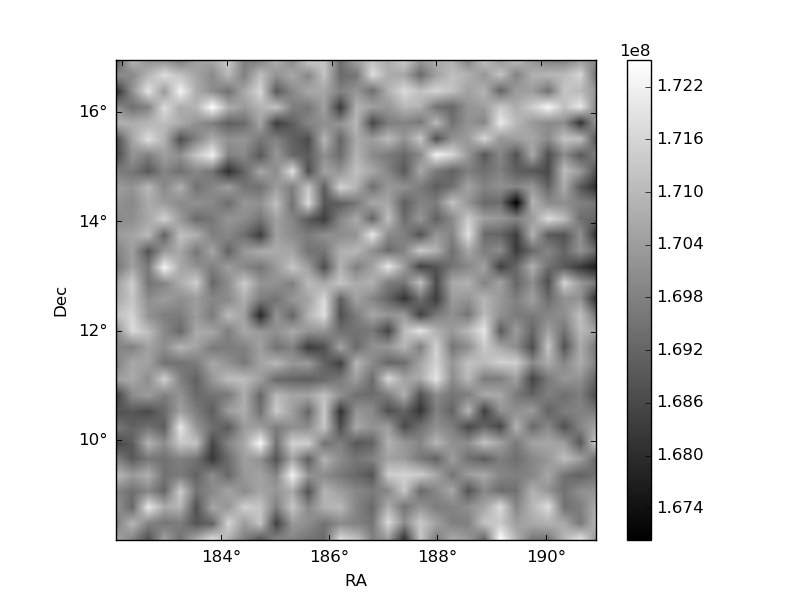
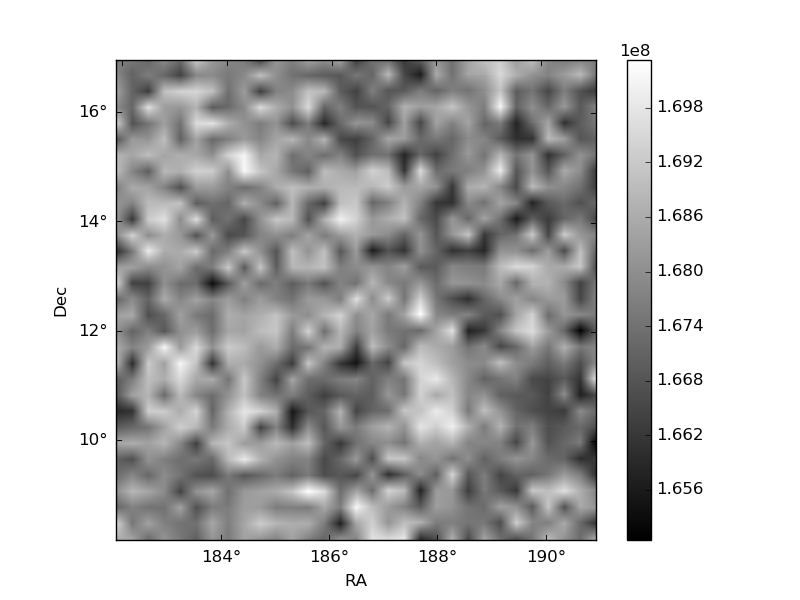
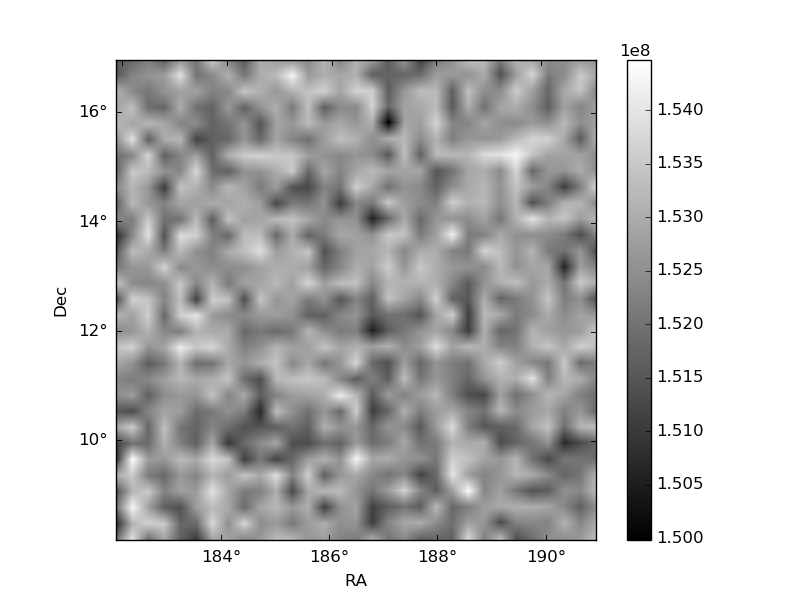
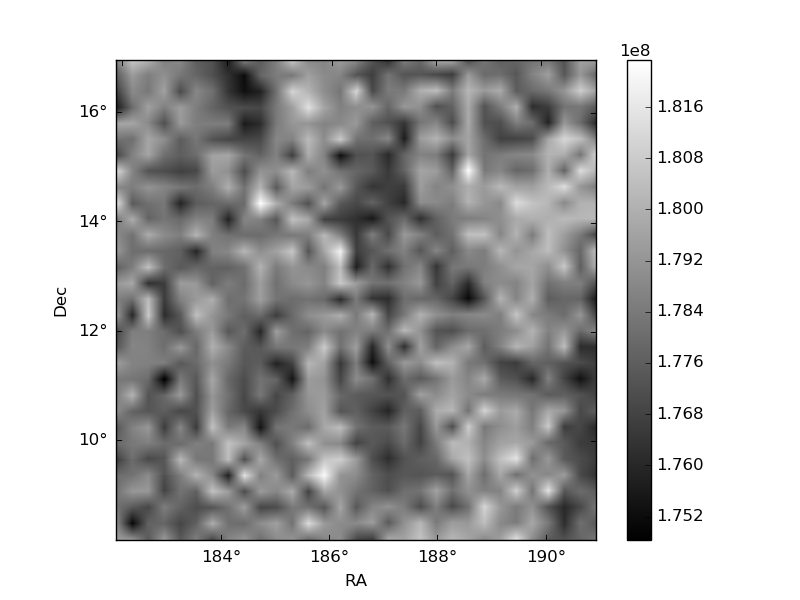
Histogram calculated using DETX and DETY for each event in the final _common_clean file
| Quadrant A | 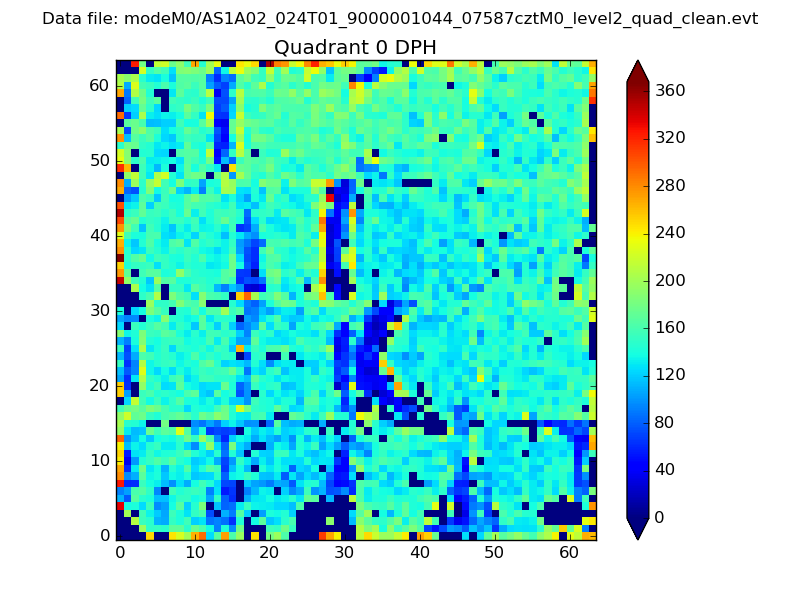 |
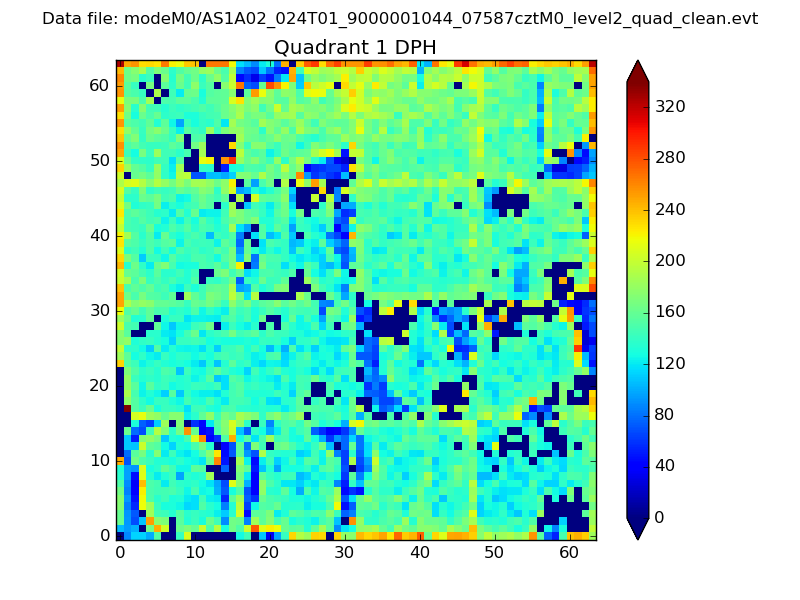 |
Quadrant B |
|---|---|---|---|
| Quadrant D | 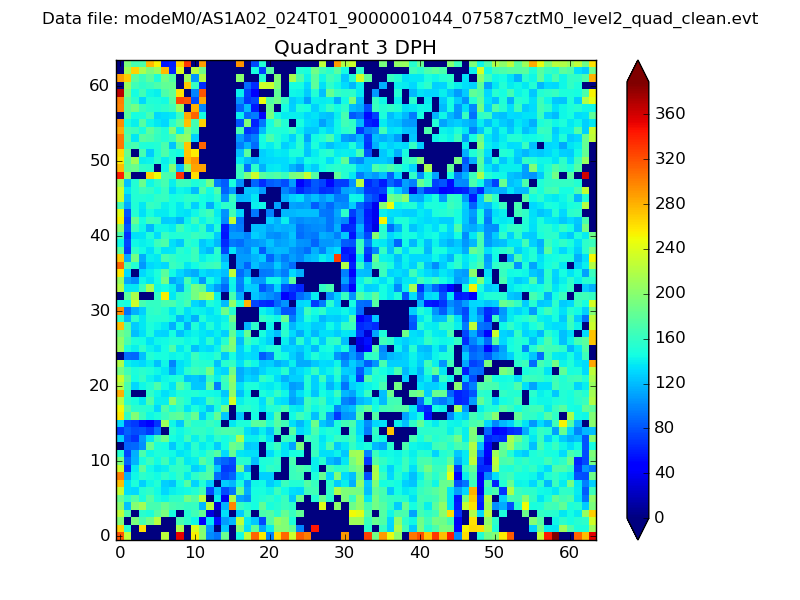 |
 |
Quadrant C |
| Plot type | Count rate plots | Images |
|---|---|---|
| Comparison with Poisson distribution Blue bars denote a histogram of data divided into 1 sec bins. Red curve is a Poisson curve with rate = median count rate of data. |
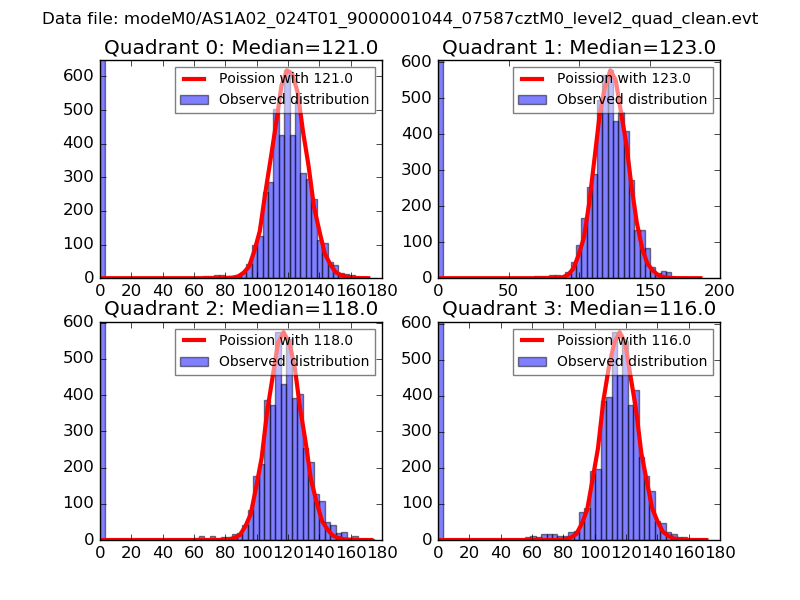 |
 |
| Quadrant-wise count rates Data is divided into 100 sec bins |
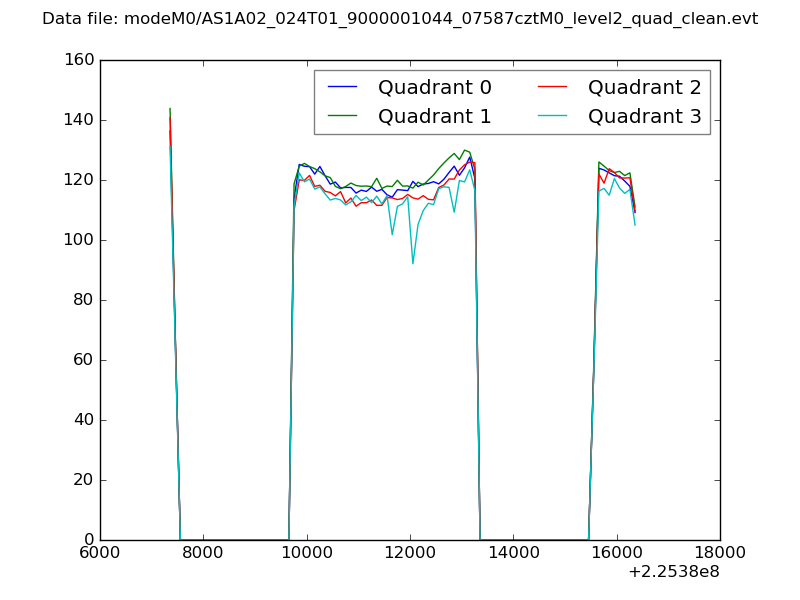 |
|
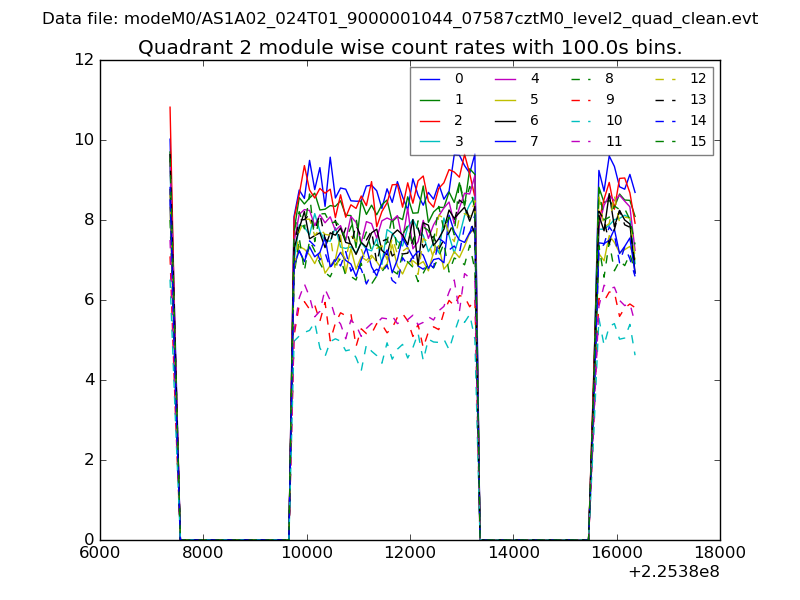
| Module-wise count rates for Quadrant A Data is divided into 100 sec bins |
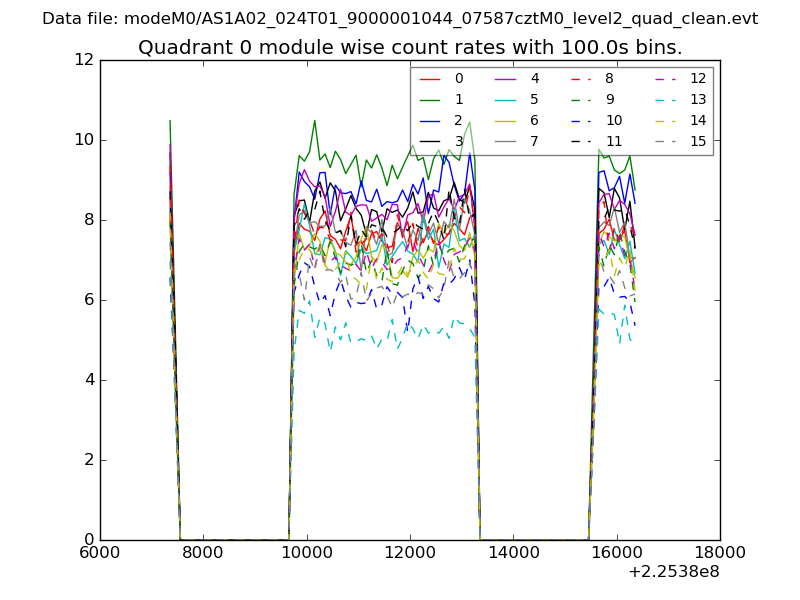 |
 |
| Module-wise count rates for Quadrant B Data is divided into 100 sec bins |
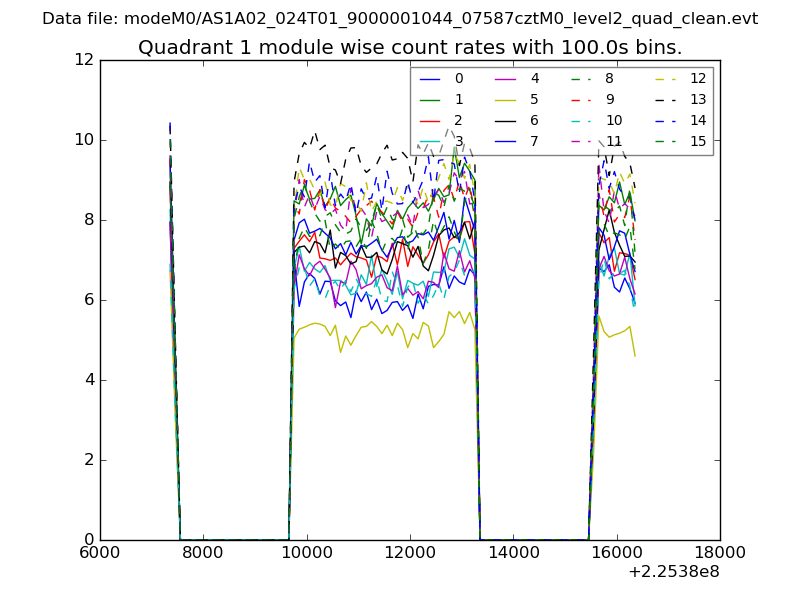 |
 |
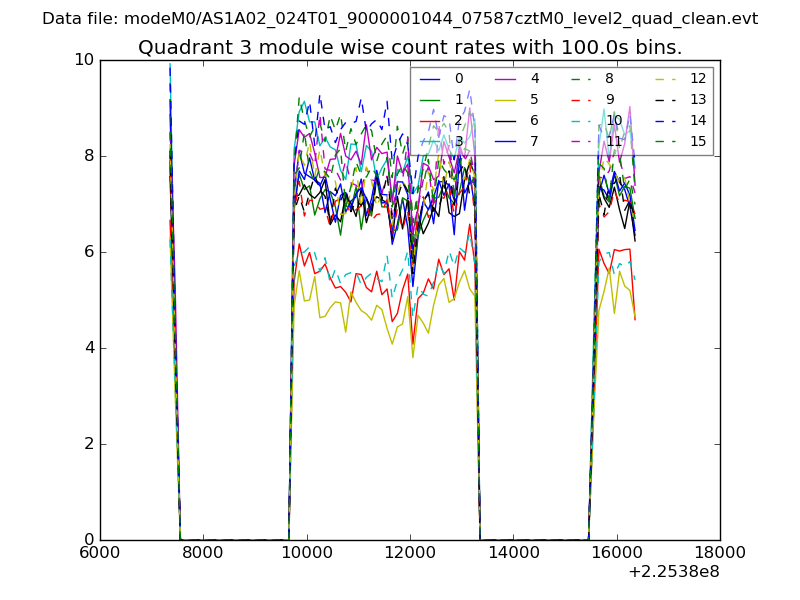
| Module-wise count rates for Quadrant C Data is divided into 100 sec bins |
 |
 |
| Module-wise count rates for Quadrant D Data is divided into 100 sec bins |
 |
 |
| Parameter | Plot |
|---|---|
| CZT HV Monitor | 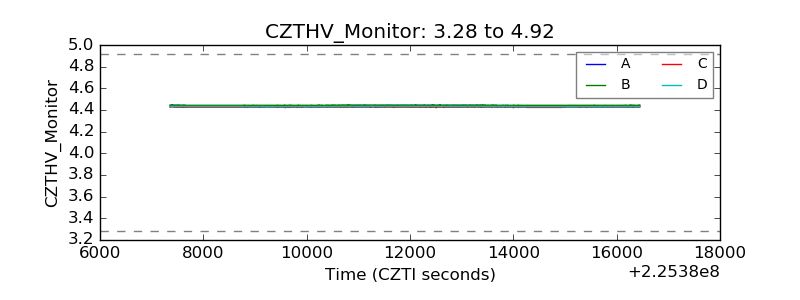 |
| D_VDD | 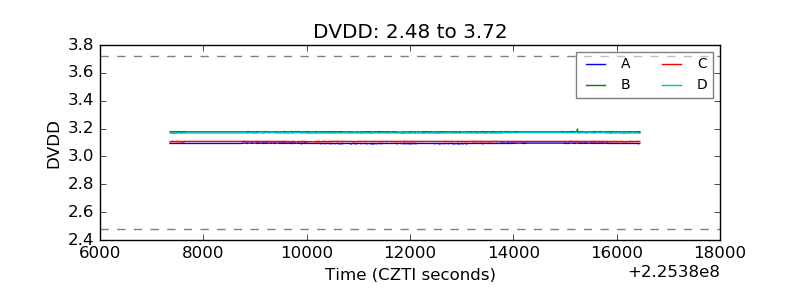 |
| Temperature 1 |  |
| Veto HV Monitor | 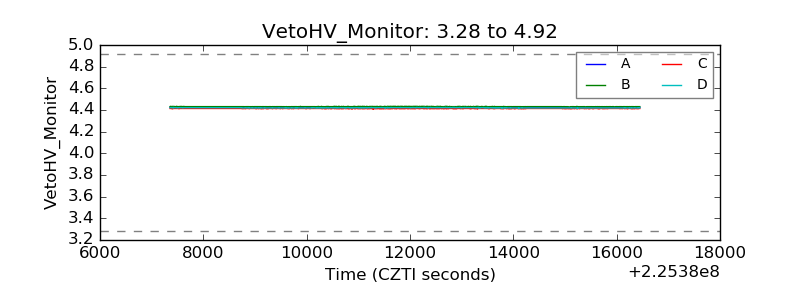 |
| Veto LLD | 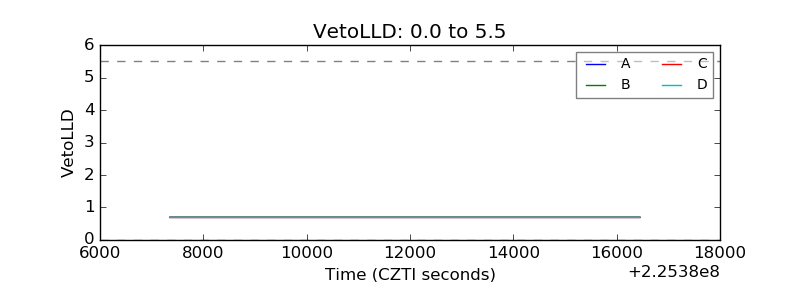 |
| Alpha Counter | 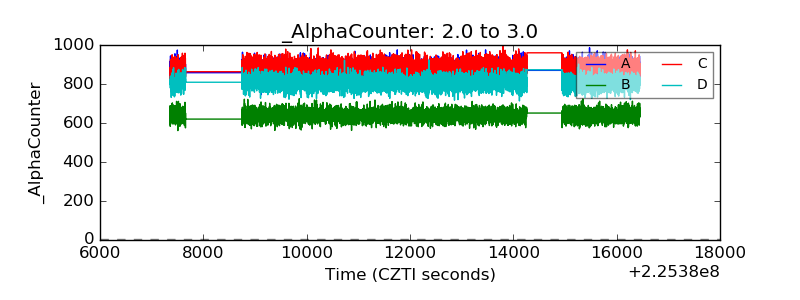 |
| _CPM_Rate | 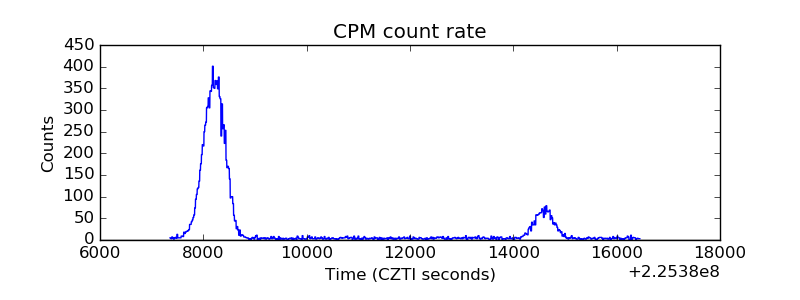 |
| CZT Counter |  |
| +2.5 Volts monitor |  |
| +5 Volts monitor | 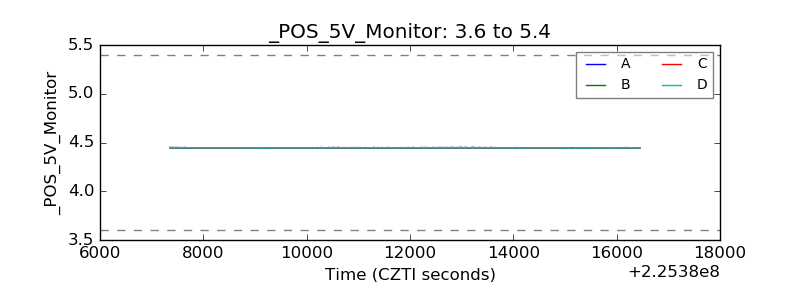 |
| _ROLL_ROT | 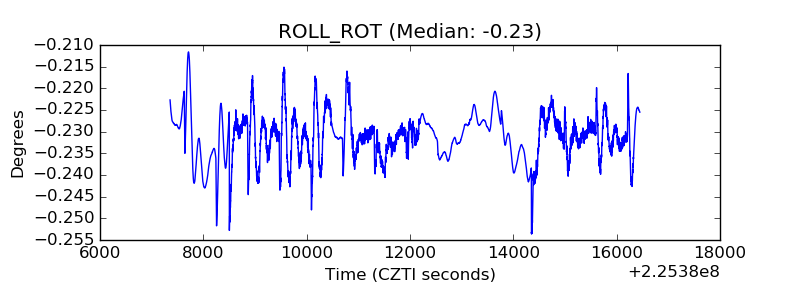 |
| _Roll_DEC | 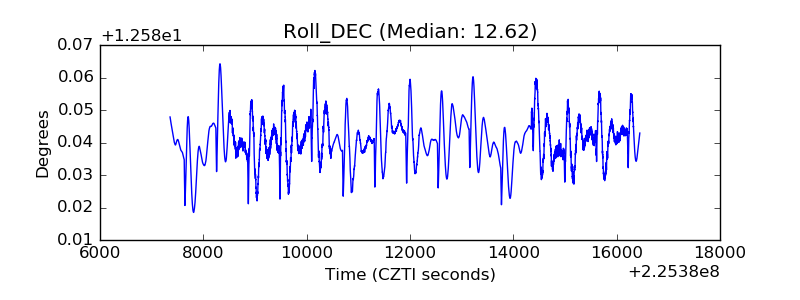 |
| _Roll_RA | 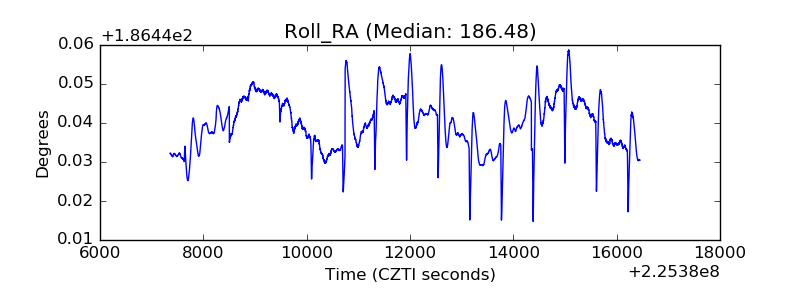 |
| Veto Counter | 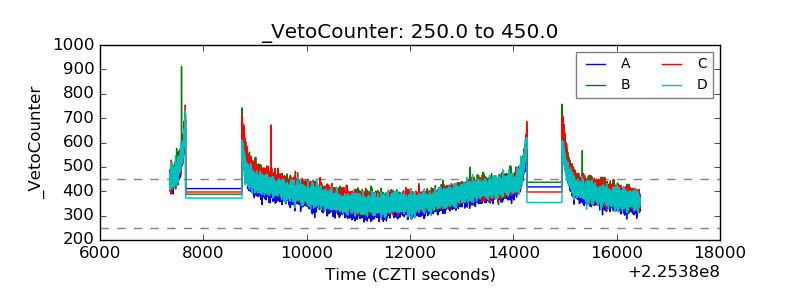 |