| Param | Original file | Final file |
|---|---|---|
| Filename | modeM0/AS1A02_024T01_9000001044_07588cztM0_level2.evt | modeM0/AS1A02_024T01_9000001044_07588cztM0_level2_quad_clean.evt |
| Size (bytes) | 588,942,720 | 91,080,000 |
| Size | 561.7 MB | 86.9 MB |
| Events in quadrant A | 4,193,540 | 557,765 |
| Events in quadrant B | 3,967,036 | 567,382 |
| Events in quadrant C | 4,232,794 | 562,555 |
| Events in quadrant D | 4,919,604 | 533,634 |
| Mode SS | |||
|---|---|---|---|
| Quadrant | BADHDUFLAG | Total packets | Discarded packets |
| A | 0 | 160 | 0 |
| B | 0 | 160 | 0 |
| C | 0 | 160 | 0 |
| D | 0 | 160 | 0 |
| Mode M0 | |||
|---|---|---|---|
| Quadrant | BADHDUFLAG | Total packets | Discarded packets |
| A | 0 | 17442 | 3 |
| B | 0 | 16956 | 2 |
| C | 0 | 17640 | 2 |
| D | 0 | 19864 | 2 |
| Mode M9 | |||
|---|---|---|---|
| Quadrant | BADHDUFLAG | Total packets | Discarded packets |
| A | 0 | 9 | 0 |
| B | 0 | 9 | 0 |
| C | 0 | 9 | 0 |
| D | 0 | 9 | 0 |
| Quadrant | Total seconds | Saturated seconds | Saturation percentage |
|---|---|---|---|
| A | 7712 | 118 | 1.530083% |
| B | 7712 | 136 | 1.763485% |
| C | 7712 | 184 | 2.385892% |
| D | 7712 | 268 | 3.475104% |
Noise dominated data is calculated using 1-second bins in cleaned event files. If a bin has >2000 counts, and if more than 50% of those come from <1% of pixels, then it is considered to be noise-dominated and hence unusable.
| Quadrant | # 1 sec bins | Bins with >0 counts | Bins with >2000 counts | High rate bins dominated by noise | Noise dominated (total time) | Noise dominated (detector-on time) | Marked lightcurve |
|---|---|---|---|---|---|---|---|
| A | 8647 | 7714 | 0 | 0 | 0.00% | 0.00% | 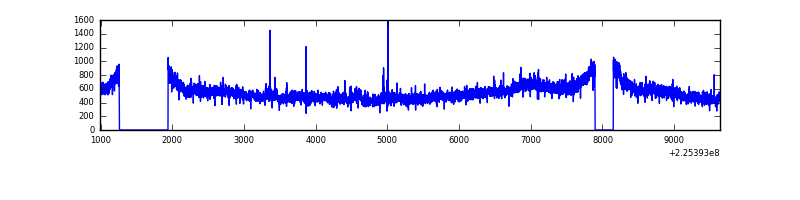 |
| B | 8647 | 7714 | 1 | 1 | 0.01% | 0.01% | 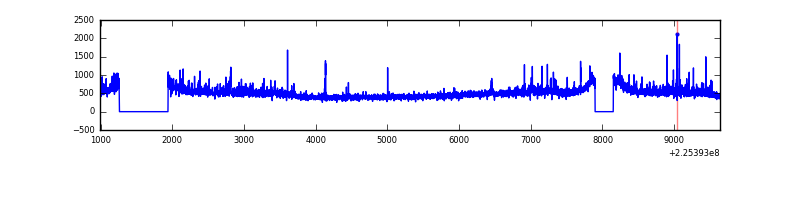 |
| C | 8647 | 7714 | 3 | 3 | 0.03% | 0.04% | 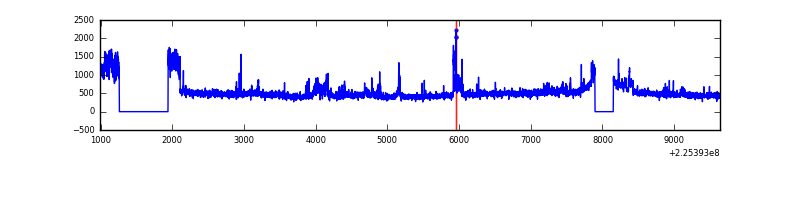 |
| D | 8647 | 7714 | 148 | 148 | 1.71% | 1.92% | 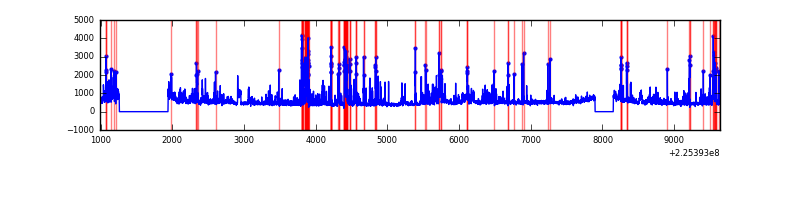 |
Top three noisy pixels from each quadrant. If the there are fewer than three noisy pixels in the level2.evt file, extra rows are filled as -1
| Pixel properties | Quadrant properties | ||||||
|---|---|---|---|---|---|---|---|
| Quadrant | DetID | PixID | Counts | Sigma | Mean | Median | Sigma |
| A | 15 | 239 | 561872 | 2917.12 | 940 | 920 | 192.3 |
| A | 3 | 1 | 14110 | 68.59 | 940 | 920 | 192.3 |
| A | 0 | 226 | 8940 | 41.71 | 940 | 920 | 192.3 |
| B | 11 | 51 | 198257 | 1070.82 | 950 | 925 | 184.3 |
| B | 0 | 214 | 53102 | 283.14 | 950 | 925 | 184.3 |
| B | 12 | 111 | 18743 | 96.69 | 950 | 925 | 184.3 |
| C | 9 | 68 | 644473 | 2981.93 | 916 | 920 | 215.8 |
| C | 8 | 229 | 8844 | 36.72 | 916 | 920 | 215.8 |
| C | 1 | 16 | 7682 | 31.33 | 916 | 920 | 215.8 |
| D | 2 | 152 | 709407 | 3153.08 | 908 | 879 | 224.7 |
| D | 2 | 14 | 520455 | 2312.21 | 908 | 879 | 224.7 |
| D | 5 | 233 | 84871 | 373.78 | 908 | 879 | 224.7 |
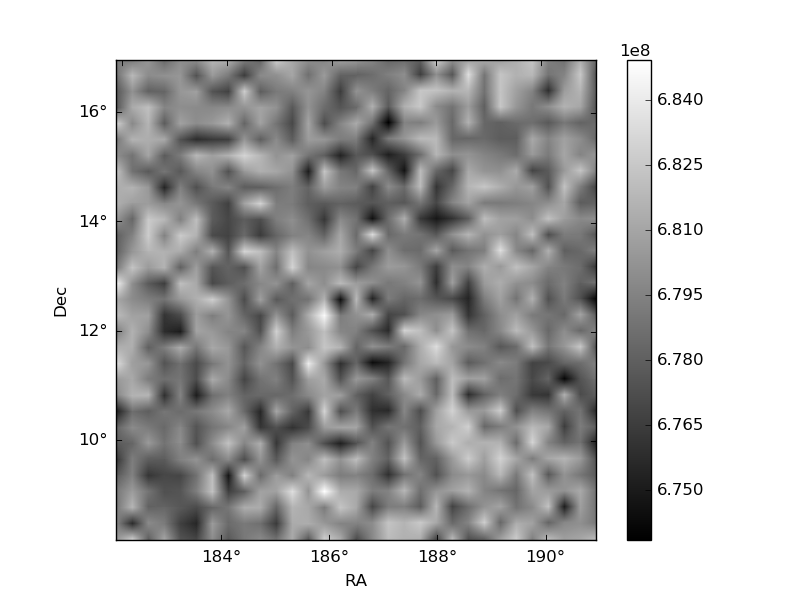
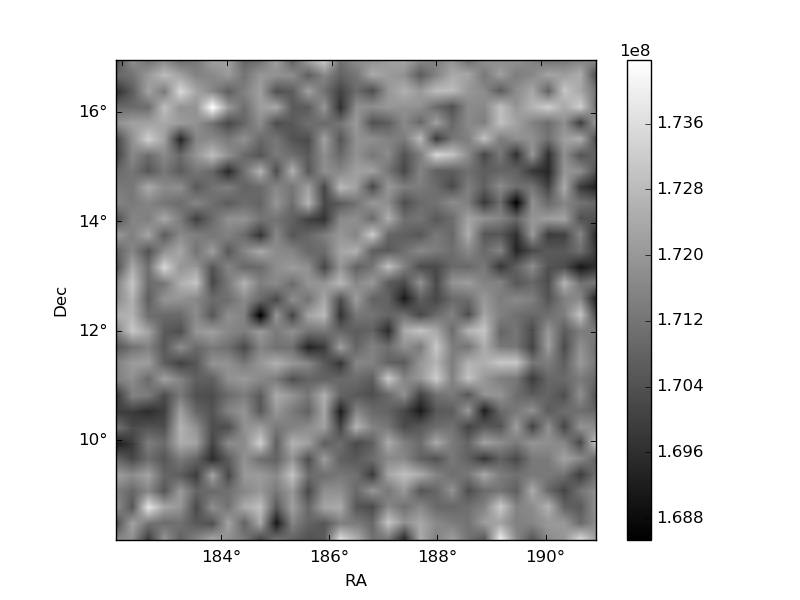
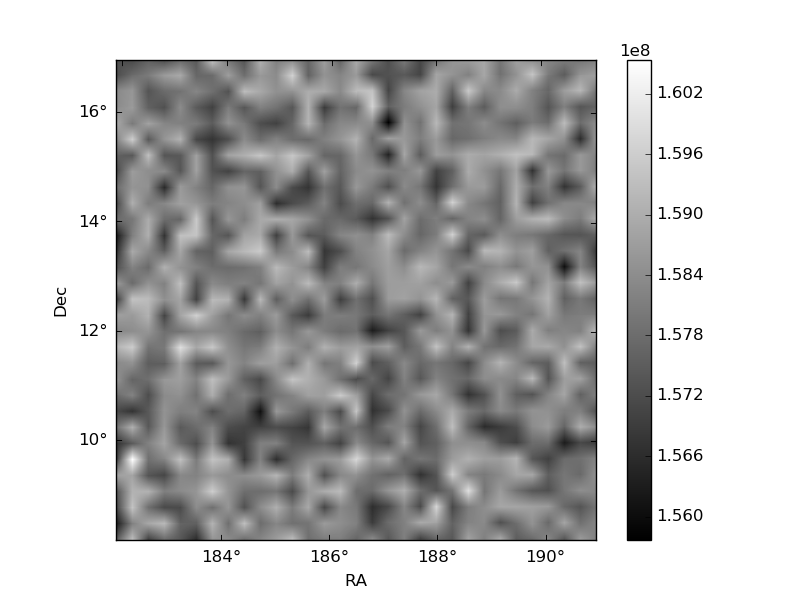
Histogram calculated using DETX and DETY for each event in the final _common_clean file
| Quadrant A | 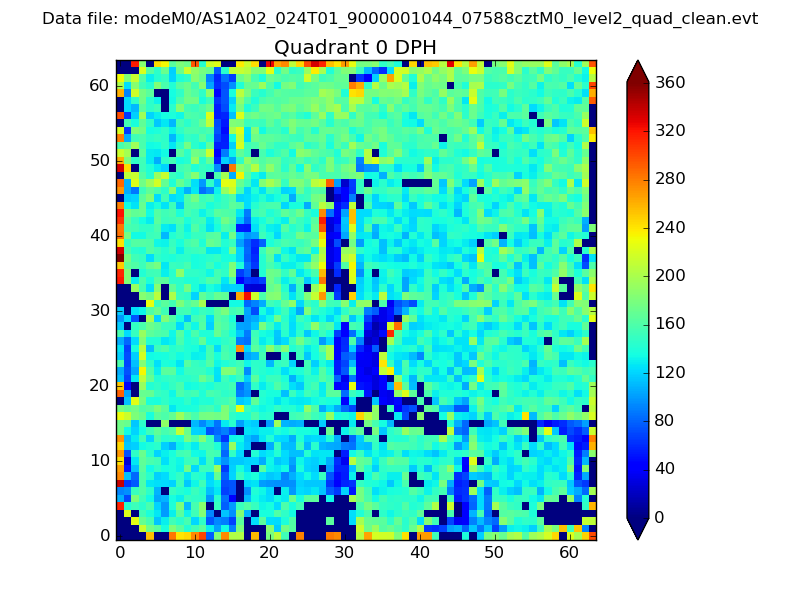 |
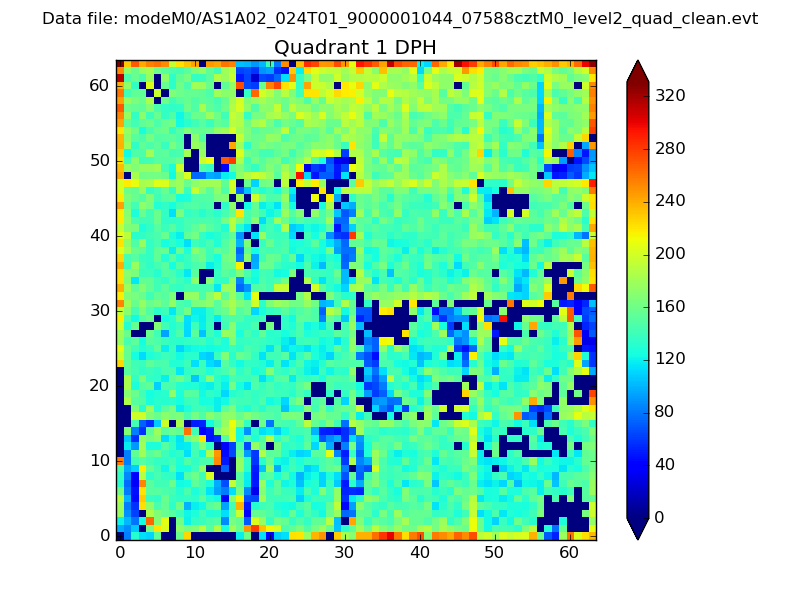 |
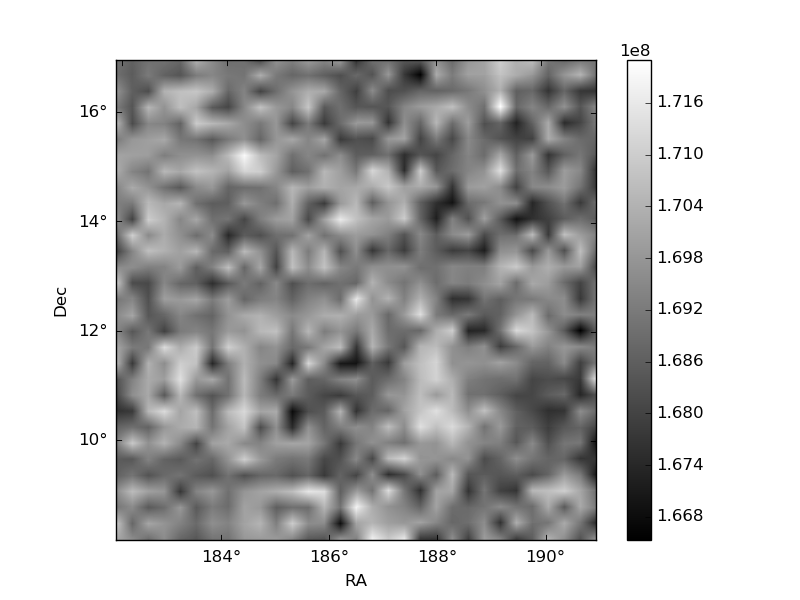
Quadrant B |
|---|---|---|---|
| Quadrant D | 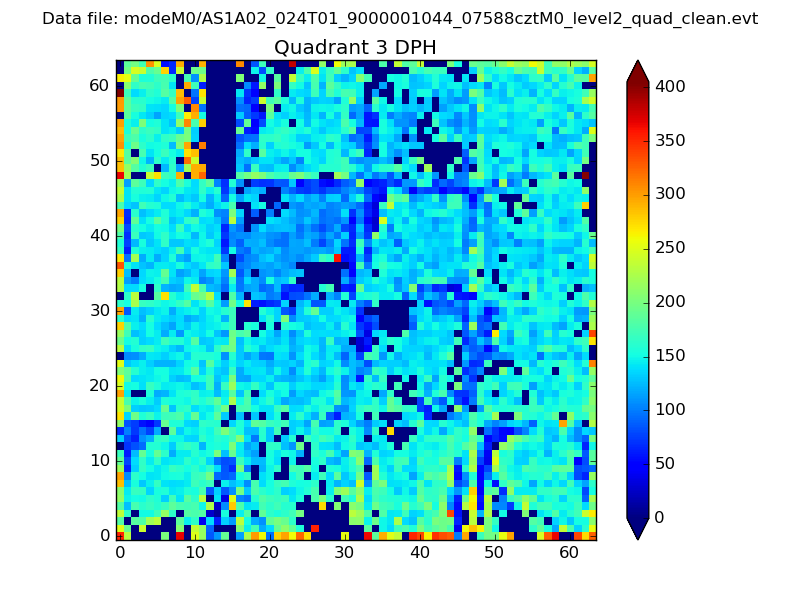 |
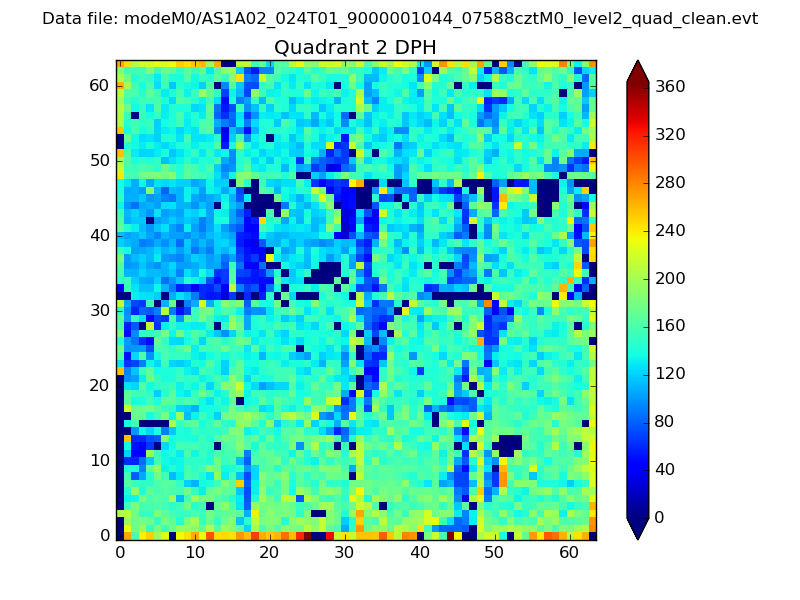 |
Quadrant C |
| Plot type | Count rate plots | Images |
|---|---|---|
| Comparison with Poisson distribution Blue bars denote a histogram of data divided into 1 sec bins. Red curve is a Poisson curve with rate = median count rate of data. |
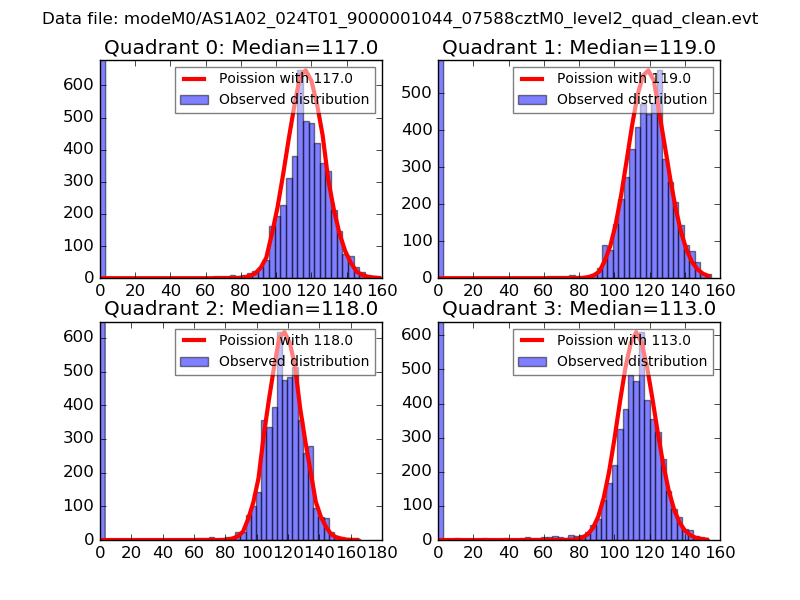 |
 |
| Quadrant-wise count rates Data is divided into 100 sec bins |
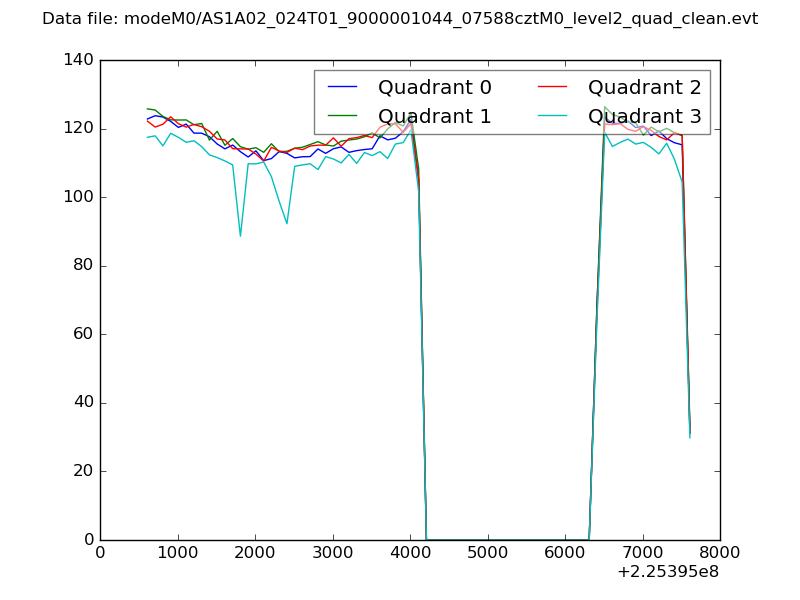 |
|
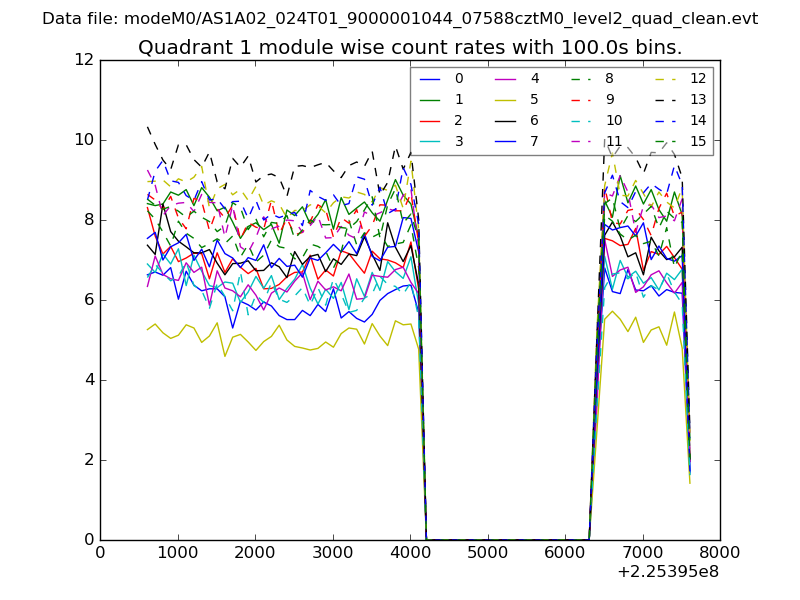
| Module-wise count rates for Quadrant A Data is divided into 100 sec bins |
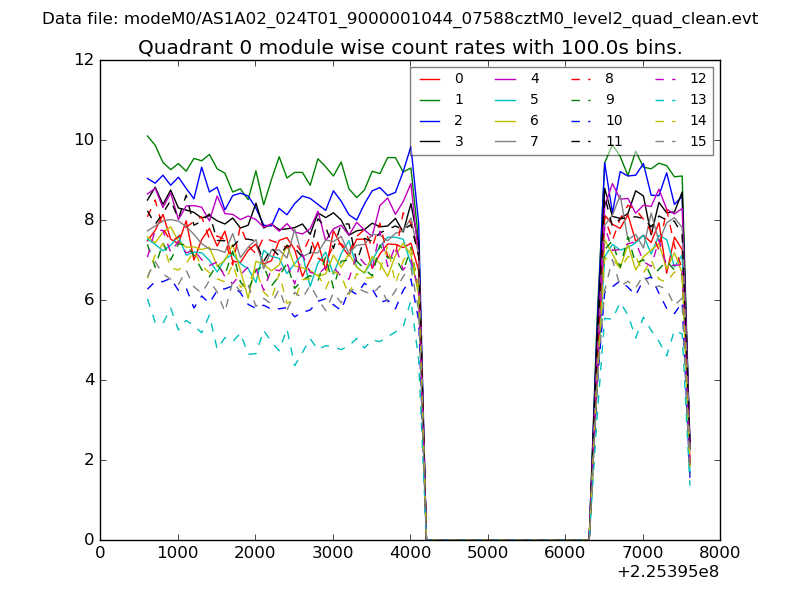 |
 |
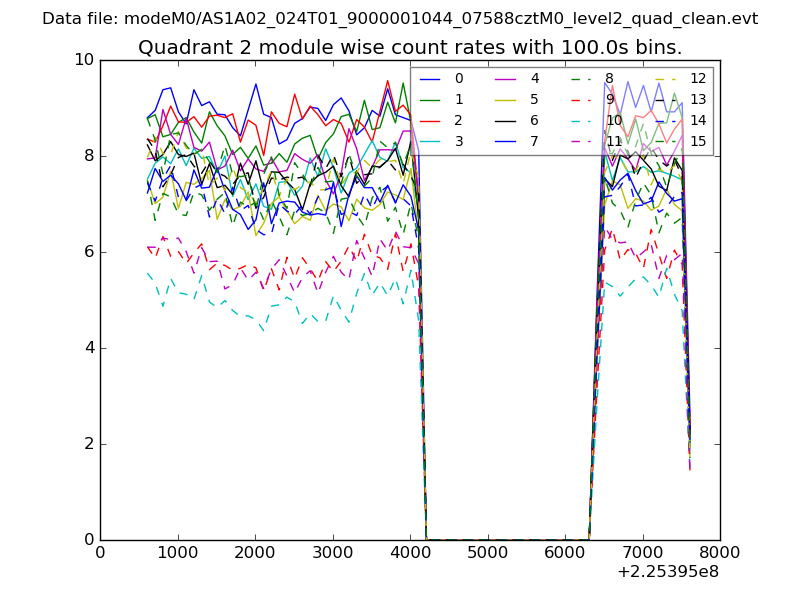
| Module-wise count rates for Quadrant B Data is divided into 100 sec bins |
 |
 |
| Module-wise count rates for Quadrant C Data is divided into 100 sec bins |
 |
 |
| Module-wise count rates for Quadrant D Data is divided into 100 sec bins |
 |
 |
| Parameter | Plot |
|---|---|
| CZT HV Monitor | 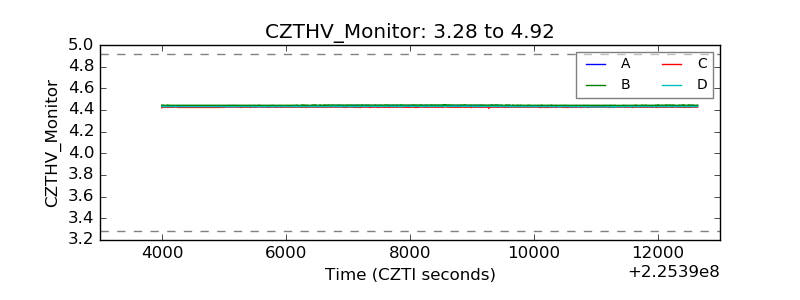 |
| D_VDD | 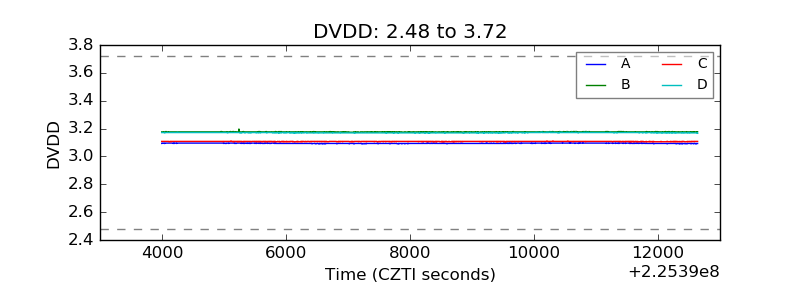 |
| Temperature 1 | 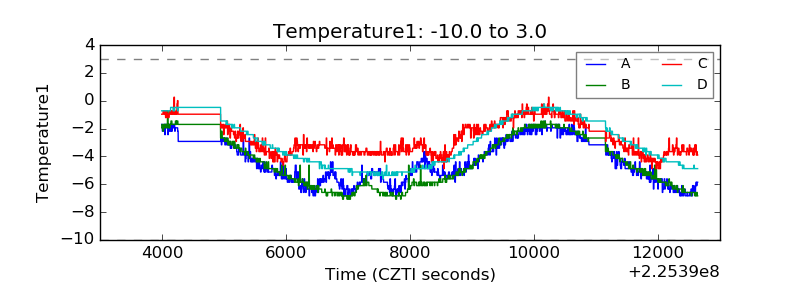 |
| Veto HV Monitor | 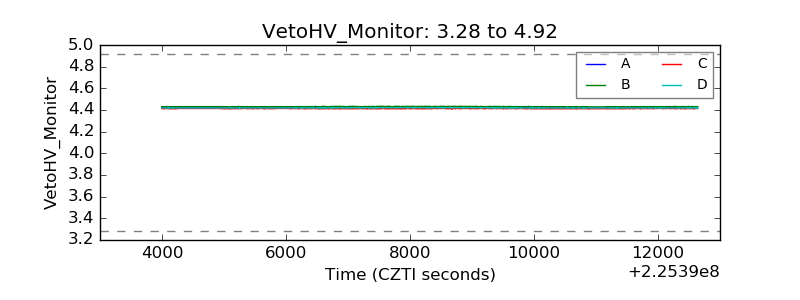 |
| Veto LLD | 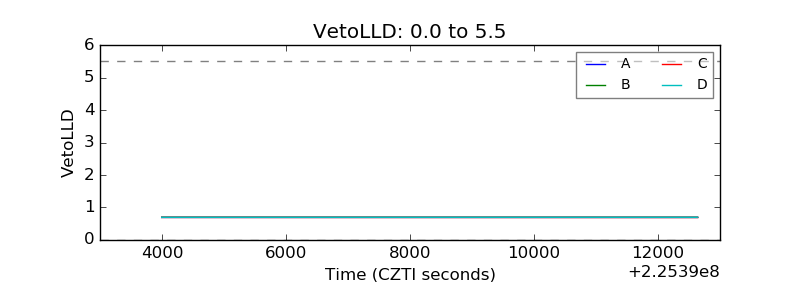 |
| Alpha Counter | 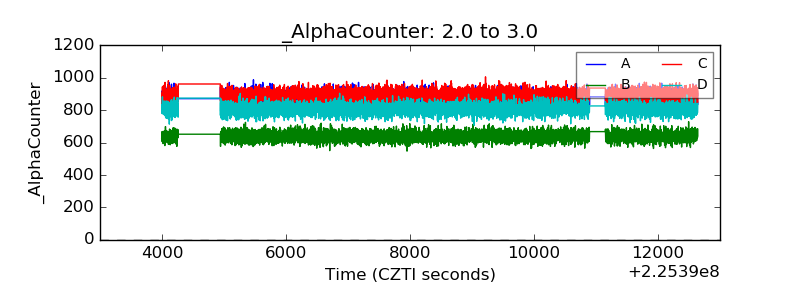 |
| _CPM_Rate | 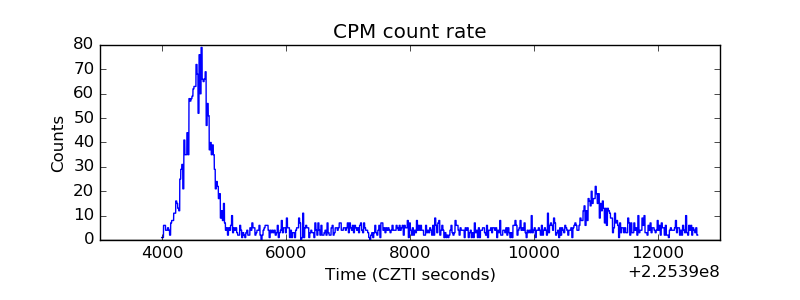 |
| CZT Counter | 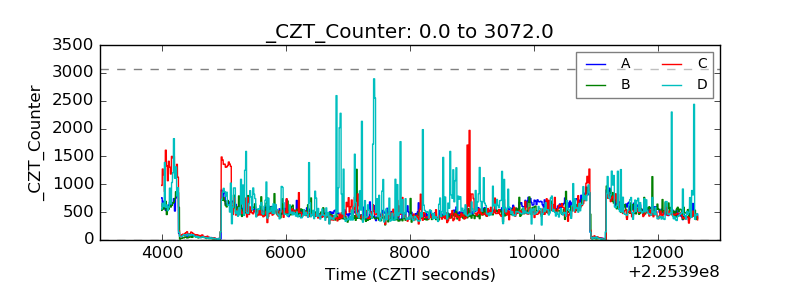 |
| +2.5 Volts monitor |  |
| +5 Volts monitor |  |
| _ROLL_ROT | 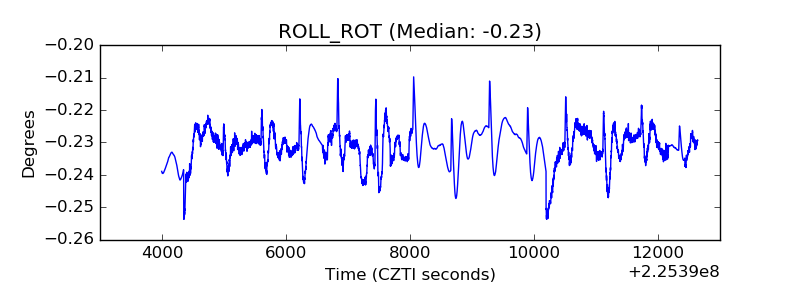 |
| _Roll_DEC |  |
| _Roll_RA | 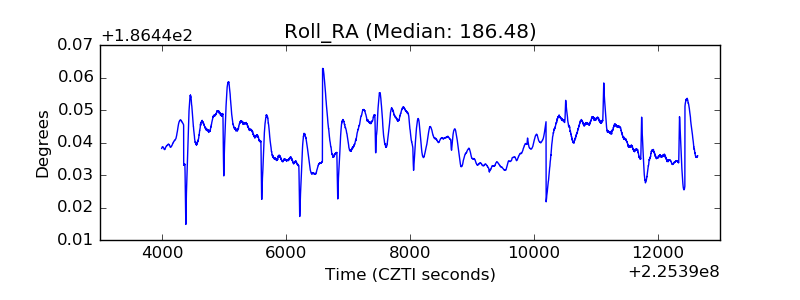 |
| Veto Counter | 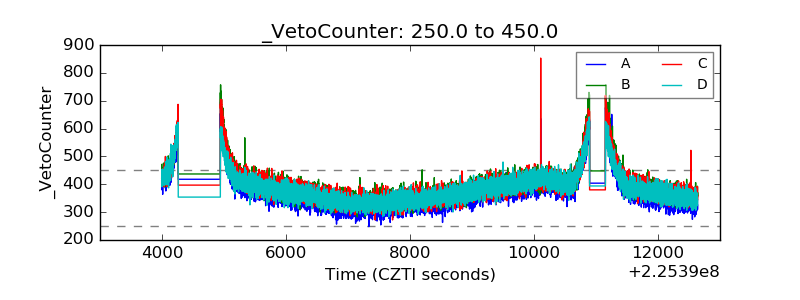 |