| Param | Original file | Final file |
|---|---|---|
| Filename | modeM0/AS1A02_024T01_9000001044_07589cztM0_level2.evt | modeM0/AS1A02_024T01_9000001044_07589cztM0_level2_quad_clean.evt |
| Size (bytes) | 697,858,560 | 95,978,880 |
| Size | 665.5 MB | 91.5 MB |
| Events in quadrant A | 3,884,874 | 609,800 |
| Events in quadrant B | 3,808,737 | 619,536 |
| Events in quadrant C | 7,643,639 | 567,229 |
| Events in quadrant D | 5,281,166 | 579,148 |
| Mode SS | |||
|---|---|---|---|
| Quadrant | BADHDUFLAG | Total packets | Discarded packets |
| A | 0 | 154 | 0 |
| B | 0 | 154 | 0 |
| C | 0 | 154 | 0 |
| D | 0 | 154 | 0 |
| Mode M0 | |||
|---|---|---|---|
| Quadrant | BADHDUFLAG | Total packets | Discarded packets |
| A | 0 | 16598 | 2 |
| B | 0 | 16547 | 1 |
| C | 0 | 28147 | 1 |
| D | 0 | 21101 | 1 |
| Mode M9 | |||
|---|---|---|---|
| Quadrant | BADHDUFLAG | Total packets | Discarded packets |
| A | 0 | 2 | 0 |
| B | 0 | 2 | 0 |
| C | 0 | 2 | 0 |
| D | 0 | 2 | 0 |
| Quadrant | Total seconds | Saturated seconds | Saturation percentage |
|---|---|---|---|
| A | 7633 | 108 | 1.414909% |
| B | 7633 | 164 | 2.148565% |
| C | 7633 | 1552 | 20.332766% |
| D | 7633 | 403 | 5.279707% |
Noise dominated data is calculated using 1-second bins in cleaned event files. If a bin has >2000 counts, and if more than 50% of those come from <1% of pixels, then it is considered to be noise-dominated and hence unusable.
| Quadrant | # 1 sec bins | Bins with >0 counts | Bins with >2000 counts | High rate bins dominated by noise | Noise dominated (total time) | Noise dominated (detector-on time) | Marked lightcurve |
|---|---|---|---|---|---|---|---|
| A | 7728 | 7636 | 0 | 0 | 0.00% | 0.00% |  |
| B | 7728 | 7636 | 4 | 4 | 0.05% | 0.05% |  |
| C | 7727 | 7635 | 1157 | 1157 | 14.97% | 15.15% |  |
| D | 7728 | 7636 | 252 | 252 | 3.26% | 3.30% |  |
Top three noisy pixels from each quadrant. If the there are fewer than three noisy pixels in the level2.evt file, extra rows are filled as -1
| Pixel properties | Quadrant properties | ||||||
|---|---|---|---|---|---|---|---|
| Quadrant | DetID | PixID | Counts | Sigma | Mean | Median | Sigma |
| A | 15 | 239 | 347560 | 1822.98 | 919 | 898 | 190.2 |
| A | 0 | 226 | 8774 | 41.41 | 919 | 898 | 190.2 |
| A | 12 | 194 | 8075 | 37.74 | 919 | 898 | 190.2 |
| B | 11 | 51 | 122616 | 672.56 | 930 | 906 | 181.0 |
| B | 0 | 214 | 60427 | 328.91 | 930 | 906 | 181.0 |
| B | 12 | 111 | 18998 | 99.97 | 930 | 906 | 181.0 |
| C | 9 | 68 | 4416756 | 22963.74 | 822 | 826 | 192.3 |
| C | 1 | 16 | 6878 | 31.47 | 822 | 826 | 192.3 |
| C | 13 | 61 | 6447 | 29.23 | 822 | 826 | 192.3 |
| D | 5 | 233 | 827242 | 3835.27 | 873 | 845 | 215.5 |
| D | 2 | 152 | 632046 | 2929.37 | 873 | 845 | 215.5 |
| D | 2 | 14 | 338968 | 1569.21 | 873 | 845 | 215.5 |
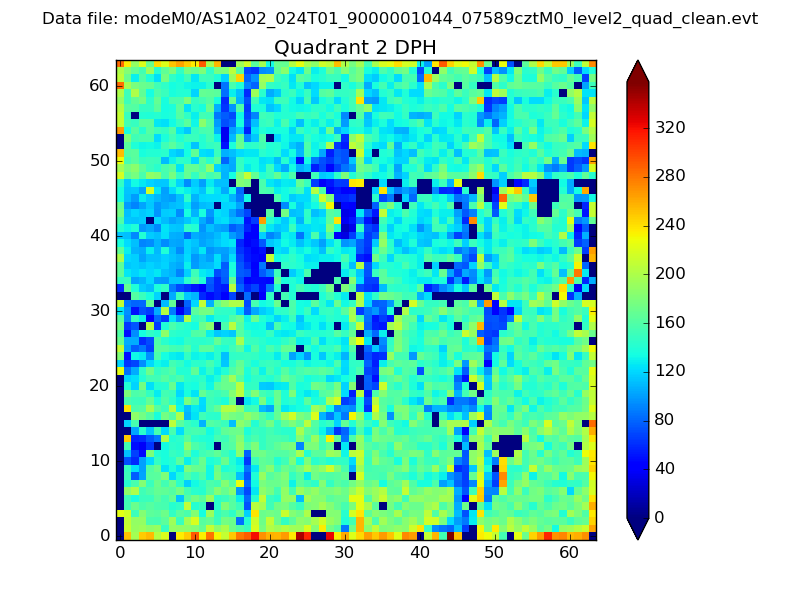
Histogram calculated using DETX and DETY for each event in the final _common_clean file
| Quadrant A | 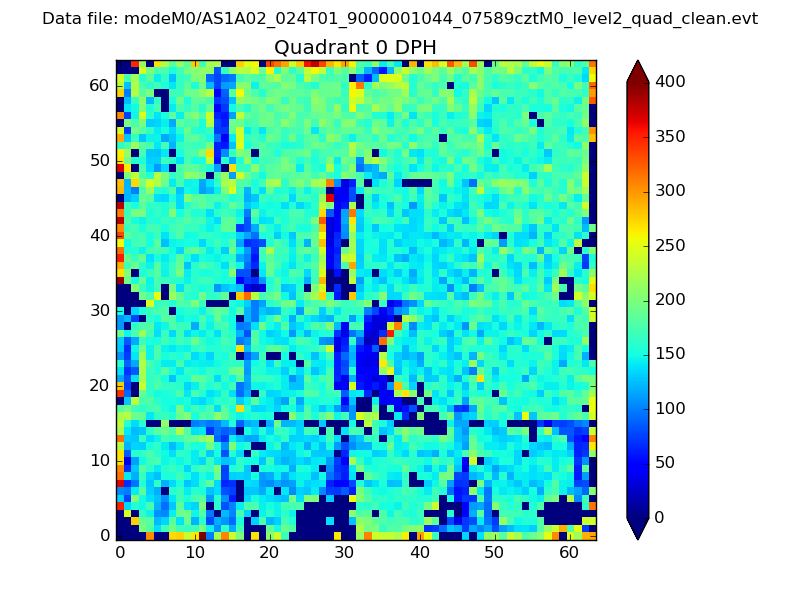 |
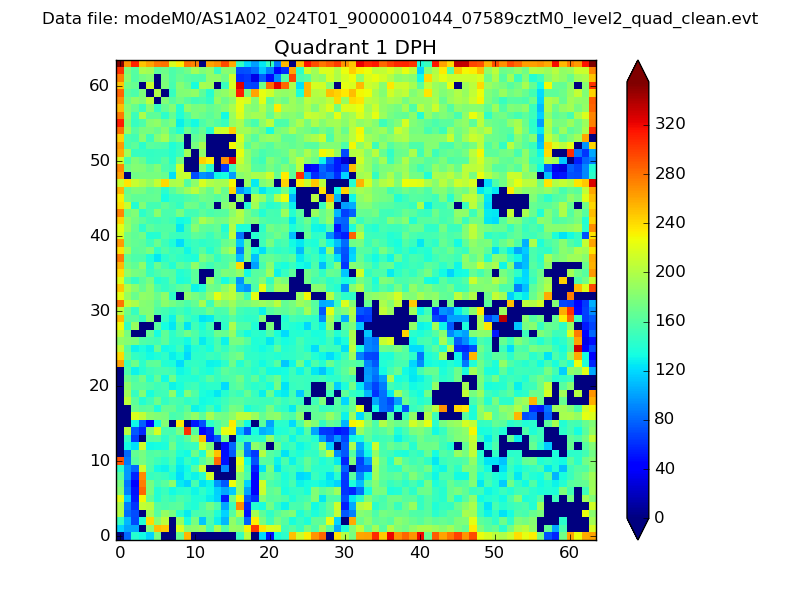 |
Quadrant B |
|---|---|---|---|
| Quadrant D | 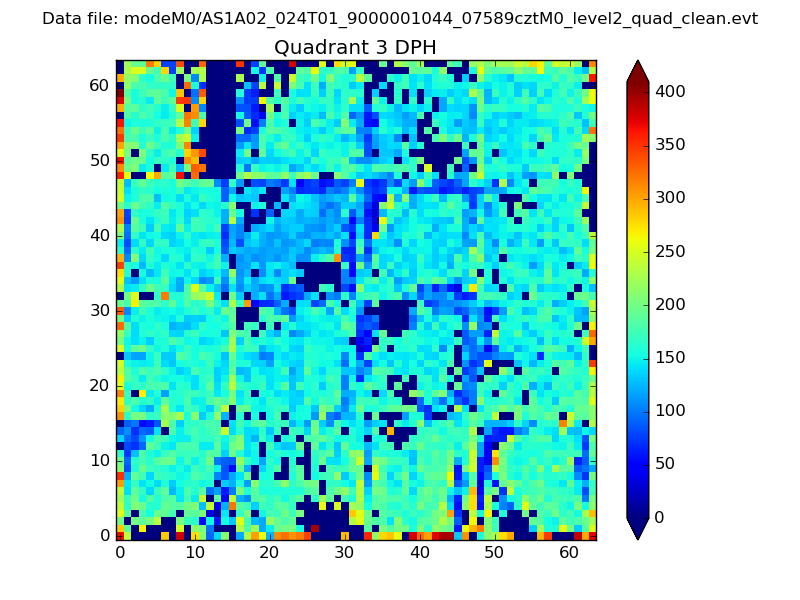 |
 |
Quadrant C |
| Plot type | Count rate plots | Images |
|---|---|---|
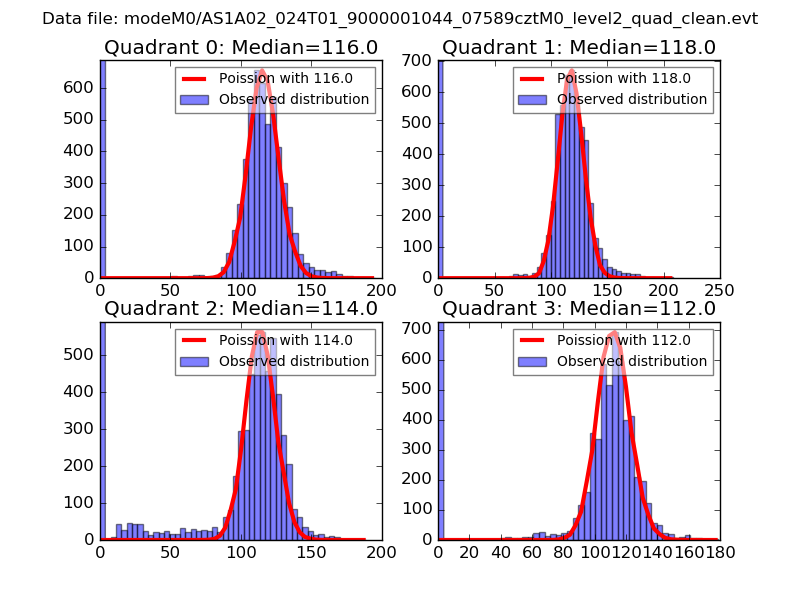
| Comparison with Poisson distribution Blue bars denote a histogram of data divided into 1 sec bins. Red curve is a Poisson curve with rate = median count rate of data. |
 |
 |
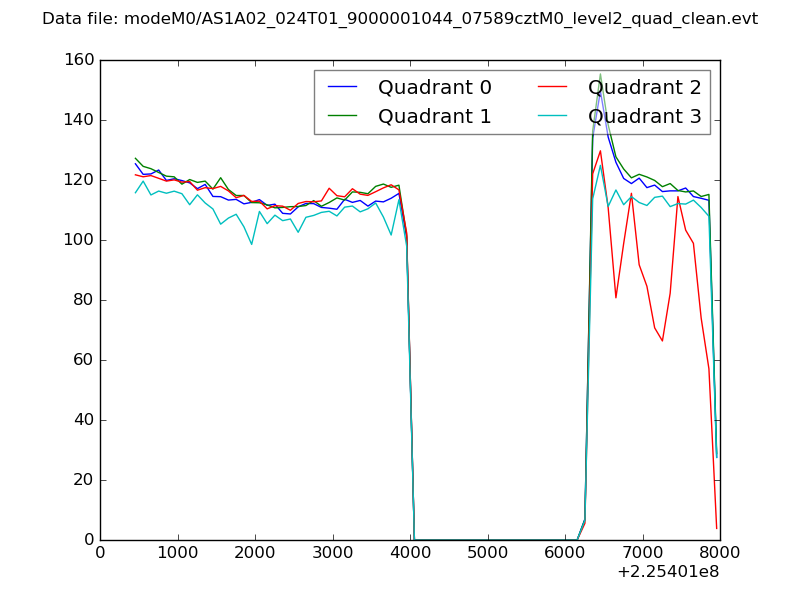
| Quadrant-wise count rates Data is divided into 100 sec bins |
 |
|
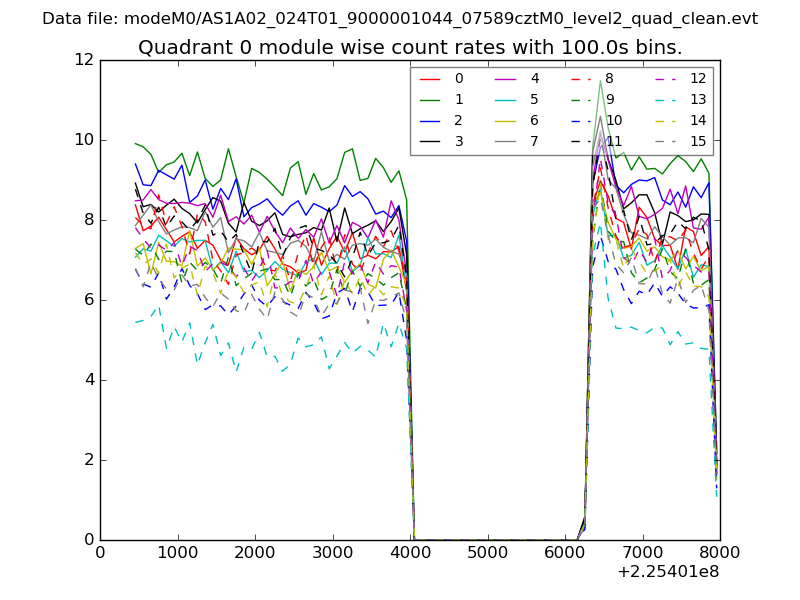
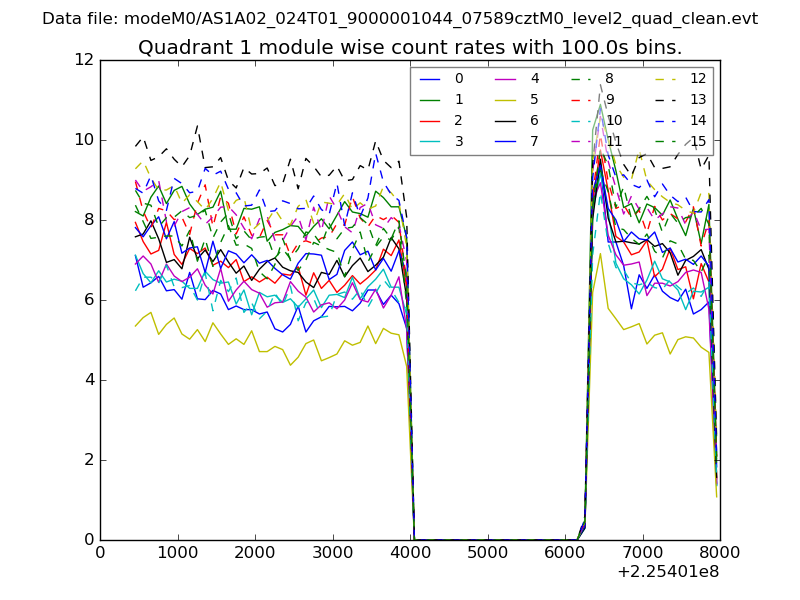
| Module-wise count rates for Quadrant A Data is divided into 100 sec bins |
 |
 |
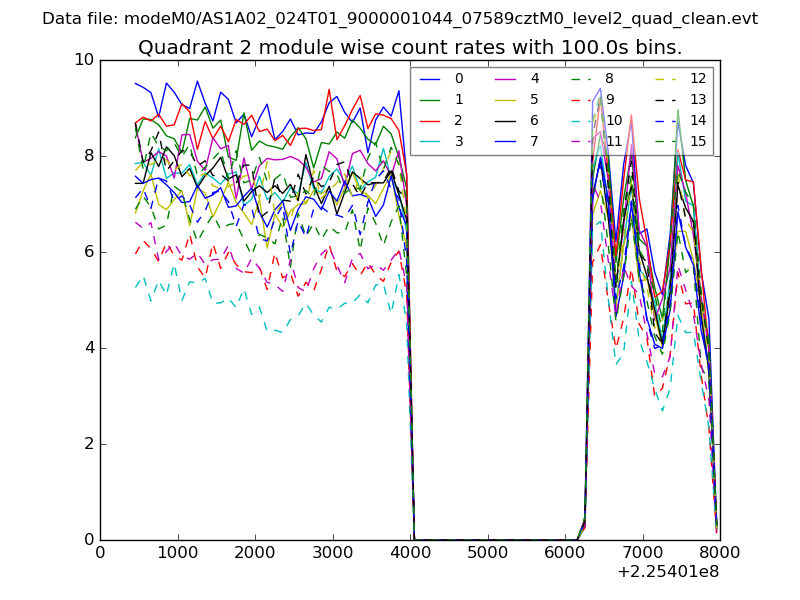
| Module-wise count rates for Quadrant B Data is divided into 100 sec bins |
 |
 |
| Module-wise count rates for Quadrant C Data is divided into 100 sec bins |
 |
 |
| Module-wise count rates for Quadrant D Data is divided into 100 sec bins |
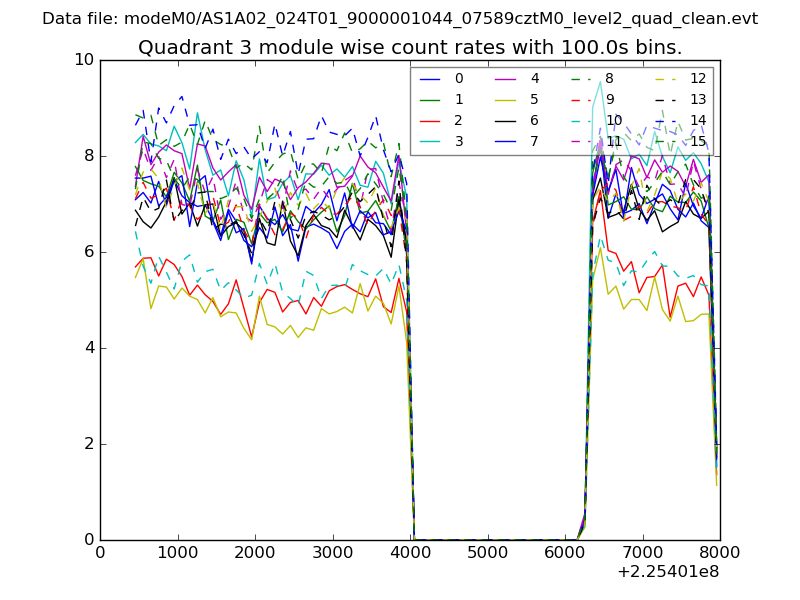 |
 |
| Parameter | Plot |
|---|---|
| CZT HV Monitor | 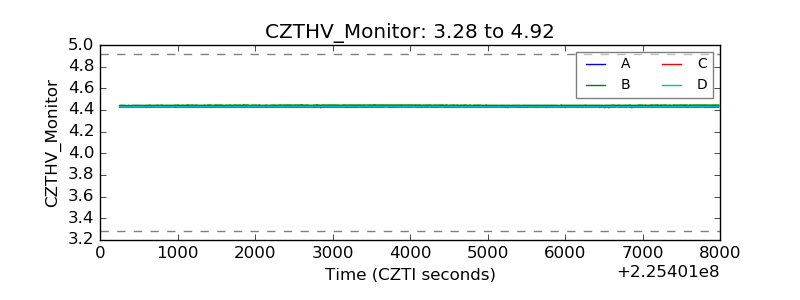 |
| D_VDD | 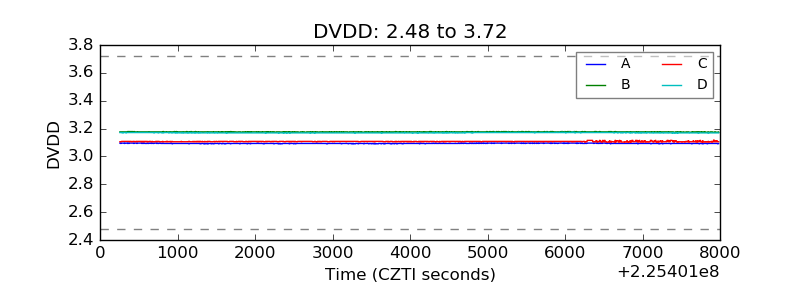 |
| Temperature 1 |  |
| Veto HV Monitor | 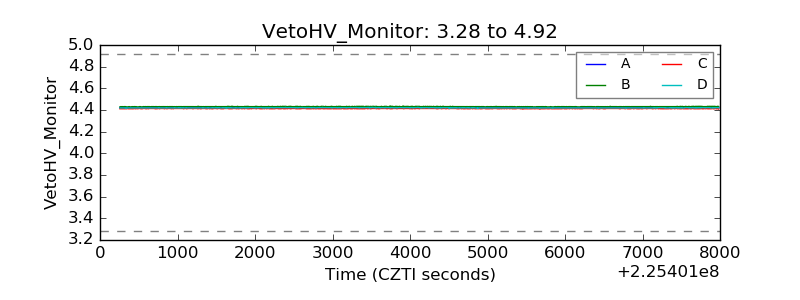 |
| Veto LLD | 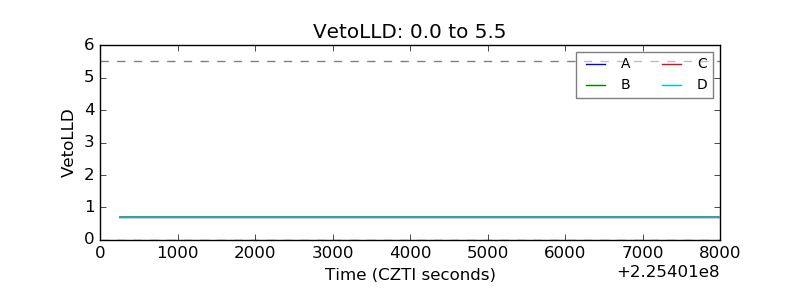 |
| Alpha Counter | 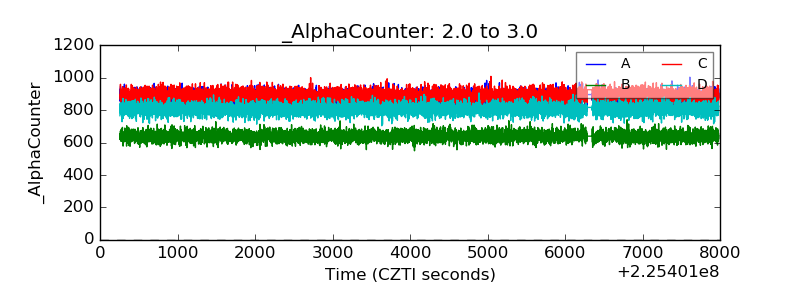 |
| _CPM_Rate | 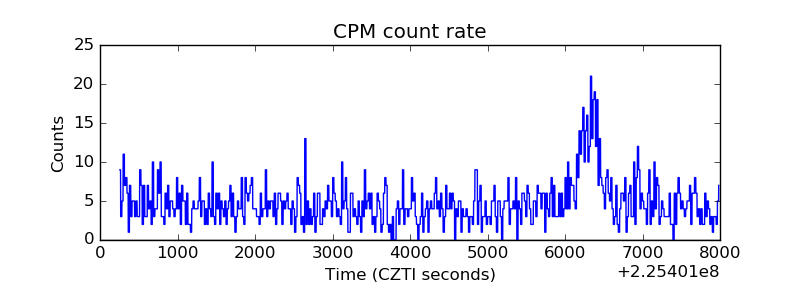 |
| CZT Counter | 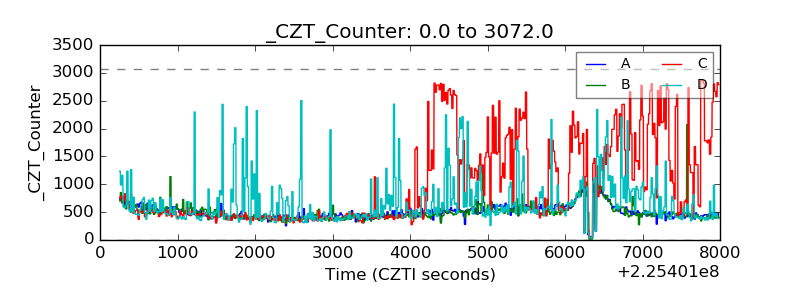 |
| +2.5 Volts monitor |  |
| +5 Volts monitor |  |
| _ROLL_ROT |  |
| _Roll_DEC |  |
| _Roll_RA | 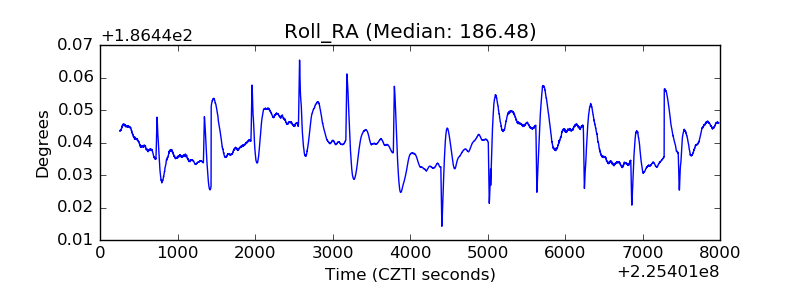 |
| Veto Counter | 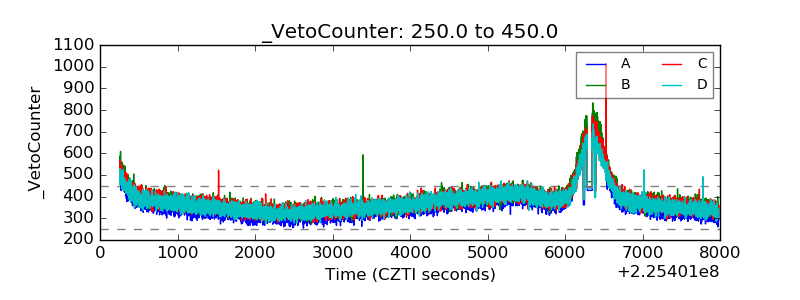 |