| Param | Original file | Final file |
|---|---|---|
| Filename | modeM0/AS1A02_024T01_9000001044_07590cztM0_level2.evt | modeM0/AS1A02_024T01_9000001044_07590cztM0_level2_quad_clean.evt |
| Size (bytes) | 834,721,920 | 76,426,560 |
| Size | 796.1 MB | 72.9 MB |
| Events in quadrant A | 3,274,485 | 510,557 |
| Events in quadrant B | 3,131,779 | 520,284 |
| Events in quadrant C | 14,068,021 | 327,933 |
| Events in quadrant D | 4,356,041 | 490,704 |
| Mode SS | |||
|---|---|---|---|
| Quadrant | BADHDUFLAG | Total packets | Discarded packets |
| A | 0 | 134 | 0 |
| B | 0 | 134 | 0 |
| C | 0 | 134 | 0 |
| D | 0 | 134 | 0 |
| Mode M0 | |||
|---|---|---|---|
| Quadrant | BADHDUFLAG | Total packets | Discarded packets |
| A | 0 | 14054 | 3 |
| B | 0 | 13823 | 1 |
| C | 0 | 46298 | 1 |
| D | 0 | 17658 | 1 |
| Mode M9 | |||
|---|---|---|---|
| Quadrant | BADHDUFLAG | Total packets | Discarded packets |
| A | 0 | 3 | 0 |
| B | 0 | 3 | 0 |
| C | 0 | 3 | 0 |
| D | 0 | 3 | 0 |
| Quadrant | Total seconds | Saturated seconds | Saturation percentage |
|---|---|---|---|
| A | 6648 | 72 | 1.083032% |
| B | 6649 | 87 | 1.308467% |
| C | 6649 | 4752 | 71.469394% |
| D | 6649 | 259 | 3.895323% |
Noise dominated data is calculated using 1-second bins in cleaned event files. If a bin has >2000 counts, and if more than 50% of those come from <1% of pixels, then it is considered to be noise-dominated and hence unusable.
| Quadrant | # 1 sec bins | Bins with >0 counts | Bins with >2000 counts | High rate bins dominated by noise | Noise dominated (total time) | Noise dominated (detector-on time) | Marked lightcurve |
|---|---|---|---|---|---|---|---|
| A | 6969 | 6650 | 0 | 0 | 0.00% | 0.00% | 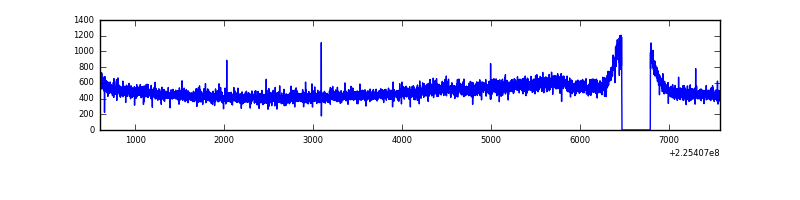 |
| B | 6969 | 6650 | 0 | 0 | 0.00% | 0.00% | 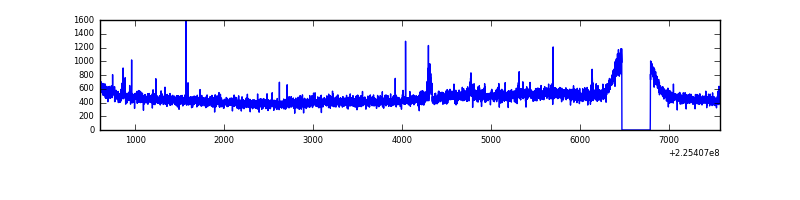 |
| C | 6969 | 6650 | 4306 | 4306 | 61.79% | 64.75% | 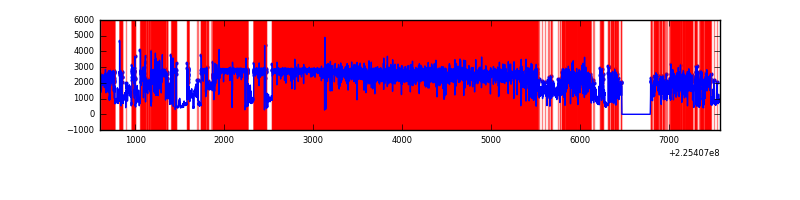 |
| D | 6969 | 6650 | 184 | 184 | 2.64% | 2.77% | 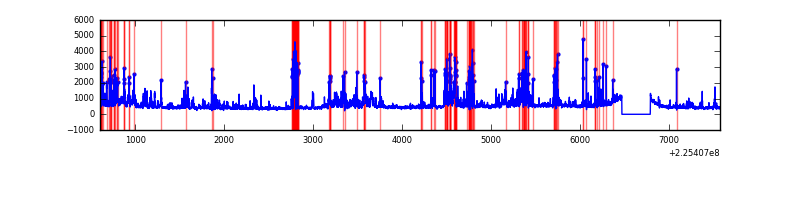 |
Top three noisy pixels from each quadrant. If the there are fewer than three noisy pixels in the level2.evt file, extra rows are filled as -1
| Pixel properties | Quadrant properties | ||||||
|---|---|---|---|---|---|---|---|
| Quadrant | DetID | PixID | Counts | Sigma | Mean | Median | Sigma |
| A | 15 | 239 | 252416 | 1551.73 | 785 | 767 | 162.2 |
| A | 0 | 226 | 7509 | 41.57 | 785 | 767 | 162.2 |
| A | 12 | 194 | 6858 | 37.56 | 785 | 767 | 162.2 |
| B | 0 | 214 | 22361 | 139.91 | 795 | 776 | 154.3 |
| B | 12 | 111 | 16078 | 99.18 | 795 | 776 | 154.3 |
| B | 11 | 111 | 13058 | 79.61 | 795 | 776 | 154.3 |
| C | 9 | 68 | 11955545 | 95761.71 | 535 | 539 | 124.8 |
| C | 8 | 128 | 9081 | 68.42 | 535 | 539 | 124.8 |
| C | 1 | 16 | 6095 | 44.5 | 535 | 539 | 124.8 |
| D | 5 | 233 | 762985 | 4088.29 | 756 | 732 | 186.4 |
| D | 2 | 152 | 363110 | 1943.59 | 756 | 732 | 186.4 |
| D | 2 | 14 | 358426 | 1918.46 | 756 | 732 | 186.4 |
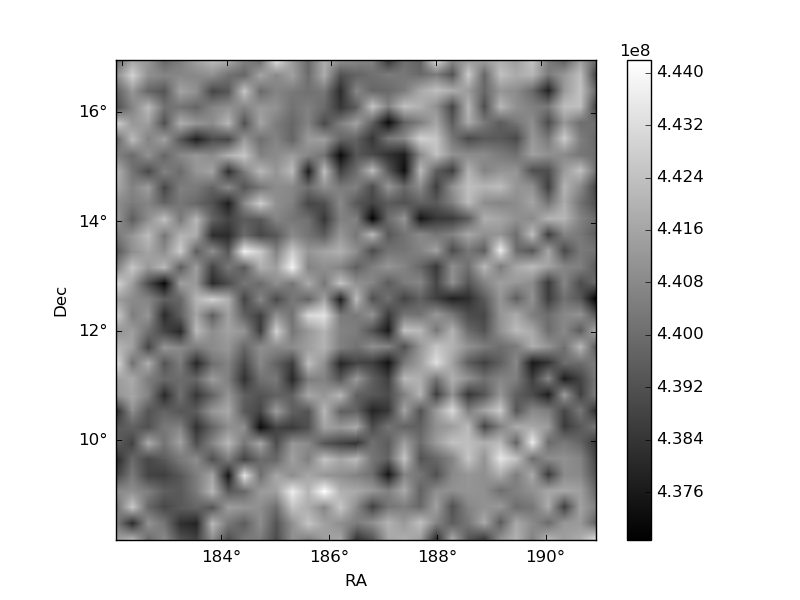
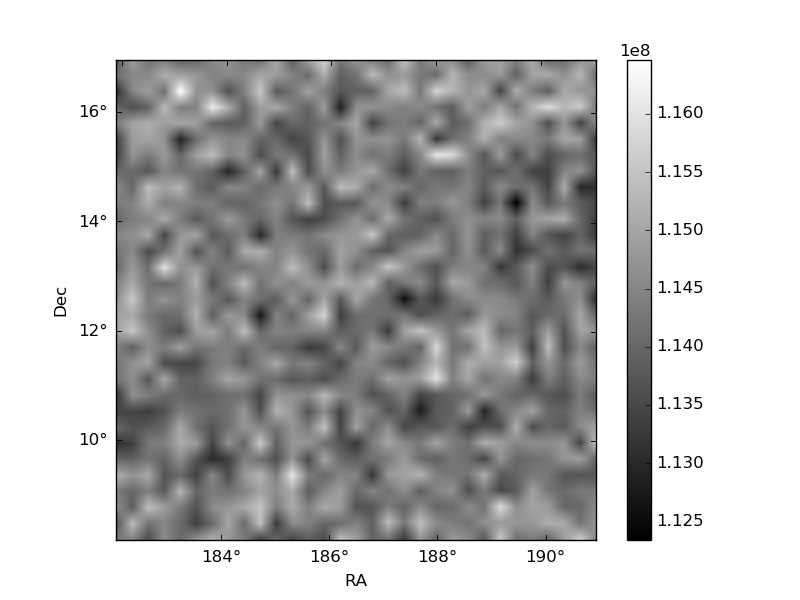
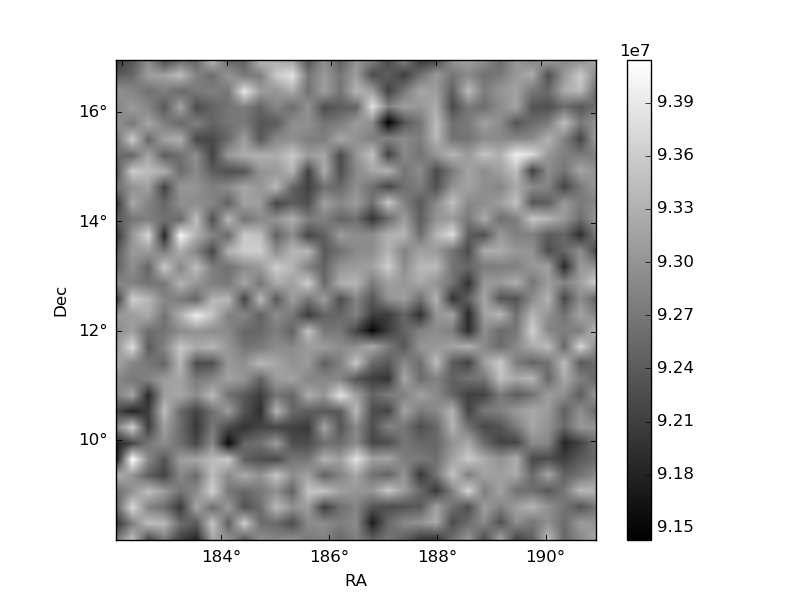
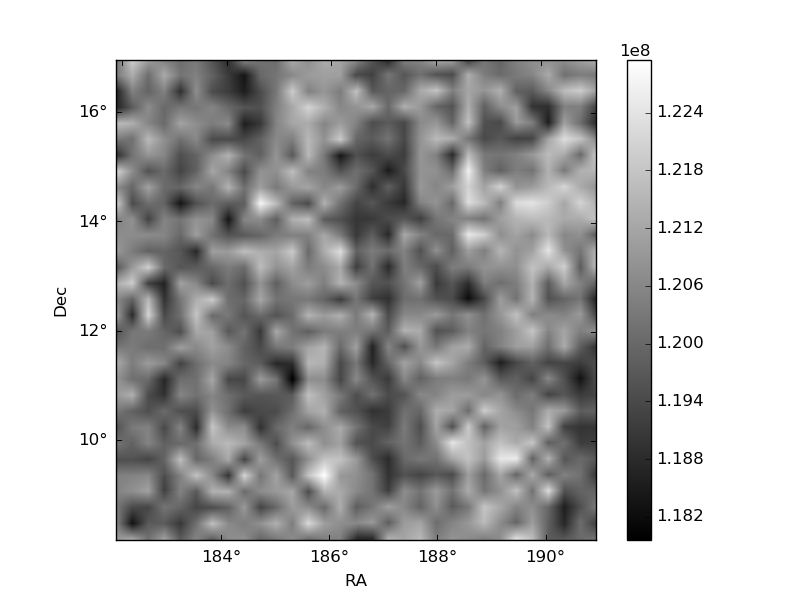
Histogram calculated using DETX and DETY for each event in the final _common_clean file
| Quadrant A | 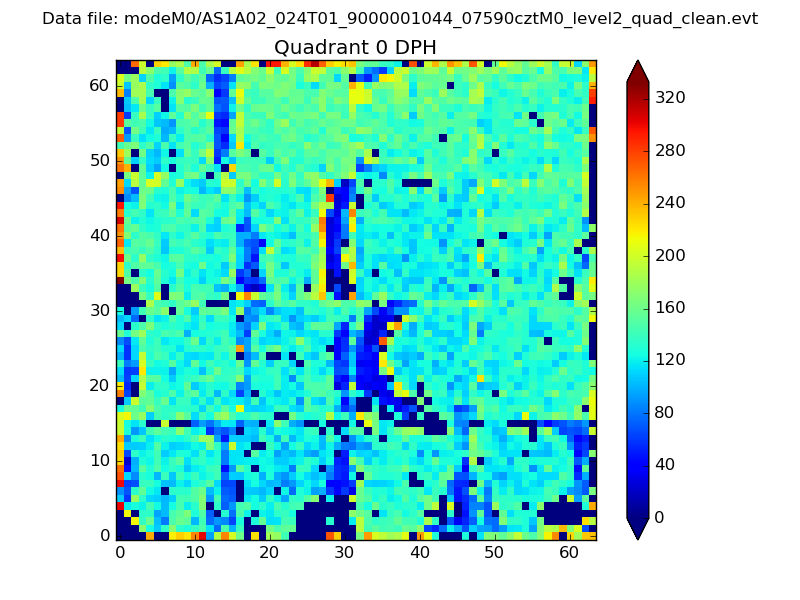 |
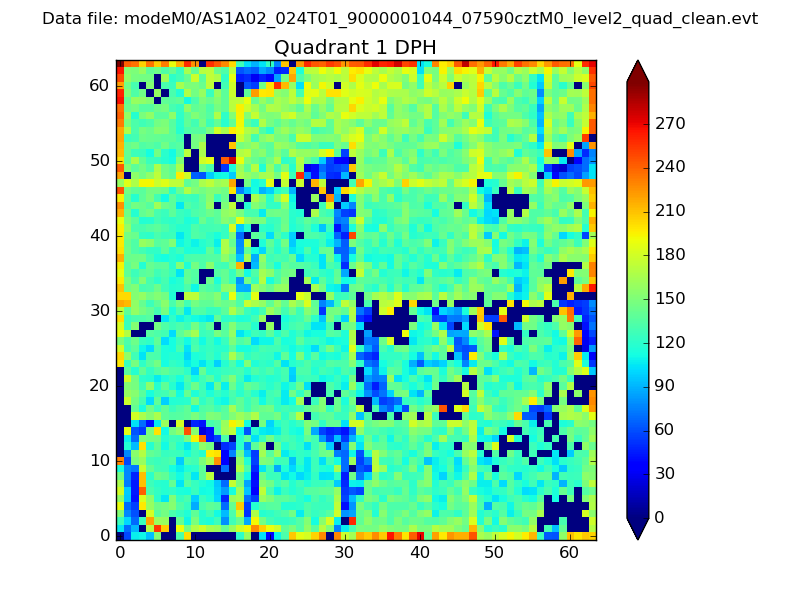 |
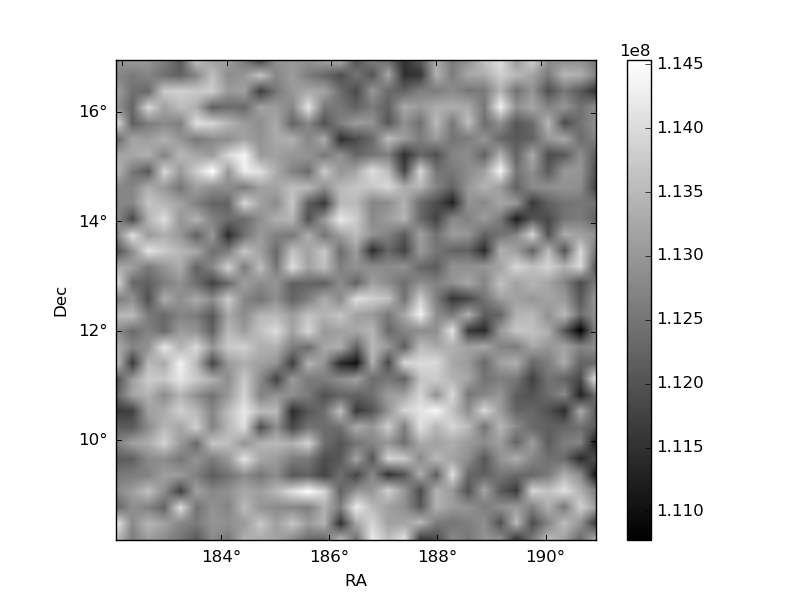
Quadrant B |
|---|---|---|---|
| Quadrant D | 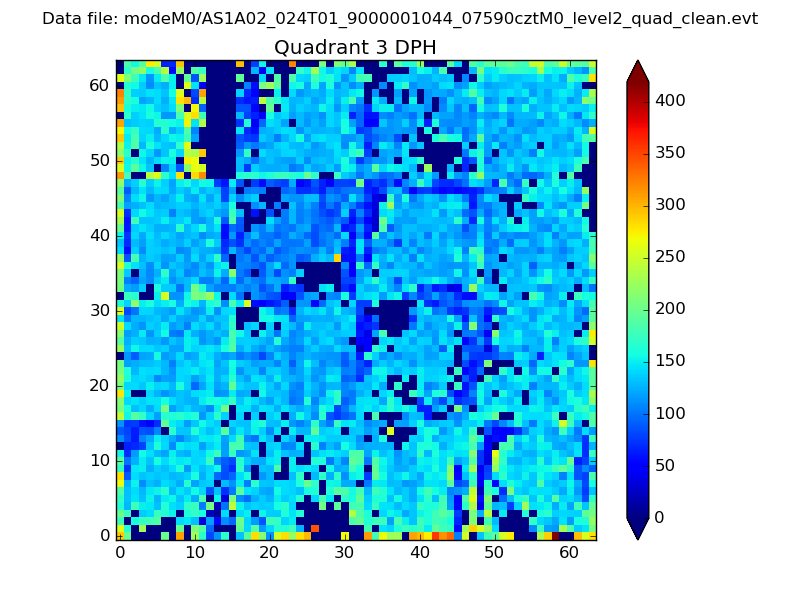 |
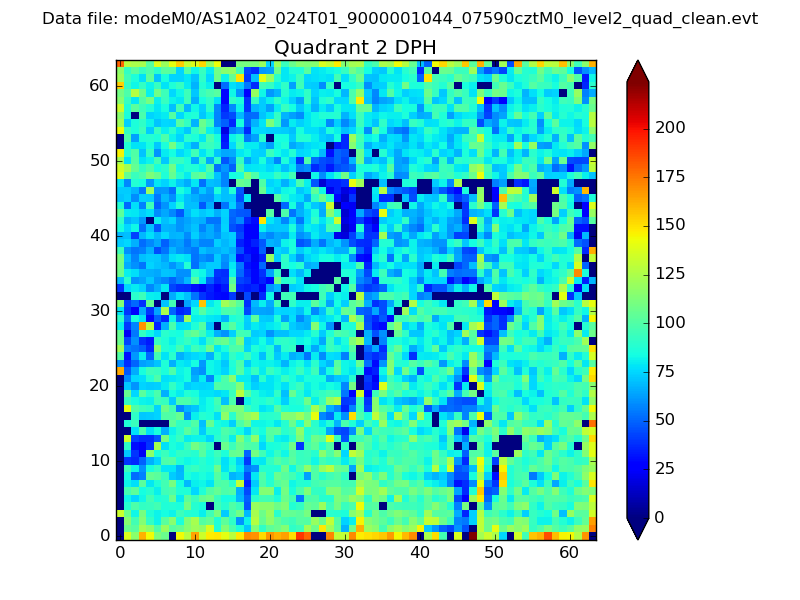 |
Quadrant C |
| Plot type | Count rate plots | Images |
|---|---|---|
| Comparison with Poisson distribution Blue bars denote a histogram of data divided into 1 sec bins. Red curve is a Poisson curve with rate = median count rate of data. |
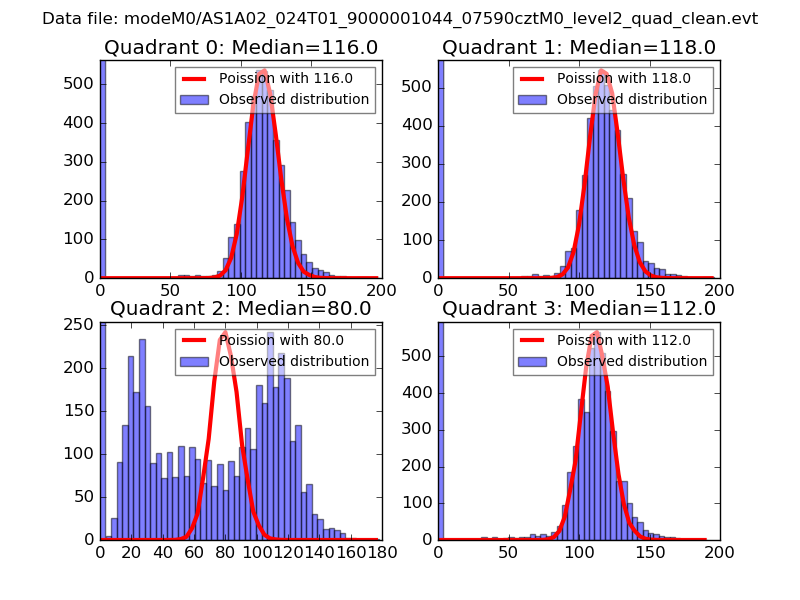 |
 |
| Quadrant-wise count rates Data is divided into 100 sec bins |
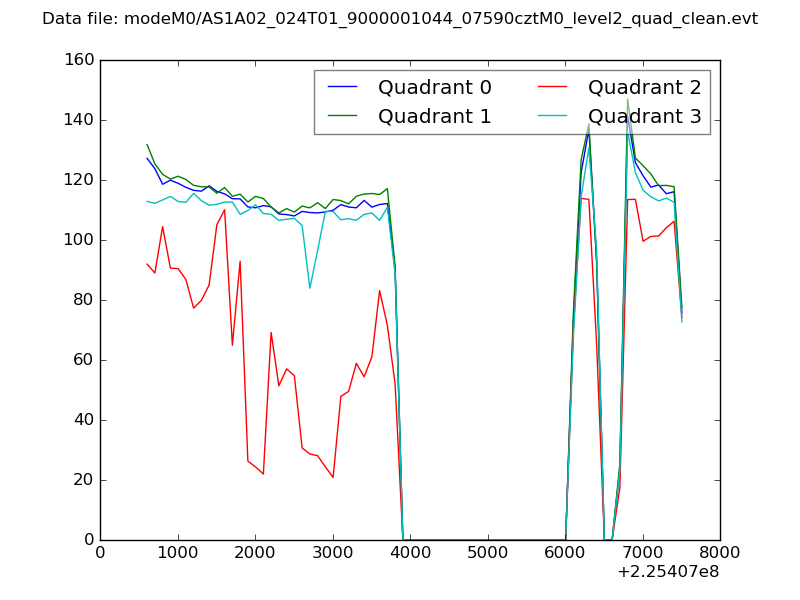 |
|
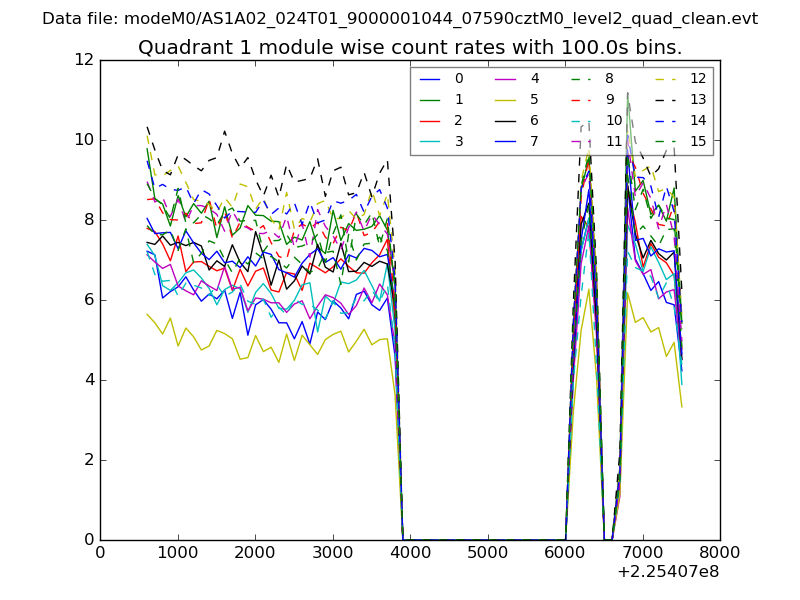
| Module-wise count rates for Quadrant A Data is divided into 100 sec bins |
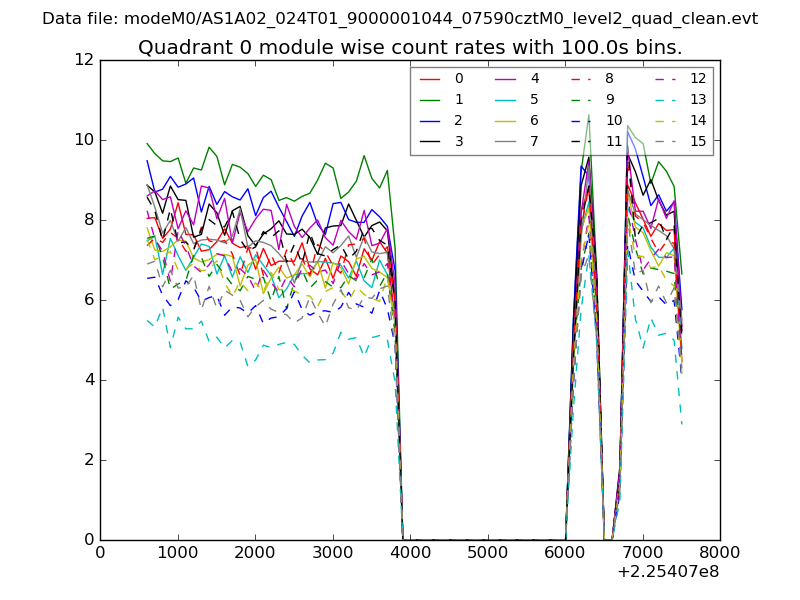 |
 |
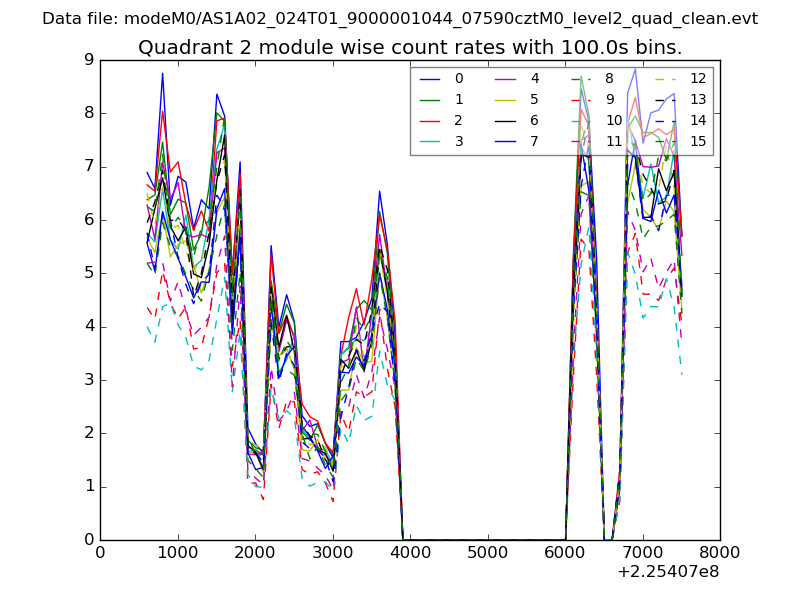
| Module-wise count rates for Quadrant B Data is divided into 100 sec bins |
 |
 |
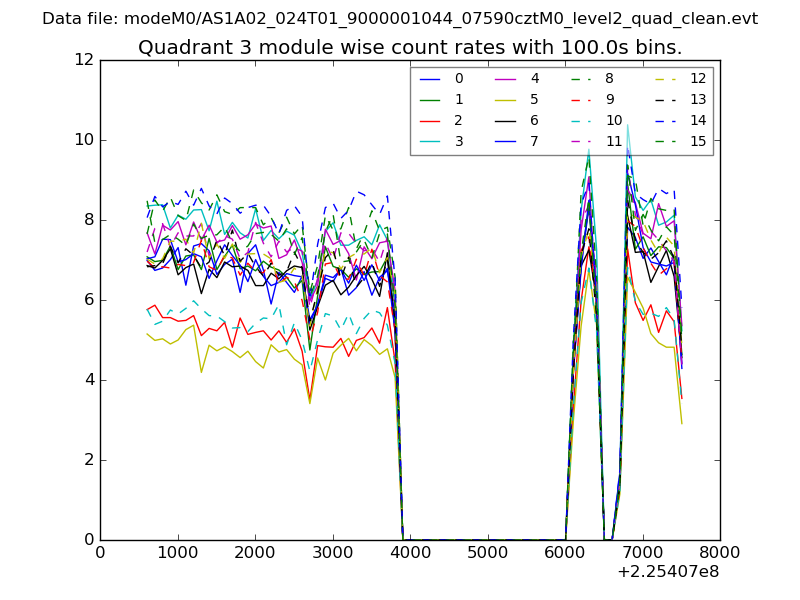
| Module-wise count rates for Quadrant C Data is divided into 100 sec bins |
 |
 |
| Module-wise count rates for Quadrant D Data is divided into 100 sec bins |
 |
 |
| Parameter | Plot |
|---|---|
| CZT HV Monitor | 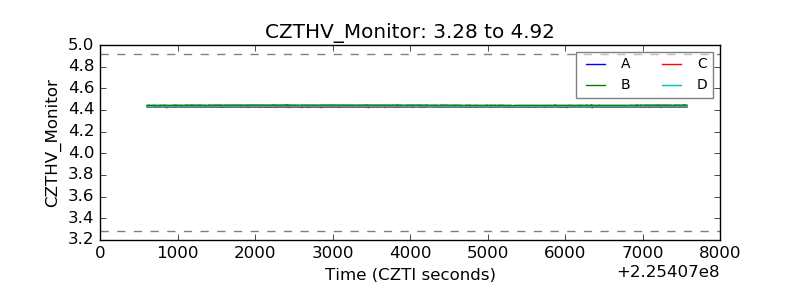 |
| D_VDD | 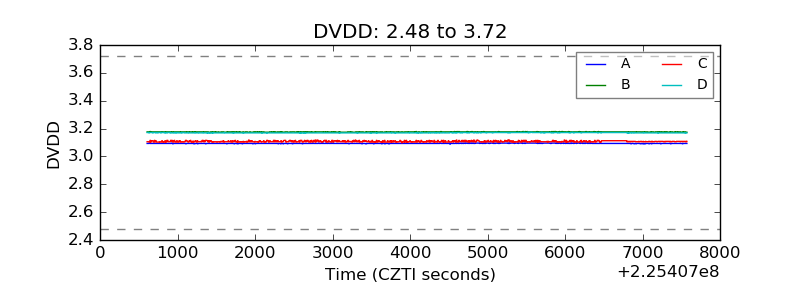 |
| Temperature 1 | 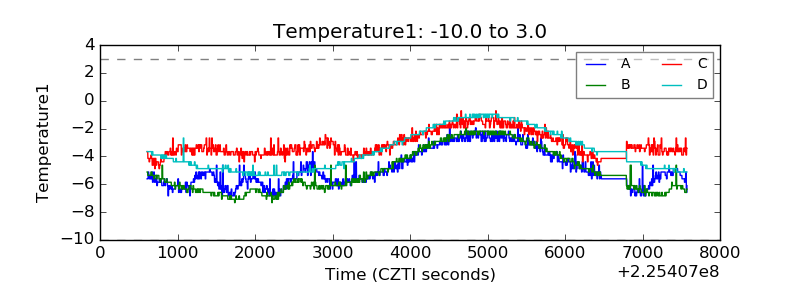 |
| Veto HV Monitor | 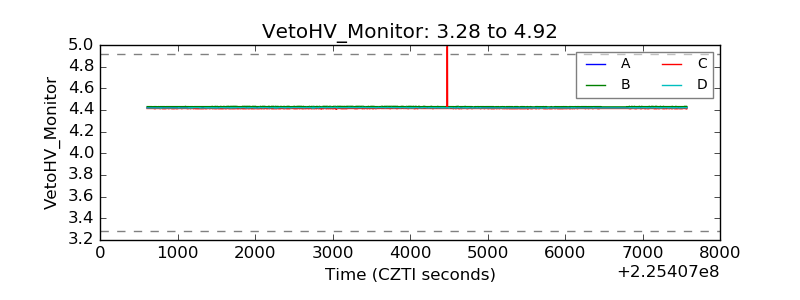 |
| Veto LLD | 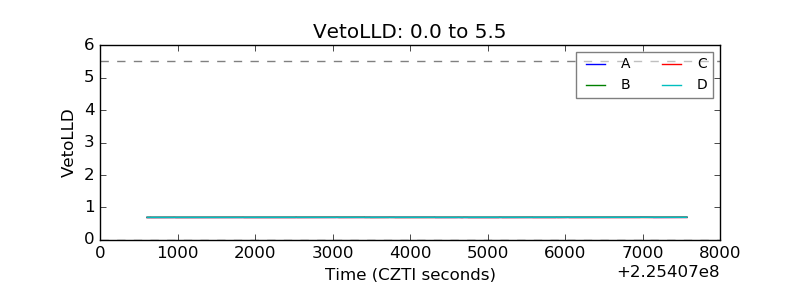 |
| Alpha Counter | 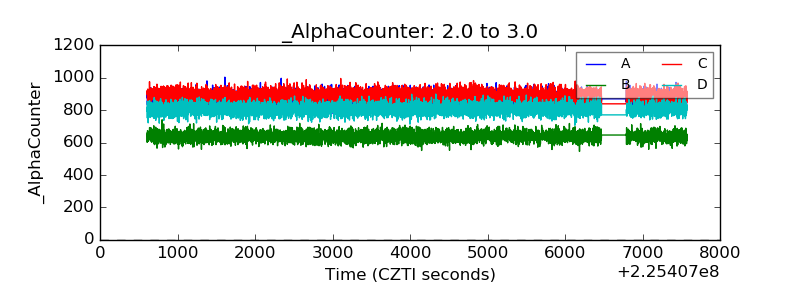 |
| _CPM_Rate | 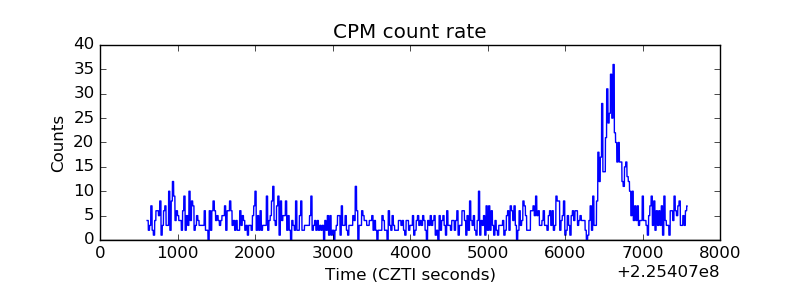 |
| CZT Counter | 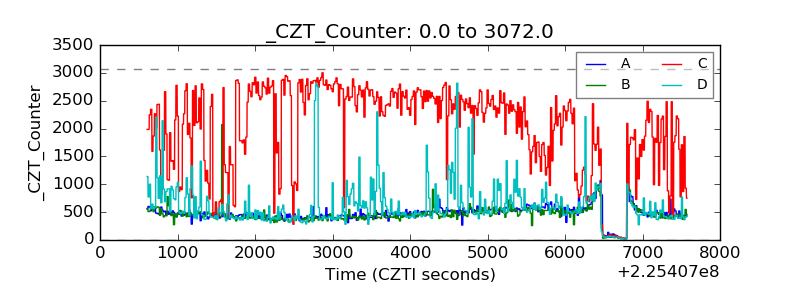 |
| +2.5 Volts monitor | 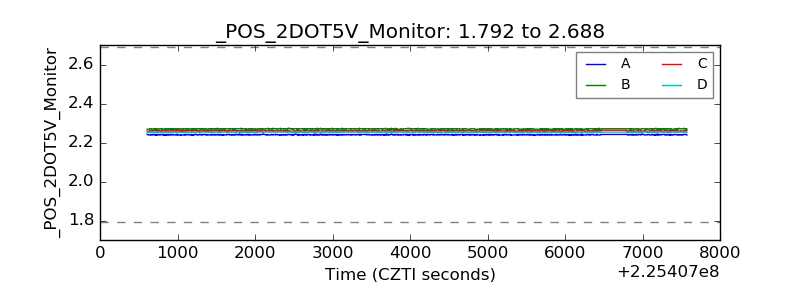 |
| +5 Volts monitor |  |
| _ROLL_ROT | 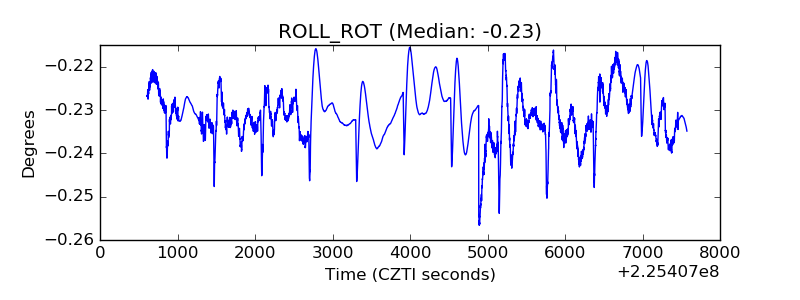 |
| _Roll_DEC | 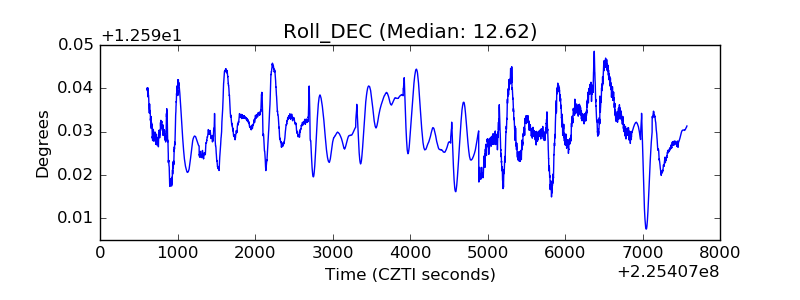 |
| _Roll_RA | 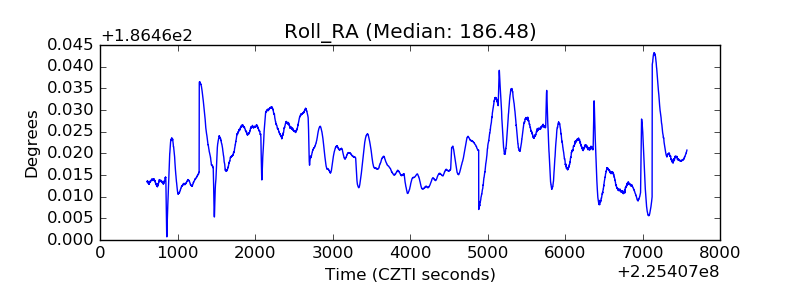 |
| Veto Counter | 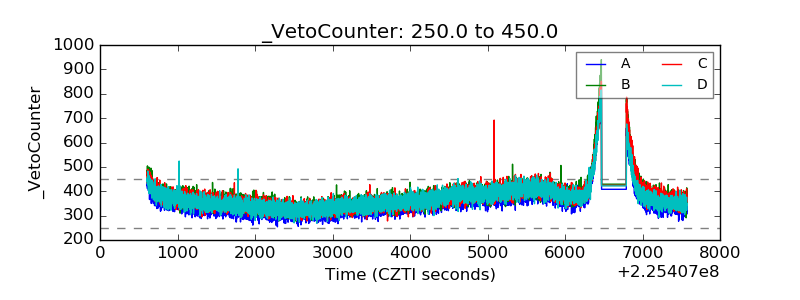 |