| Param | Original file | Final file |
|---|---|---|
| Filename | modeM0/AS1A02_024T01_9000001044_07592cztM0_level2.evt | modeM0/AS1A02_024T01_9000001044_07592cztM0_level2_quad_clean.evt |
| Size (bytes) | 121,818,240 | 20,151,360 |
| Size | 116.2 MB | 19.2 MB |
| Events in quadrant A | 622,236 | 136,666 |
| Events in quadrant B | 605,384 | 139,680 |
| Events in quadrant C | 1,716,261 | 117,792 |
| Events in quadrant D | 668,107 | 131,848 |
| Mode SS | |||
|---|---|---|---|
| Quadrant | BADHDUFLAG | Total packets | Discarded packets |
| A | 0 | 24 | 0 |
| B | 0 | 24 | 0 |
| C | 0 | 24 | 0 |
| D | 0 | 24 | 0 |
| Mode M0 | |||
|---|---|---|---|
| Quadrant | BADHDUFLAG | Total packets | Discarded packets |
| A | 0 | 2575 | 1 |
| B | 0 | 2521 | 1 |
| C | 0 | 5864 | 1 |
| D | 0 | 2777 | 1 |
| Mode M9 | |||
|---|---|---|---|
| Quadrant | BADHDUFLAG | Total packets | Discarded packets |
| A | 0 | 3 | 0 |
| B | 0 | 3 | 0 |
| C | 0 | 3 | 0 |
| D | 0 | 3 | 0 |
| Quadrant | Total seconds | Saturated seconds | Saturation percentage |
|---|---|---|---|
| A | 1096 | 66 | 6.021898% |
| B | 1096 | 77 | 7.025547% |
| C | 1096 | 468 | 42.700730% |
| D | 1096 | 46 | 4.197080% |
Noise dominated data is calculated using 1-second bins in cleaned event files. If a bin has >2000 counts, and if more than 50% of those come from <1% of pixels, then it is considered to be noise-dominated and hence unusable.
| Quadrant | # 1 sec bins | Bins with >0 counts | Bins with >2000 counts | High rate bins dominated by noise | Noise dominated (total time) | Noise dominated (detector-on time) | Marked lightcurve |
|---|---|---|---|---|---|---|---|
| A | 1416 | 1097 | 0 | 0 | 0.00% | 0.00% | 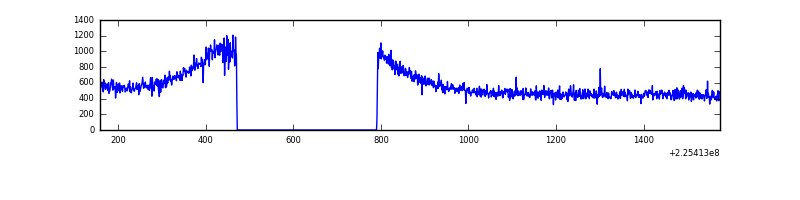 |
| B | 1416 | 1097 | 0 | 0 | 0.00% | 0.00% | 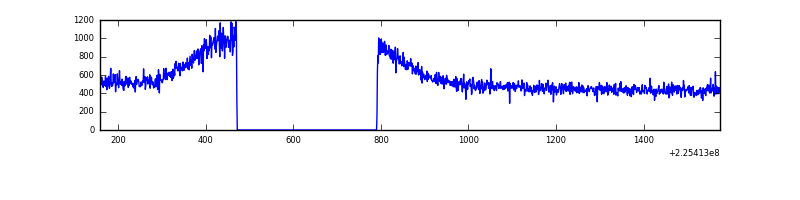 |
| C | 1416 | 1097 | 313 | 313 | 22.10% | 28.53% | 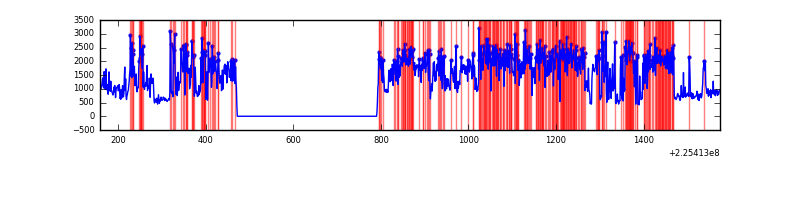 |
| D | 1416 | 1097 | 9 | 9 | 0.64% | 0.82% | 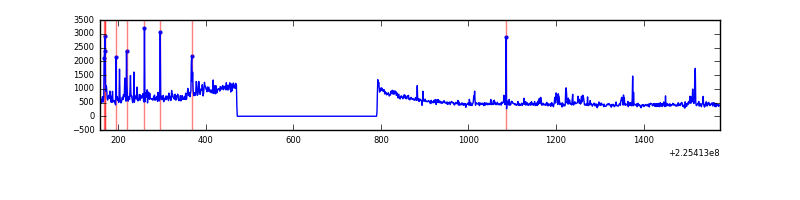 |
Top three noisy pixels from each quadrant. If the there are fewer than three noisy pixels in the level2.evt file, extra rows are filled as -1
| Pixel properties | Quadrant properties | ||||||
|---|---|---|---|---|---|---|---|
| Quadrant | DetID | PixID | Counts | Sigma | Mean | Median | Sigma |
| A | 15 | 239 | 38957 | 1132.58 | 151 | 147 | 34.3 |
| A | 0 | 226 | 1473 | 38.7 | 151 | 147 | 34.3 |
| A | 12 | 194 | 1299 | 33.62 | 151 | 147 | 34.3 |
| B | 12 | 111 | 3451 | 98.17 | 155 | 151 | 33.6 |
| B | 11 | 111 | 2674 | 75.05 | 155 | 151 | 33.6 |
| B | 0 | 214 | 2365 | 65.86 | 155 | 151 | 33.6 |
| C | 9 | 68 | 1198088 | 35672.96 | 132 | 133 | 33.6 |
| C | 13 | 61 | 1025 | 26.56 | 132 | 133 | 33.6 |
| C | 8 | 128 | 669 | 15.96 | 132 | 133 | 33.6 |
| D | 5 | 233 | 62995 | 1612.38 | 147 | 142 | 39.0 |
| D | 2 | 14 | 35913 | 917.64 | 147 | 142 | 39.0 |
| D | 2 | 152 | 8970 | 226.47 | 147 | 142 | 39.0 |
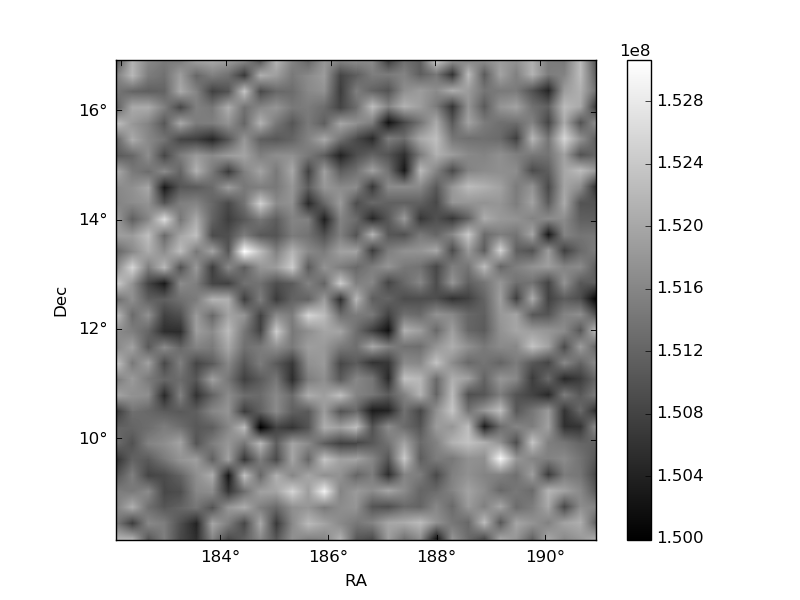
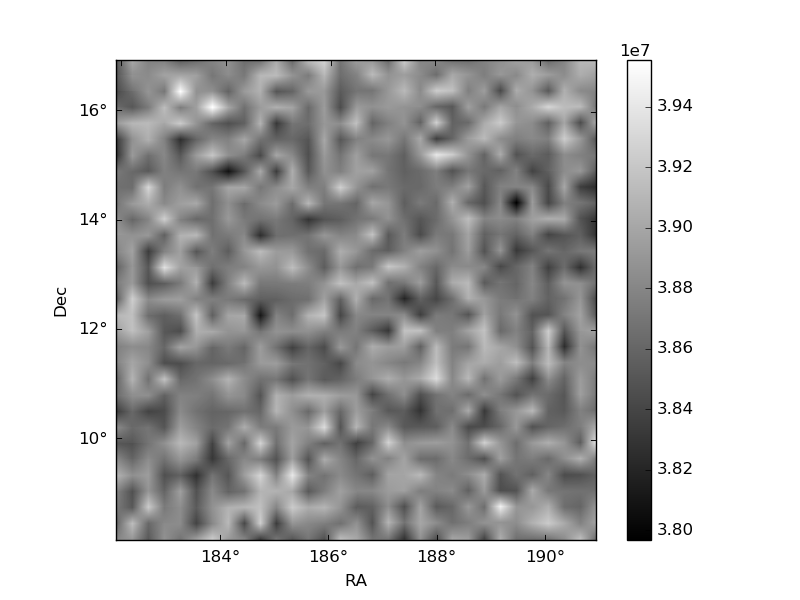
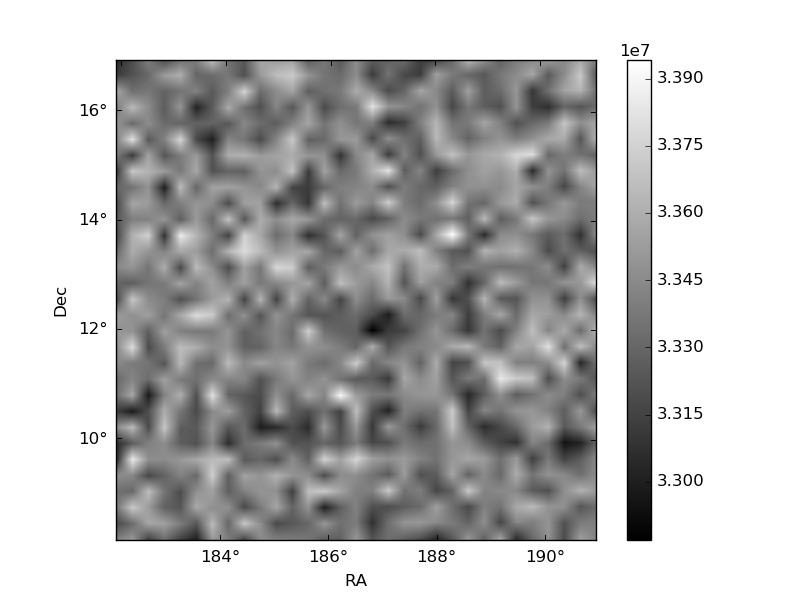
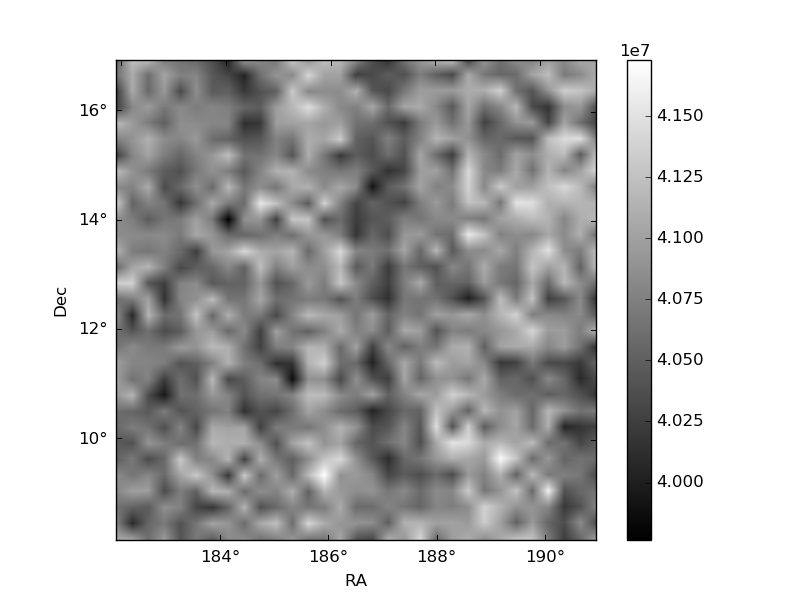
Histogram calculated using DETX and DETY for each event in the final _common_clean file
| Quadrant A | 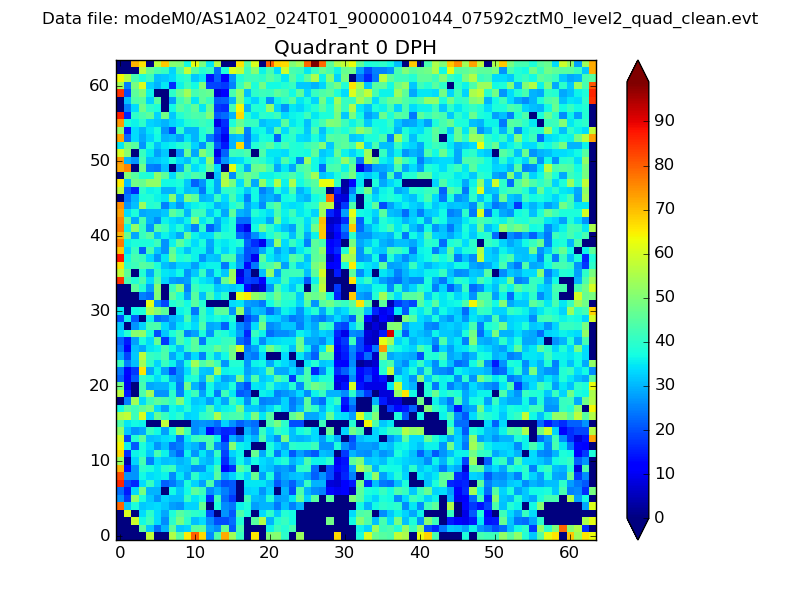 |
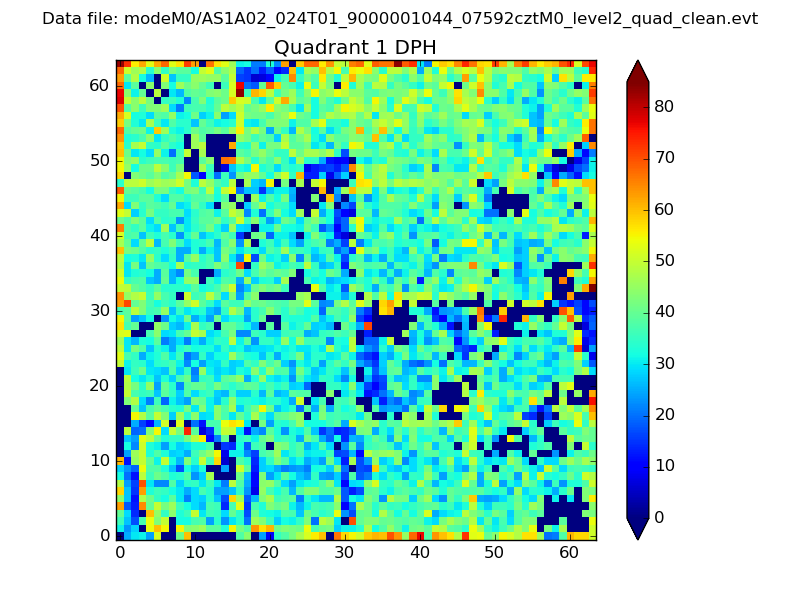 |
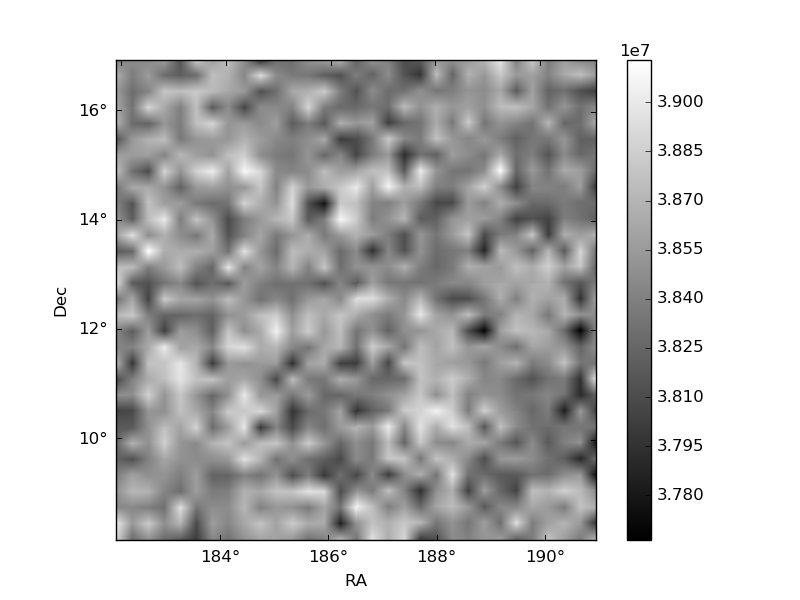
Quadrant B |
|---|---|---|---|
| Quadrant D | 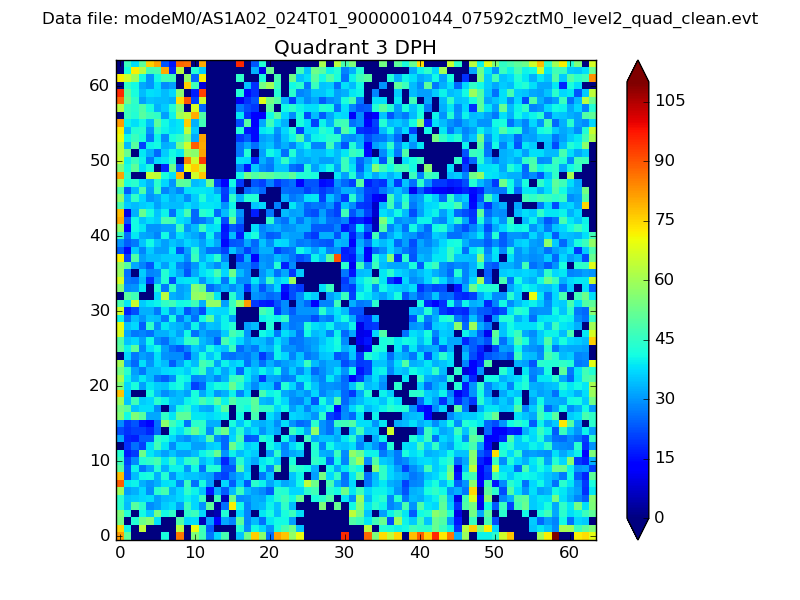 |
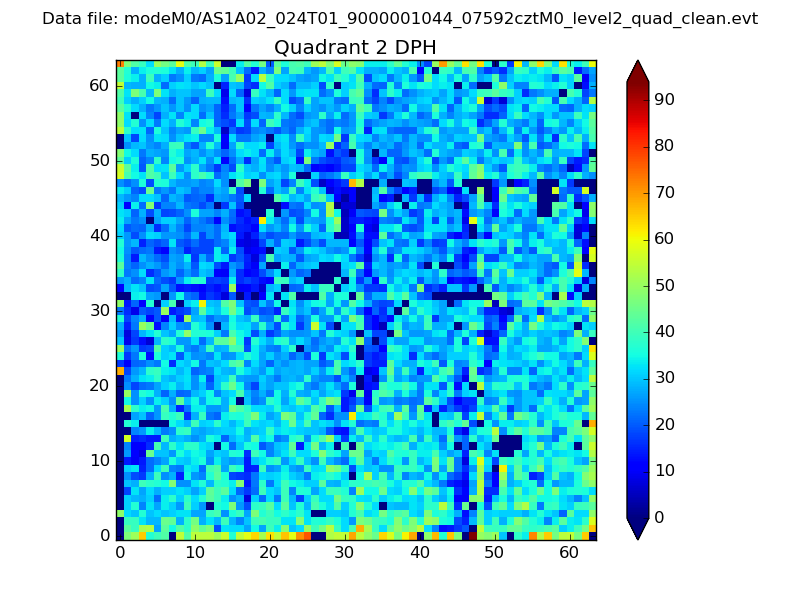 |
Quadrant C |
| Plot type | Count rate plots | Images |
|---|---|---|
| Comparison with Poisson distribution Blue bars denote a histogram of data divided into 1 sec bins. Red curve is a Poisson curve with rate = median count rate of data. |
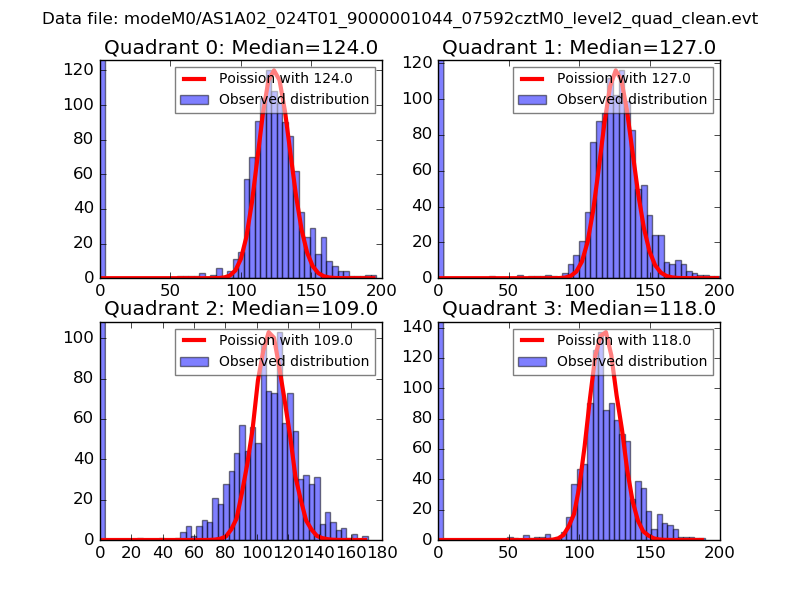 |
 |
| Quadrant-wise count rates Data is divided into 100 sec bins |
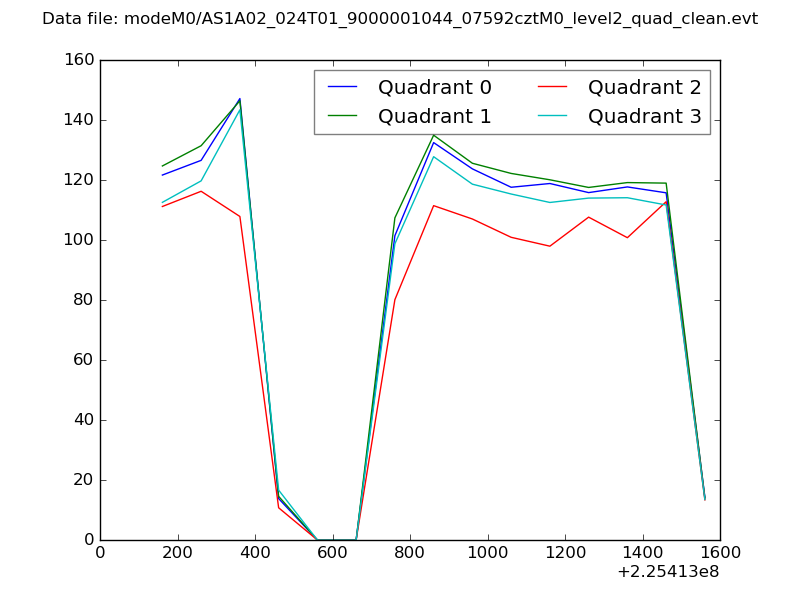 |
|
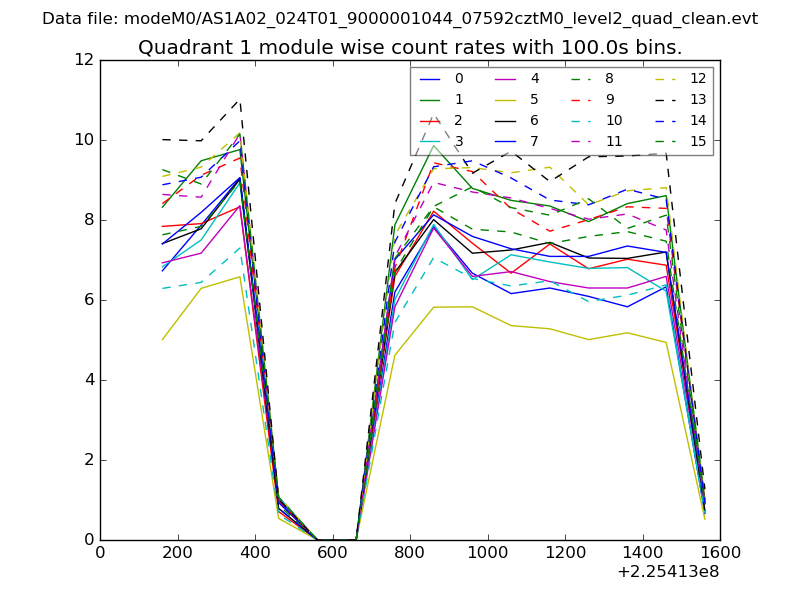
| Module-wise count rates for Quadrant A Data is divided into 100 sec bins |
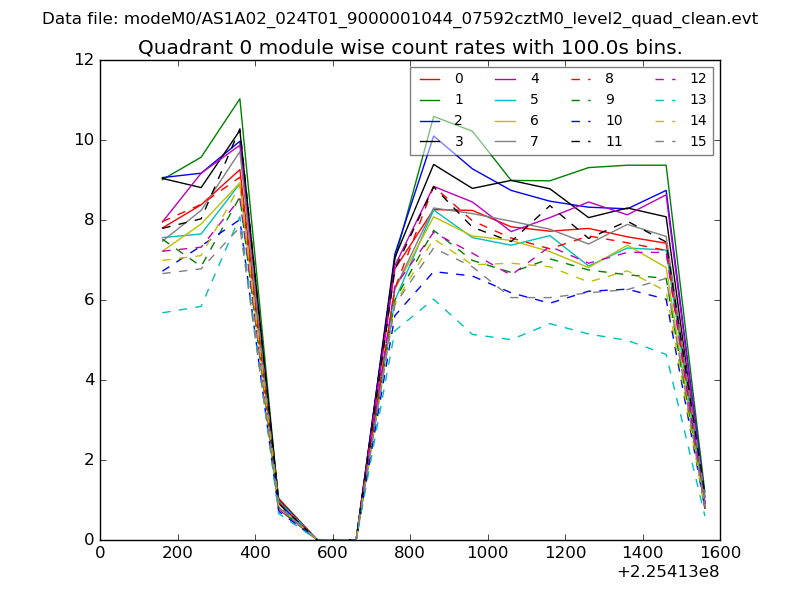 |
 |
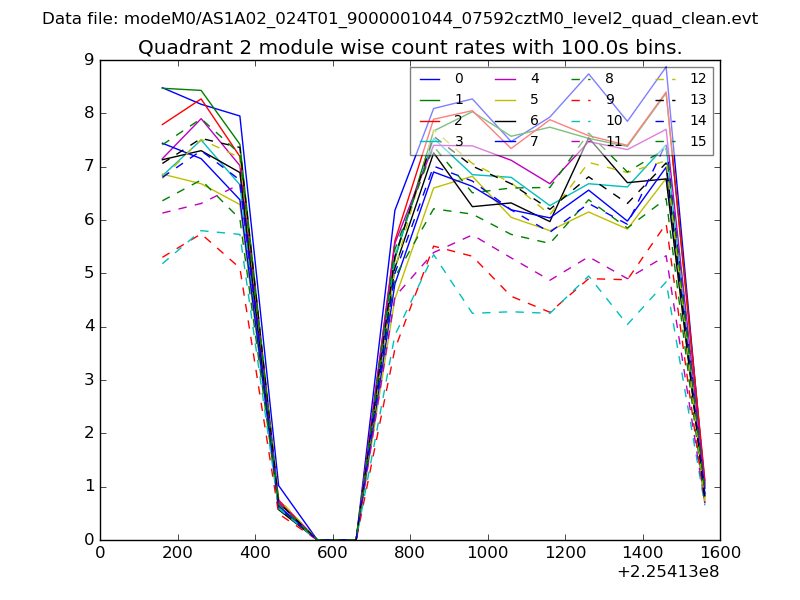
| Module-wise count rates for Quadrant B Data is divided into 100 sec bins |
 |
 |
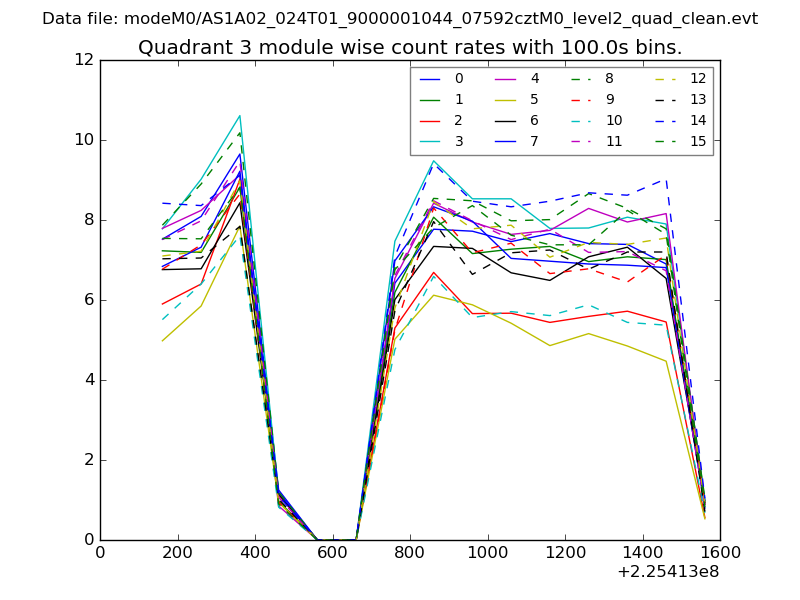
| Module-wise count rates for Quadrant C Data is divided into 100 sec bins |
 |
 |
| Module-wise count rates for Quadrant D Data is divided into 100 sec bins |
 |
 |
| Parameter | Plot |
|---|---|
| CZT HV Monitor | 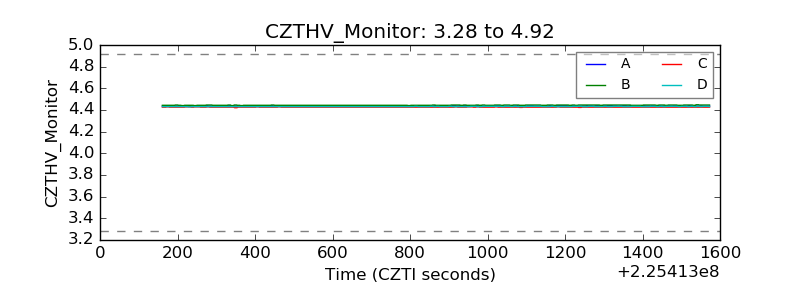 |
| D_VDD | 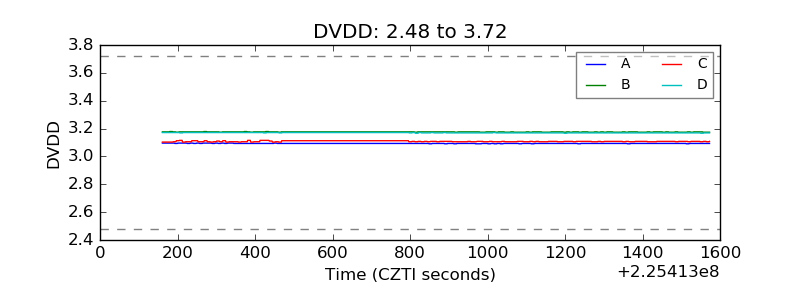 |
| Temperature 1 | 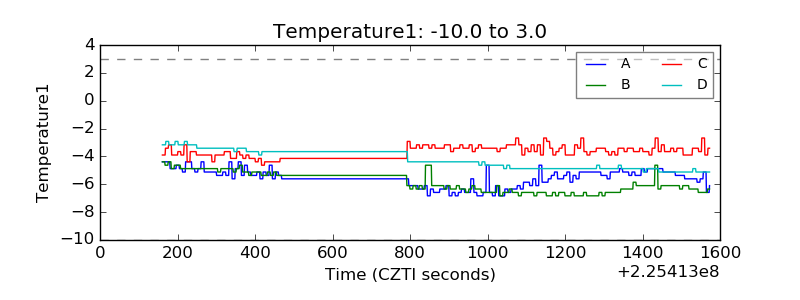 |
| Veto HV Monitor | 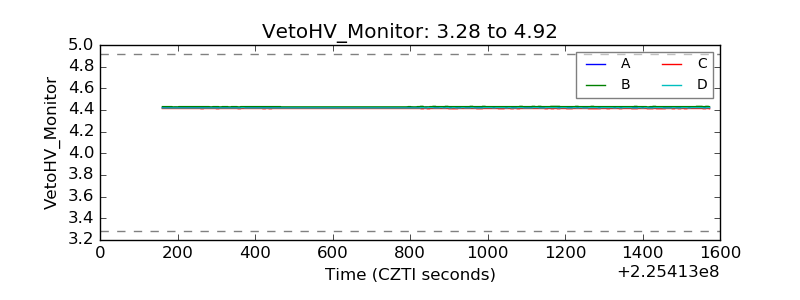 |
| Veto LLD | 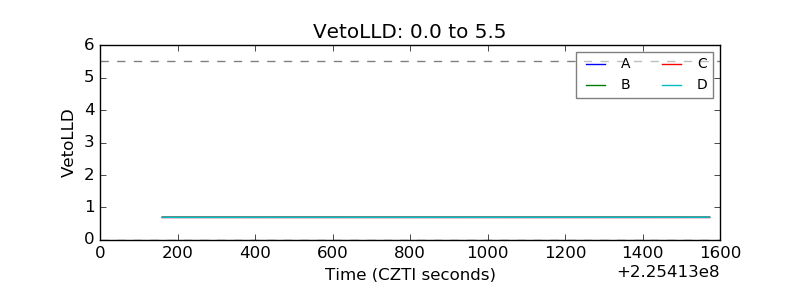 |
| Alpha Counter | 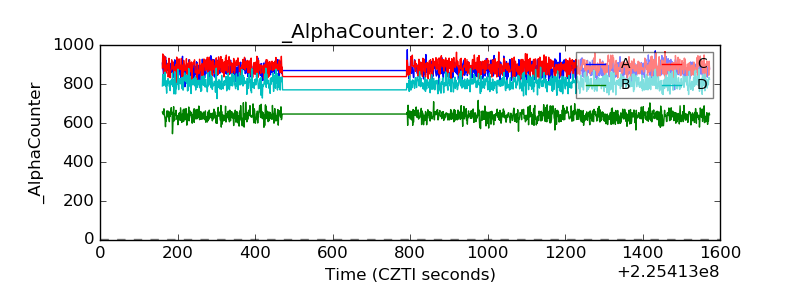 |
| _CPM_Rate |  |
| CZT Counter | 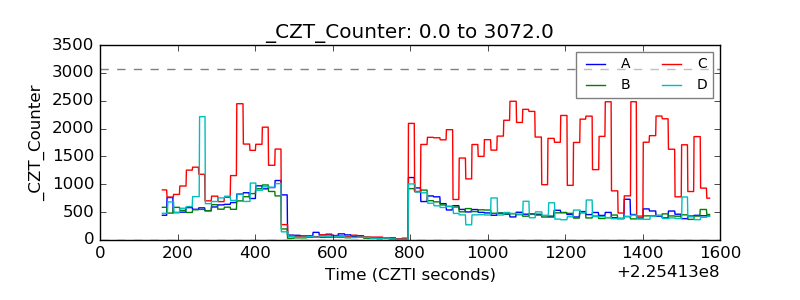 |
| +2.5 Volts monitor | 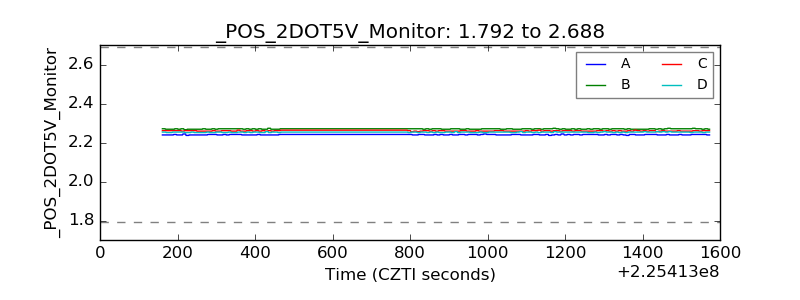 |
| +5 Volts monitor | 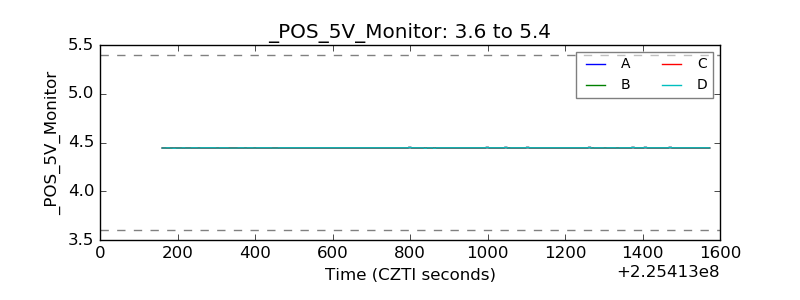 |
| _ROLL_ROT | 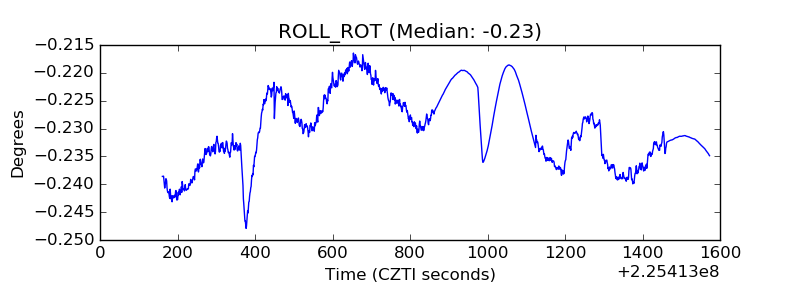 |
| _Roll_DEC | 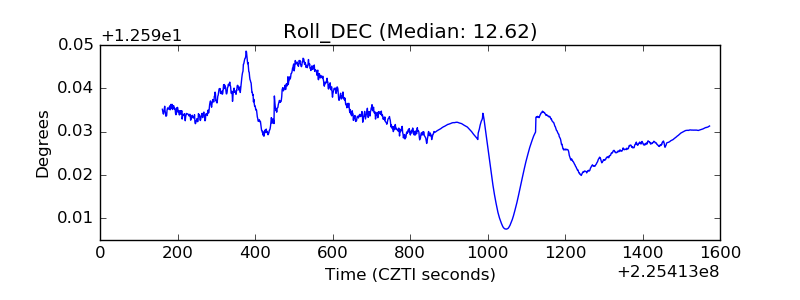 |
| _Roll_RA | 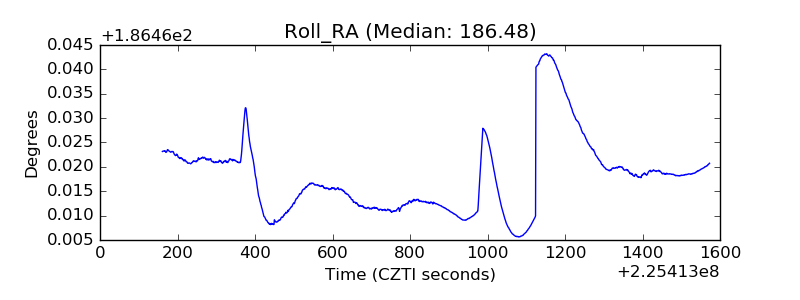 |
| Veto Counter | 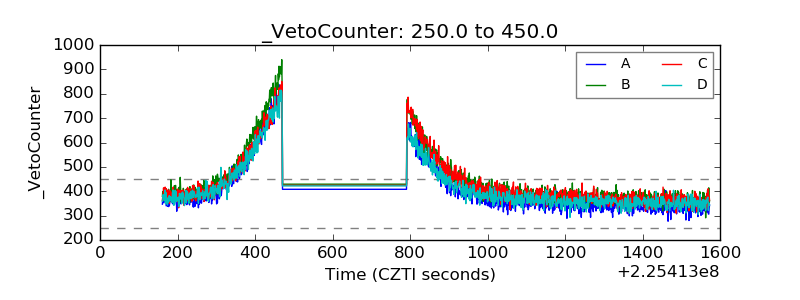 |