| Param | Original file | Final file |
|---|---|---|
| Filename | modeM0/AS1G06_164T01_9000001040cztM0_level2.fits | modeM0/AS1G06_164T01_9000001040cztM0_level2_quad_clean.evt |
| Size (bytes) | 360,869,760 | 359,219,520 |
| Size | 344.2 MB | 342.6 MB |
| Events in quadrant A | 2,184,002 | 2,153,413 |
| Events in quadrant B | 2,117,180 | 2,183,949 |
| Events in quadrant C | 2,136,474 | 2,036,722 |
| Events in quadrant D | 1,853,018 | 1,866,361 |
| Mode SS | |||
|---|---|---|---|
| Quadrant | BADHDUFLAG | Total packets | Discarded packets |
| A | 0 | 780 | 0 |
| B | 0 | 780 | 0 |
| C | 0 | 780 | 0 |
| D | 0 | 780 | 0 |
| Mode M0 | |||
|---|---|---|---|
| Quadrant | BADHDUFLAG | Total packets | Discarded packets |
| A | 0 | 78690 | 0 |
| B | 0 | 79019 | 0 |
| C | 0 | 80346 | 0 |
| D | 0 | 87485 | 0 |
| Mode M9 | |||
|---|---|---|---|
| Quadrant | BADHDUFLAG | Total packets | Discarded packets |
| A | 0 | 65 | 0 |
| B | 0 | 65 | 0 |
| C | 0 | 65 | 0 |
| D | 0 | 65 | 0 |
| Quadrant | Total seconds | Saturated seconds | Saturation percentage |
|---|---|---|---|
| A | 38428 | 314 | 0.817113% |
| B | 38428 | 336 | 0.874362% |
| C | 38428 | 385 | 1.001874% |
| D | 38428 | 765 | 1.990736% |
Noise dominated data is calculated using 1-second bins in cleaned event files. If a bin has >2000 counts, and if more than 50% of those come from <1% of pixels, then it is considered to be noise-dominated and hence unusable.
| Quadrant | # 1 sec bins | Bins with >0 counts | Bins with >2000 counts | High rate bins dominated by noise | Noise dominated (total time) | Noise dominated (detector-on time) | Marked lightcurve |
|---|---|---|---|---|---|---|---|
| A | 44838 | 38424 | 0 | 0 | 0.00% | 0.00% | 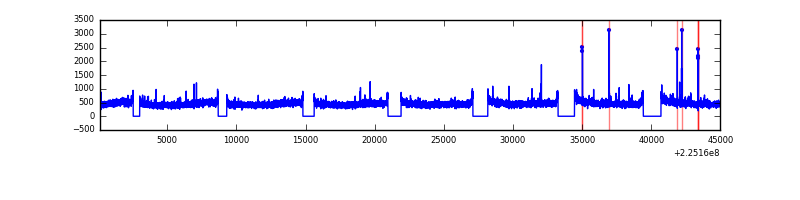 |
| B | 44838 | 38423 | 0 | 0 | 0.00% | 0.00% |  |
| C | 44838 | 38424 | 0 | 0 | 0.00% | 0.00% | 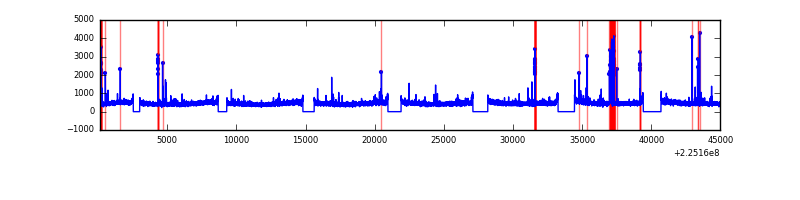 |
| D | 44838 | 38409 | 0 | 0 | 0.00% | 0.00% |  |
Top three noisy pixels from each quadrant. If the there are fewer than three noisy pixels in the level2.evt file, extra rows are filled as -1
| Pixel properties | Quadrant properties | ||||||
|---|---|---|---|---|---|---|---|
| Quadrant | DetID | PixID | Counts | Sigma | Mean | Median | Sigma |
| A | 0 | 29 | 2088 | 10.69 | 568 | 532 | 145.6 |
| A | 7 | 110 | 1844 | 9.01 | 568 | 532 | 145.6 |
| A | 0 | 30 | 1718 | 8.15 | 568 | 532 | 145.6 |
| B | 2 | 9 | 1885 | 12.04 | 558 | 532 | 112.4 |
| B | 2 | 8 | 1445 | 8.12 | 558 | 532 | 112.4 |
| B | 14 | 254 | 1427 | 7.96 | 558 | 532 | 112.4 |
| C | 1 | 80 | 1589 | 7.18 | 564 | 523 | 148.5 |
| C | 1 | 81 | 1567 | 7.03 | 564 | 523 | 148.5 |
| C | 12 | 241 | 1553 | 6.94 | 564 | 523 | 148.5 |
| D | 3 | 14 | 1359 | 6.24 | 528 | 480 | 140.8 |
| D | 6 | 231 | 1358 | 6.23 | 528 | 480 | 140.8 |
| D | 10 | 189 | 1309 | 5.89 | 528 | 480 | 140.8 |
Histogram calculated using DETX and DETY for each event in the final _common_clean file
| Quadrant A | 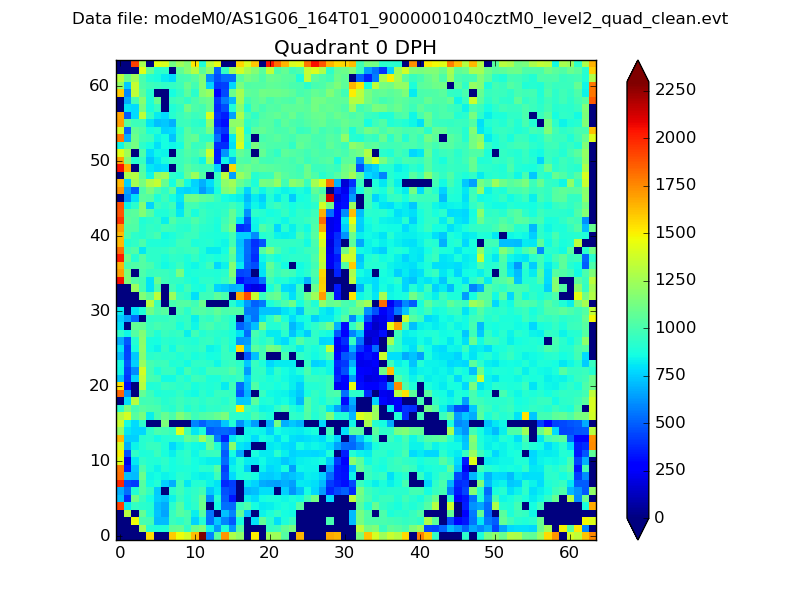 |
 |
Quadrant B |
|---|---|---|---|
| Quadrant D | 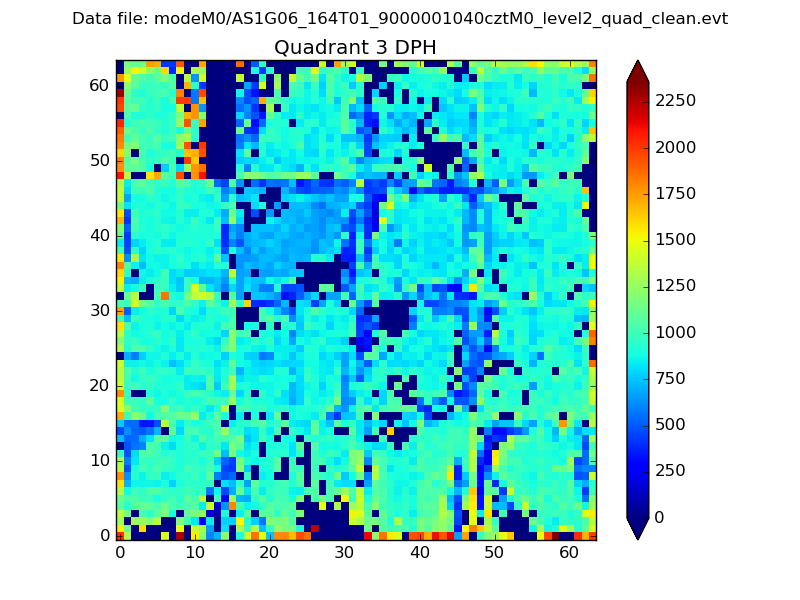 |
 |
Quadrant C |
| Plot type | Count rate plots | Images |
|---|---|---|
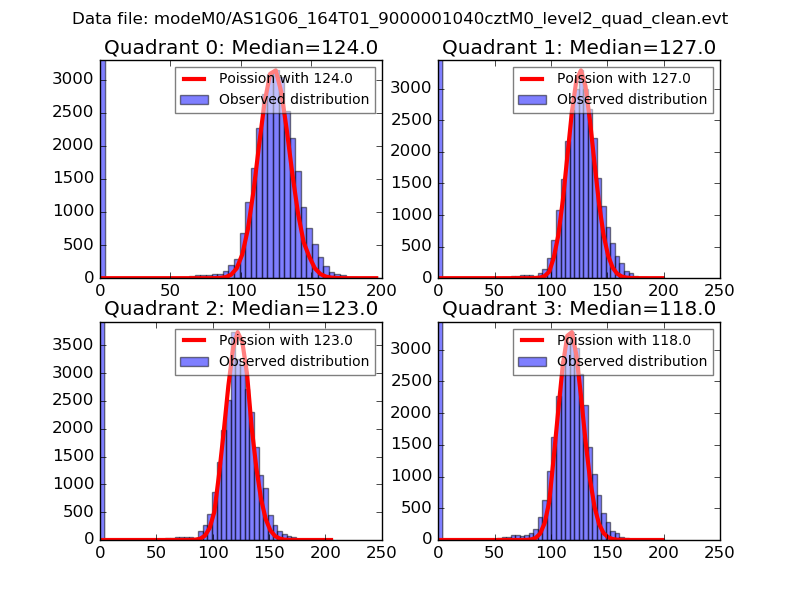
| Comparison with Poisson distribution Blue bars denote a histogram of data divided into 1 sec bins. Red curve is a Poisson curve with rate = median count rate of data. |
 |
 |
| Quadrant-wise count rates Data is divided into 100 sec bins |
 |
|
| Module-wise count rates for Quadrant A Data is divided into 100 sec bins |
 |
 |
| Module-wise count rates for Quadrant B Data is divided into 100 sec bins |
 |
 |
| Module-wise count rates for Quadrant C Data is divided into 100 sec bins |
 |
 |
| Module-wise count rates for Quadrant D Data is divided into 100 sec bins |
 |
 |
| Parameter | Plot |
|---|---|
| CZT HV Monitor |  |
| D_VDD | 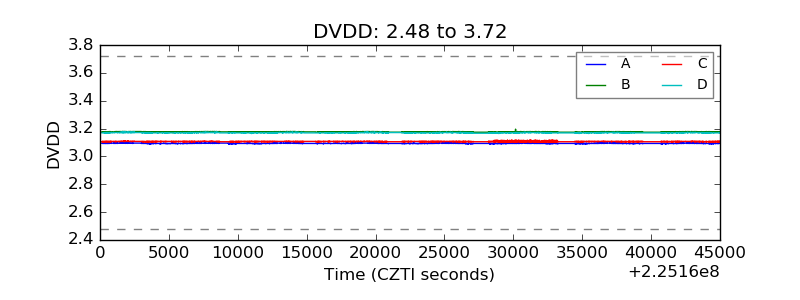 |
| Temperature 1 |  |
| Veto HV Monitor |  |
| Veto LLD | 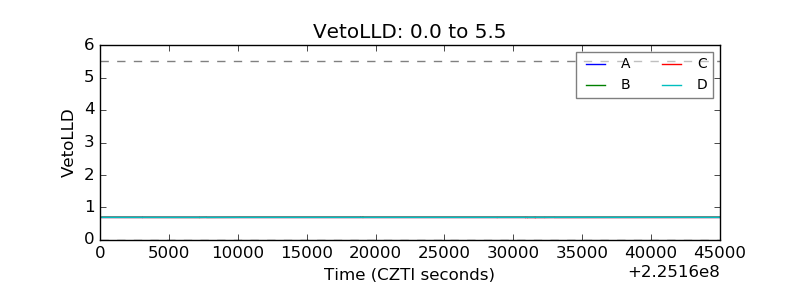 |
| Alpha Counter |  |
| _CPM_Rate |  |
| CZT Counter |  |
| +2.5 Volts monitor |  |
| +5 Volts monitor | 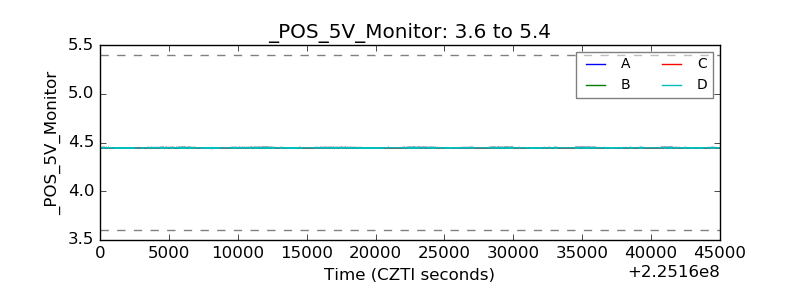 |
| _ROLL_ROT | 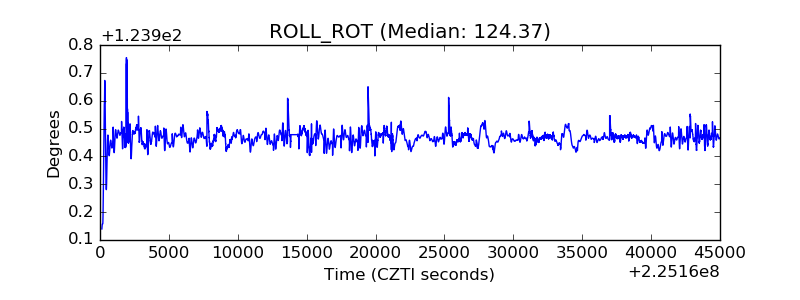 |
| _Roll_DEC | 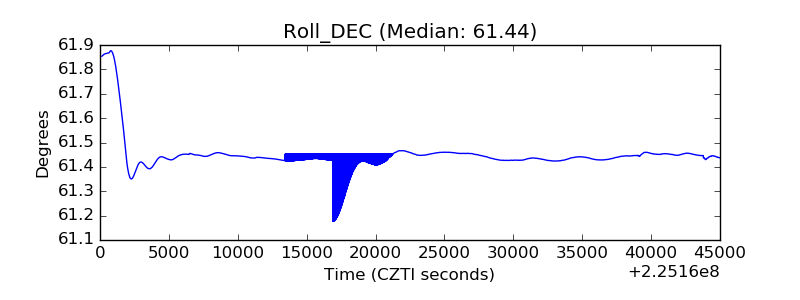 |
| _Roll_RA |  |
| Veto Counter |  |