| Param | Original file | Final file |
|---|---|---|
| Filename | modeM0/AS1G06_164T01_9000001040_07549cztM0_level2.evt | modeM0/AS1G06_164T01_9000001040_07549cztM0_level2_quad_clean.evt |
| Size (bytes) | 186,929,280 | 45,328,320 |
| Size | 178.3 MB | 43.2 MB |
| Events in quadrant A | 1,313,648 | 297,206 |
| Events in quadrant B | 1,342,637 | 306,095 |
| Events in quadrant C | 1,332,857 | 295,551 |
| Events in quadrant D | 1,488,173 | 282,090 |
| Mode SS | |||
|---|---|---|---|
| Quadrant | BADHDUFLAG | Total packets | Discarded packets |
| A | 0 | 54 | 0 |
| B | 0 | 54 | 0 |
| C | 0 | 54 | 0 |
| D | 0 | 54 | 0 |
| Mode M0 | |||
|---|---|---|---|
| Quadrant | BADHDUFLAG | Total packets | Discarded packets |
| A | 0 | 5520 | 2 |
| B | 0 | 5626 | 1 |
| C | 0 | 5651 | 1 |
| D | 0 | 6203 | 1 |
| Mode M9 | |||
|---|---|---|---|
| Quadrant | BADHDUFLAG | Total packets | Discarded packets |
| A | 0 | 5 | 0 |
| B | 0 | 5 | 0 |
| C | 0 | 5 | 0 |
| D | 0 | 5 | 0 |
| Quadrant | Total seconds | Saturated seconds | Saturation percentage |
|---|---|---|---|
| A | 2678 | 22 | 0.821509% |
| B | 2678 | 22 | 0.821509% |
| C | 2678 | 23 | 0.858850% |
| D | 2678 | 39 | 1.456311% |
Noise dominated data is calculated using 1-second bins in cleaned event files. If a bin has >2000 counts, and if more than 50% of those come from <1% of pixels, then it is considered to be noise-dominated and hence unusable.
| Quadrant | # 1 sec bins | Bins with >0 counts | Bins with >2000 counts | High rate bins dominated by noise | Noise dominated (total time) | Noise dominated (detector-on time) | Marked lightcurve |
|---|---|---|---|---|---|---|---|
| A | 3143 | 2679 | 0 | 0 | 0.00% | 0.00% | 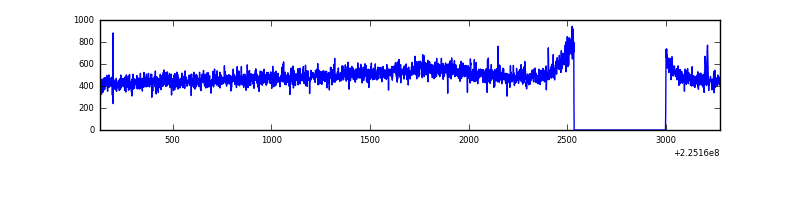 |
| B | 3143 | 2679 | 0 | 0 | 0.00% | 0.00% | 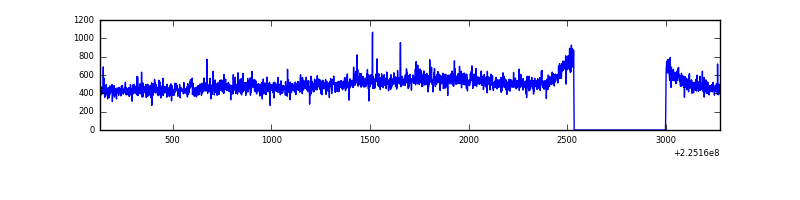 |
| C | 3143 | 2679 | 12 | 12 | 0.38% | 0.45% | 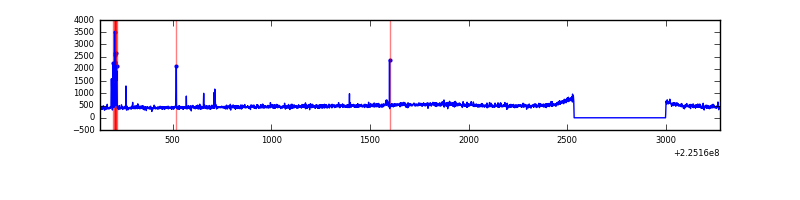 |
| D | 3143 | 2679 | 20 | 20 | 0.64% | 0.75% | 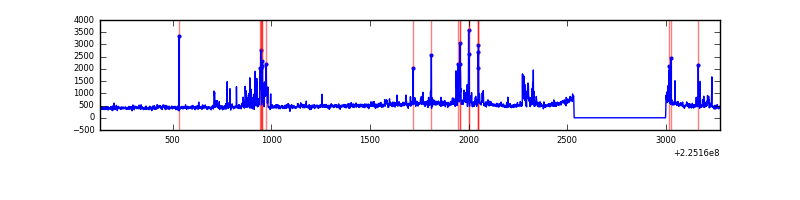 |
Top three noisy pixels from each quadrant. If the there are fewer than three noisy pixels in the level2.evt file, extra rows are filled as -1
| Pixel properties | Quadrant properties | ||||||
|---|---|---|---|---|---|---|---|
| Quadrant | DetID | PixID | Counts | Sigma | Mean | Median | Sigma |
| A | 13 | 14 | 6906 | 91.4 | 338 | 330 | 71.9 |
| A | 15 | 239 | 4980 | 64.63 | 338 | 330 | 71.9 |
| A | 0 | 226 | 3251 | 40.6 | 338 | 330 | 71.9 |
| B | 0 | 214 | 15263 | 224.05 | 337 | 328 | 66.7 |
| B | 0 | 219 | 12933 | 189.1 | 337 | 328 | 66.7 |
| B | 0 | 229 | 6095 | 86.52 | 337 | 328 | 66.7 |
| C | 9 | 68 | 52647 | 676.72 | 326 | 327 | 77.3 |
| C | 13 | 61 | 2491 | 27.99 | 326 | 327 | 77.3 |
| C | 1 | 16 | 1797 | 19.01 | 326 | 327 | 77.3 |
| D | 2 | 136 | 69586 | 845.41 | 329 | 317 | 81.9 |
| D | 2 | 14 | 47914 | 580.91 | 329 | 317 | 81.9 |
| D | 13 | 238 | 41315 | 500.37 | 329 | 317 | 81.9 |
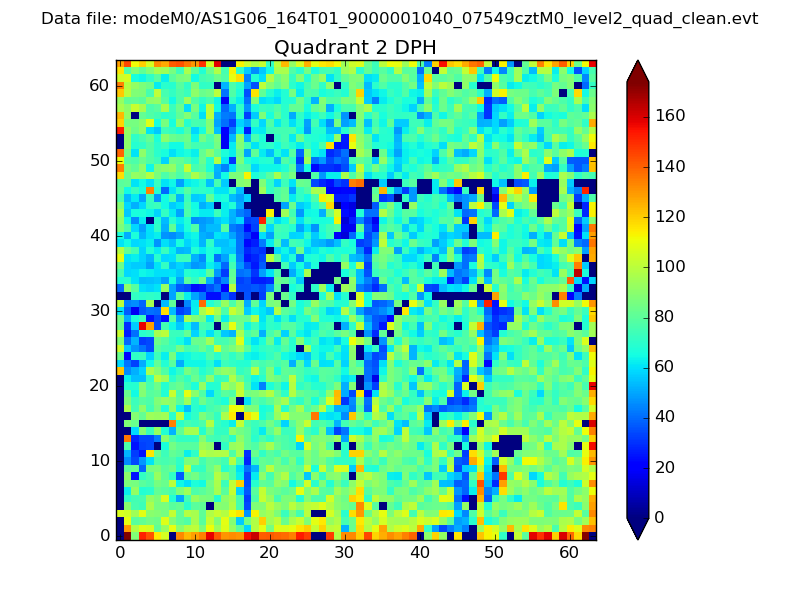
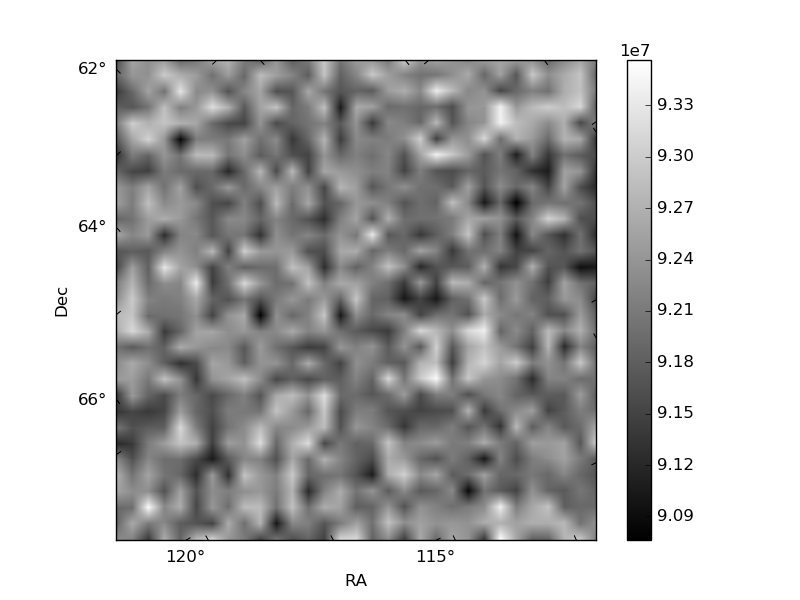
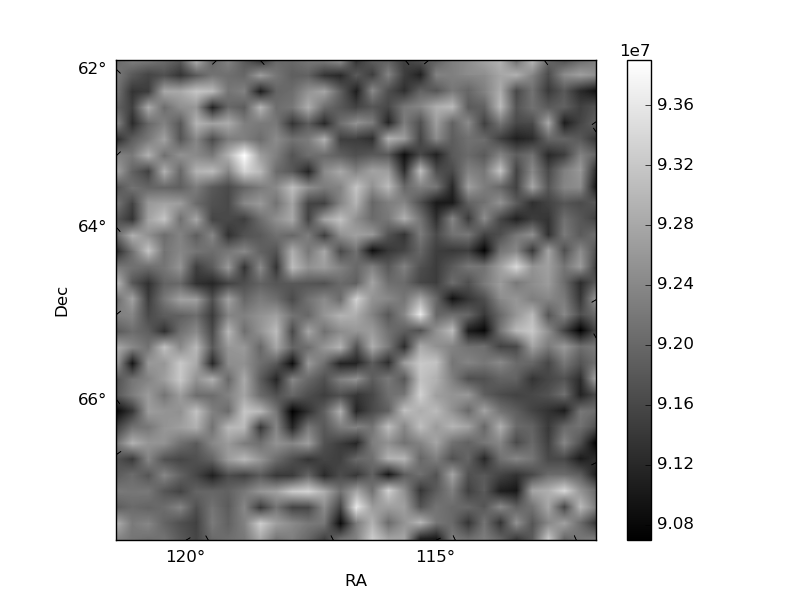
Histogram calculated using DETX and DETY for each event in the final _common_clean file
| Quadrant A | 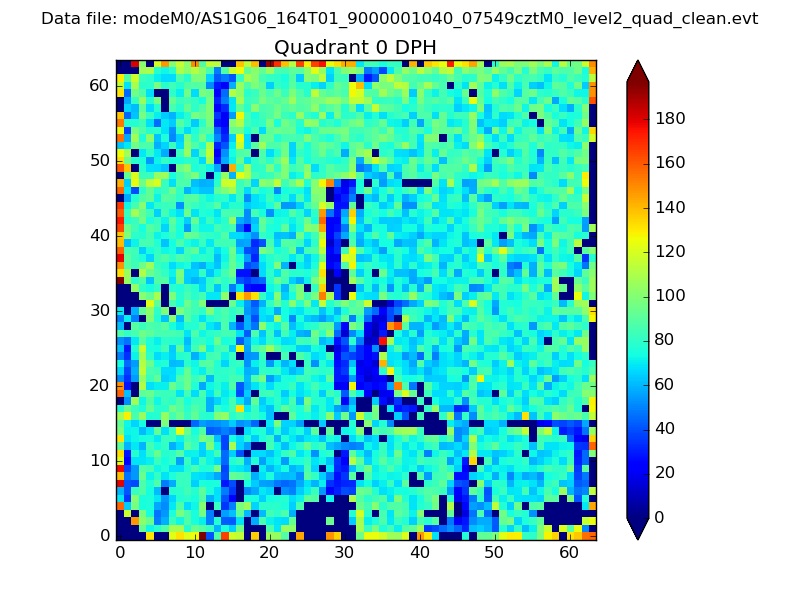 |
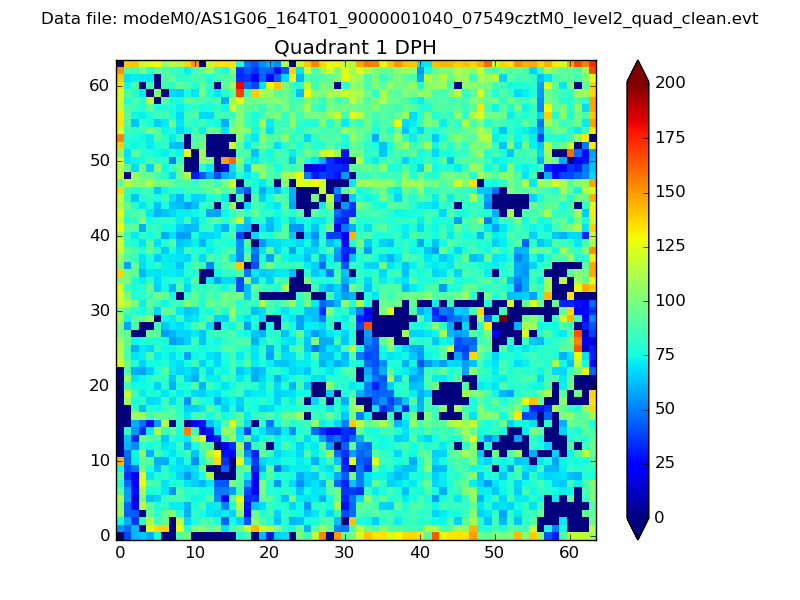 |
Quadrant B |
|---|---|---|---|
| Quadrant D | 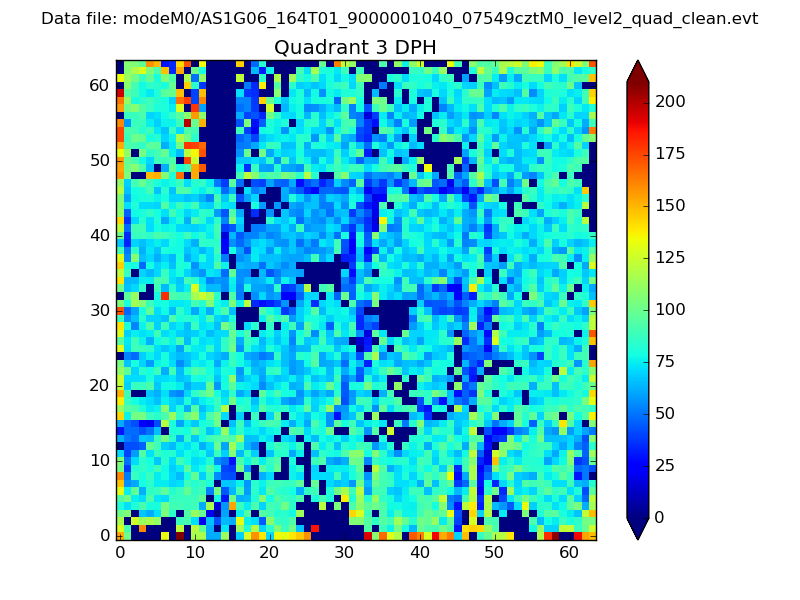 |
 |
Quadrant C |
| Plot type | Count rate plots | Images |
|---|---|---|
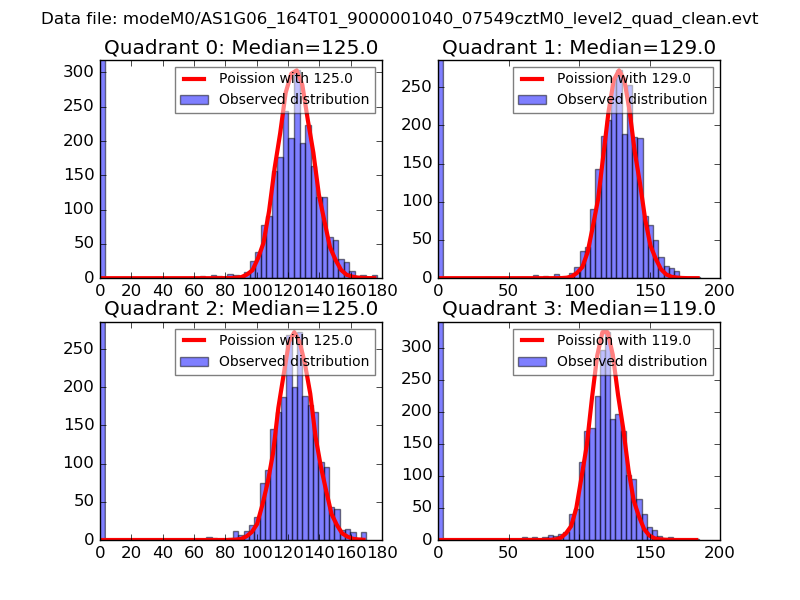
| Comparison with Poisson distribution Blue bars denote a histogram of data divided into 1 sec bins. Red curve is a Poisson curve with rate = median count rate of data. |
 |
 |
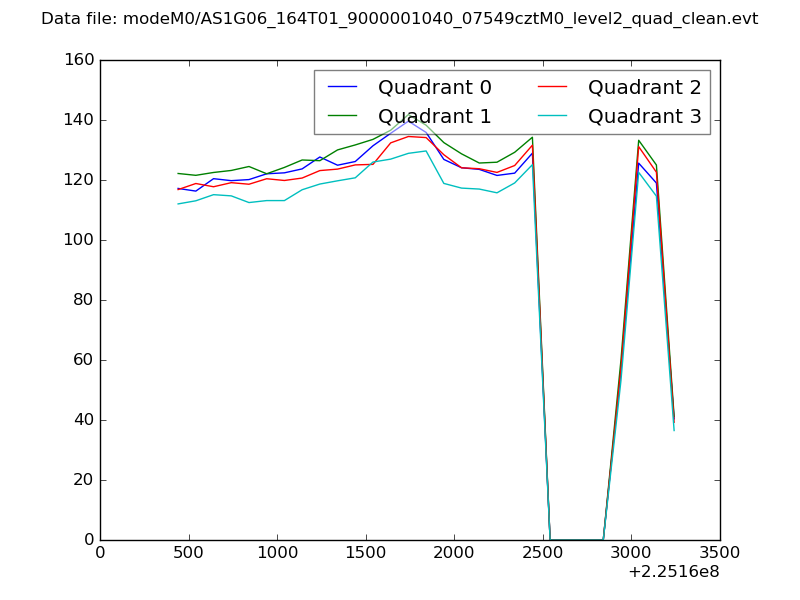
| Quadrant-wise count rates Data is divided into 100 sec bins |
 |
|
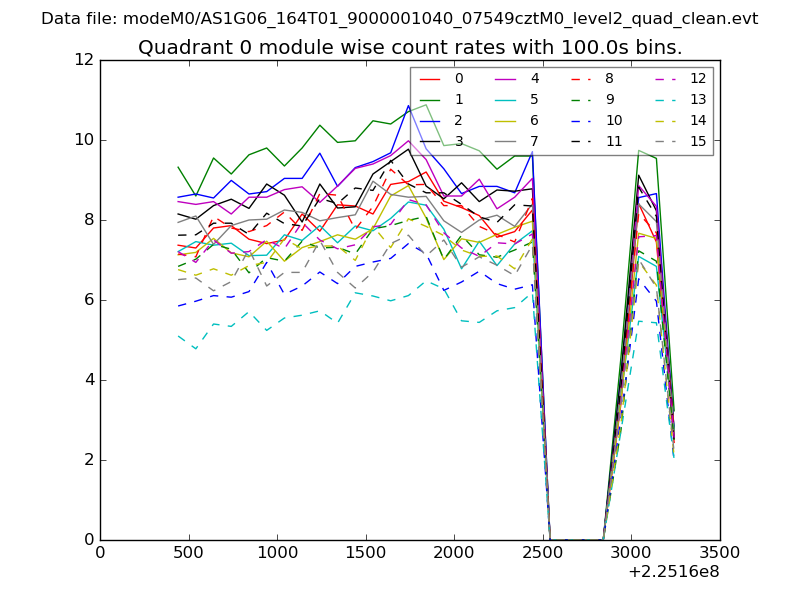
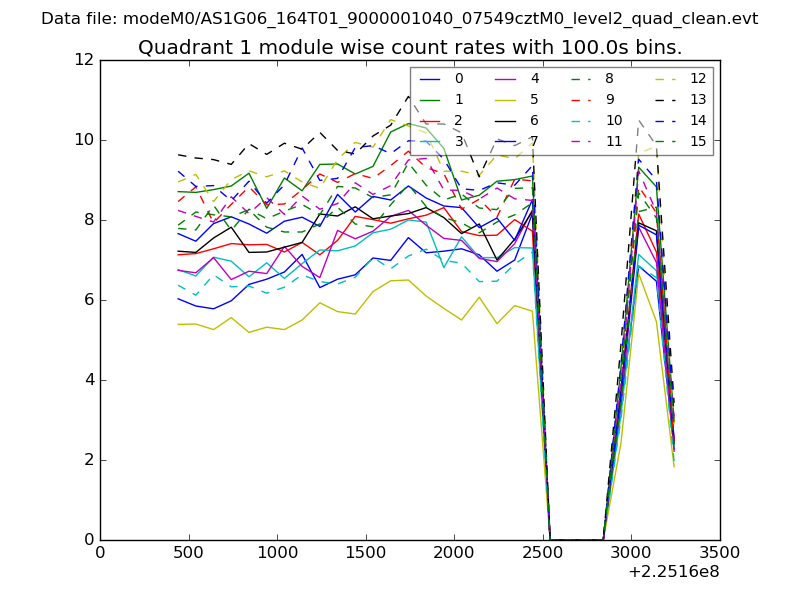
| Module-wise count rates for Quadrant A Data is divided into 100 sec bins |
 |
 |
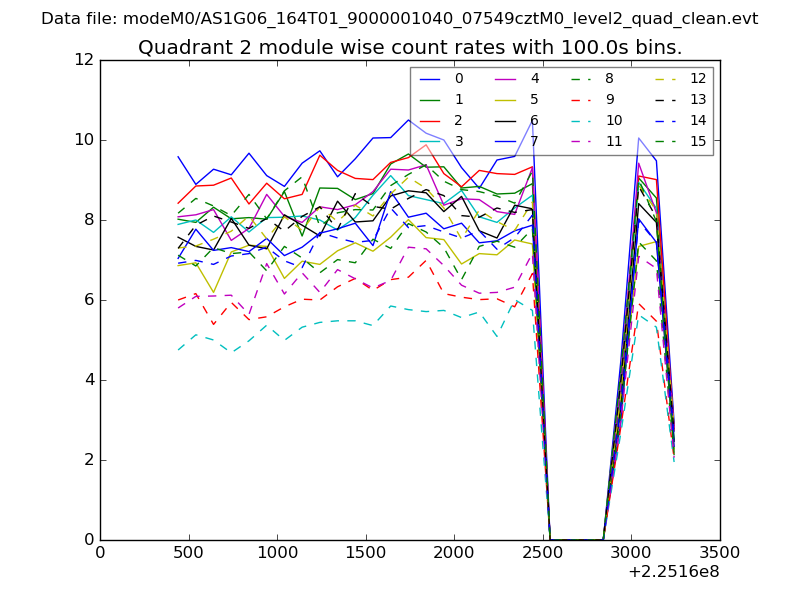
| Module-wise count rates for Quadrant B Data is divided into 100 sec bins |
 |
 |
| Module-wise count rates for Quadrant C Data is divided into 100 sec bins |
 |
 |
| Module-wise count rates for Quadrant D Data is divided into 100 sec bins |
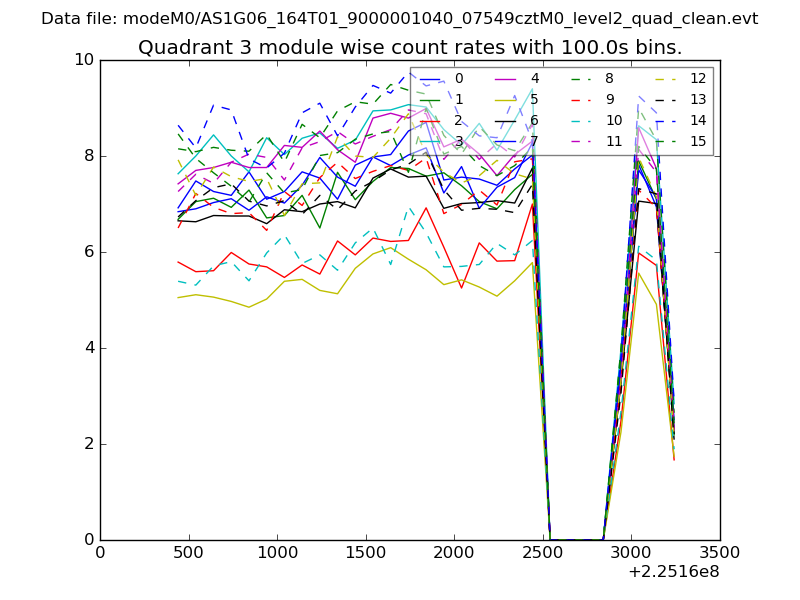 |
 |
| Parameter | Plot |
|---|---|
| CZT HV Monitor |  |
| D_VDD | 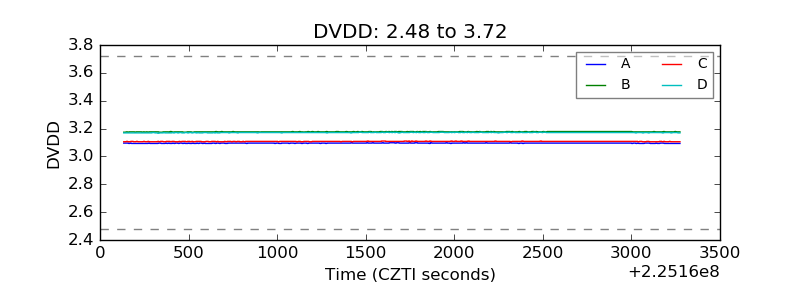 |
| Temperature 1 |  |
| Veto HV Monitor | 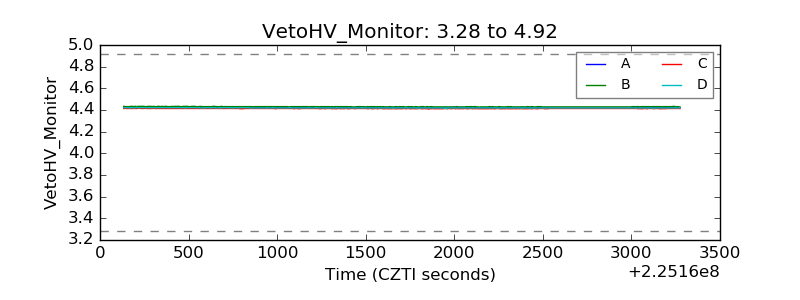 |
| Veto LLD | 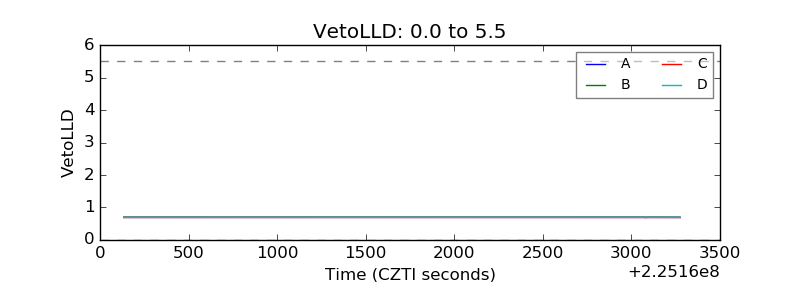 |
| Alpha Counter | 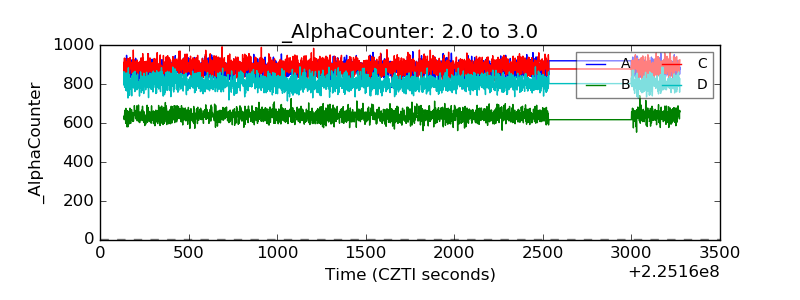 |
| _CPM_Rate | 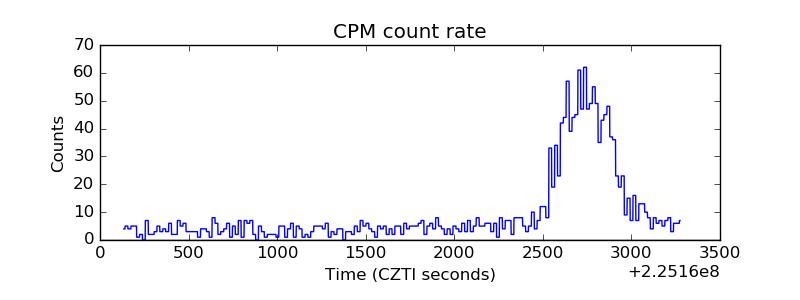 |
| CZT Counter | 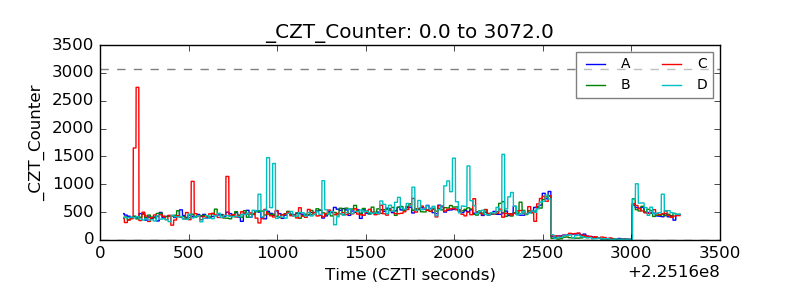 |
| +2.5 Volts monitor |  |
| +5 Volts monitor |  |
| _ROLL_ROT | 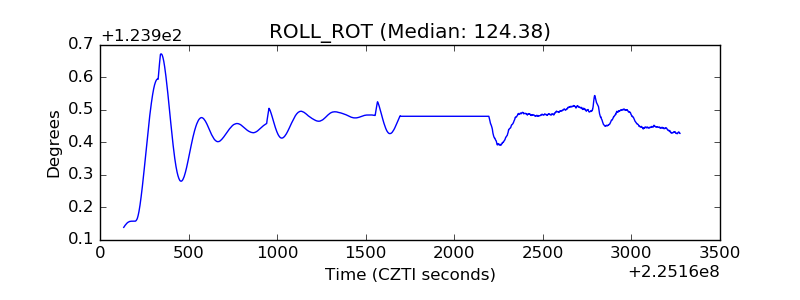 |
| _Roll_DEC | 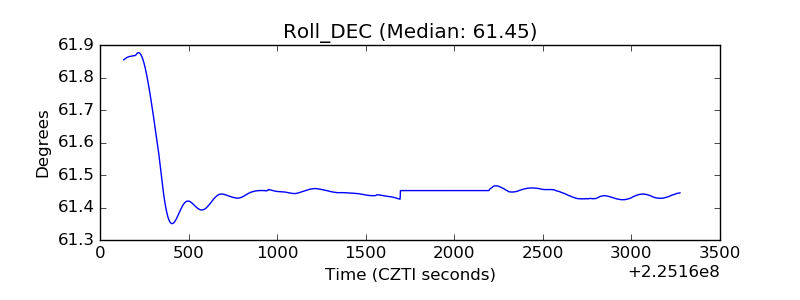 |
| _Roll_RA | 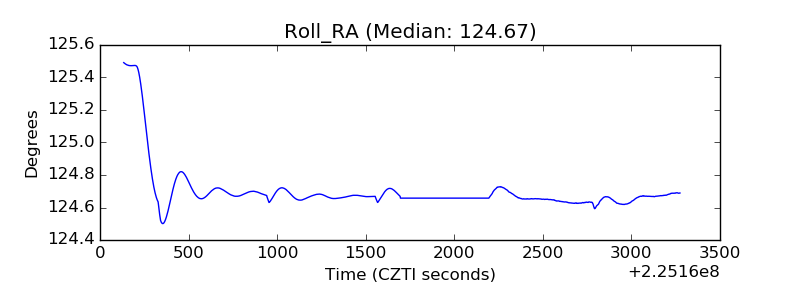 |
| Veto Counter | 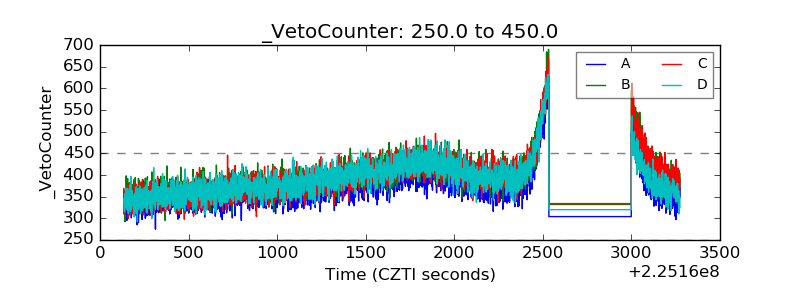 |