| Param | Original file | Final file |
|---|---|---|
| Filename | modeM0/AS1G06_164T01_9000001040_07550cztM0_level2.evt | modeM0/AS1G06_164T01_9000001040_07550cztM0_level2_quad_clean.evt |
| Size (bytes) | 1,235,491,200 | 242,945,280 |
| Size | 1.2 GB | 231.7 MB |
| Events in quadrant A | 8,498,701 | 1,523,106 |
| Events in quadrant B | 8,712,978 | 1,562,083 |
| Events in quadrant C | 8,546,584 | 1,528,418 |
| Events in quadrant D | 10,376,588 | 1,439,109 |
| Mode SS | |||
|---|---|---|---|
| Quadrant | BADHDUFLAG | Total packets | Discarded packets |
| A | 0 | 386 | 0 |
| B | 0 | 386 | 0 |
| C | 0 | 386 | 0 |
| D | 0 | 386 | 0 |
| Mode M0 | |||
|---|---|---|---|
| Quadrant | BADHDUFLAG | Total packets | Discarded packets |
| A | 0 | 38431 | 5 |
| B | 0 | 38750 | 4 |
| C | 0 | 38733 | 4 |
| D | 0 | 44370 | 4 |
| Mode M9 | |||
|---|---|---|---|
| Quadrant | BADHDUFLAG | Total packets | Discarded packets |
| A | 0 | 29 | 0 |
| B | 0 | 29 | 0 |
| C | 0 | 29 | 0 |
| D | 0 | 29 | 0 |
| Quadrant | Total seconds | Saturated seconds | Saturation percentage |
|---|---|---|---|
| A | 18951 | 120 | 0.633212% |
| B | 18951 | 152 | 0.802068% |
| C | 18951 | 77 | 0.406311% |
| D | 18951 | 484 | 2.553955% |
Noise dominated data is calculated using 1-second bins in cleaned event files. If a bin has >2000 counts, and if more than 50% of those come from <1% of pixels, then it is considered to be noise-dominated and hence unusable.
| Quadrant | # 1 sec bins | Bins with >0 counts | Bins with >2000 counts | High rate bins dominated by noise | Noise dominated (total time) | Noise dominated (detector-on time) | Marked lightcurve |
|---|---|---|---|---|---|---|---|
| A | 21806 | 18954 | 0 | 0 | 0.00% | 0.00% | 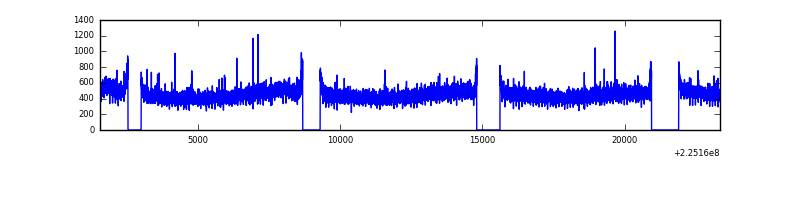 |
| B | 21806 | 18953 | 8 | 8 | 0.04% | 0.04% | 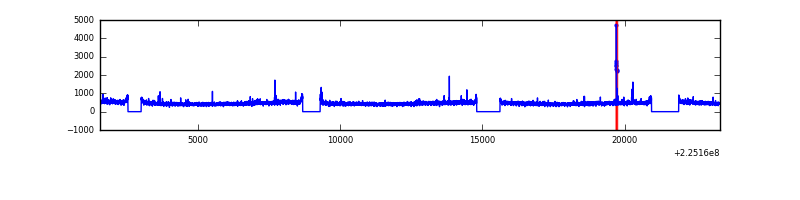 |
| C | 21806 | 18954 | 9 | 9 | 0.04% | 0.05% | 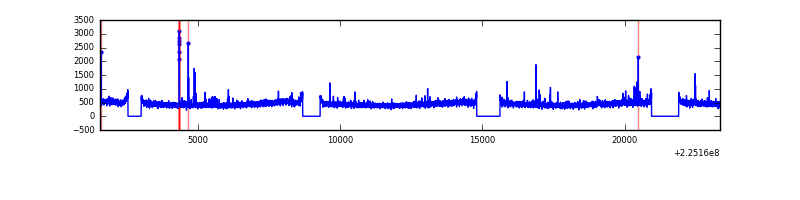 |
| D | 21806 | 18954 | 342 | 342 | 1.57% | 1.80% | 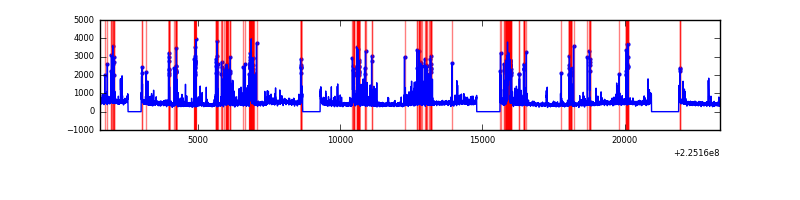 |
Top three noisy pixels from each quadrant. If the there are fewer than three noisy pixels in the level2.evt file, extra rows are filled as -1
| Pixel properties | Quadrant properties | ||||||
|---|---|---|---|---|---|---|---|
| Quadrant | DetID | PixID | Counts | Sigma | Mean | Median | Sigma |
| A | 0 | 226 | 20818 | 42.02 | 2194 | 2143 | 444.5 |
| A | 12 | 194 | 19178 | 38.33 | 2194 | 2143 | 444.5 |
| A | 13 | 14 | 19038 | 38.01 | 2194 | 2143 | 444.5 |
| B | 12 | 111 | 42820 | 97.15 | 2216 | 2158 | 418.6 |
| B | 10 | 246 | 38992 | 88.0 | 2216 | 2158 | 418.6 |
| B | 0 | 214 | 35421 | 79.47 | 2216 | 2158 | 418.6 |
| C | 9 | 68 | 78953 | 154.74 | 2142 | 2150 | 496.3 |
| C | 8 | 229 | 64793 | 126.21 | 2142 | 2150 | 496.3 |
| C | 1 | 16 | 39922 | 76.1 | 2142 | 2150 | 496.3 |
| D | 2 | 152 | 1182558 | 2279.21 | 2120 | 2048 | 517.9 |
| D | 2 | 14 | 579347 | 1114.59 | 2120 | 2048 | 517.9 |
| D | 13 | 169 | 148618 | 282.98 | 2120 | 2048 | 517.9 |
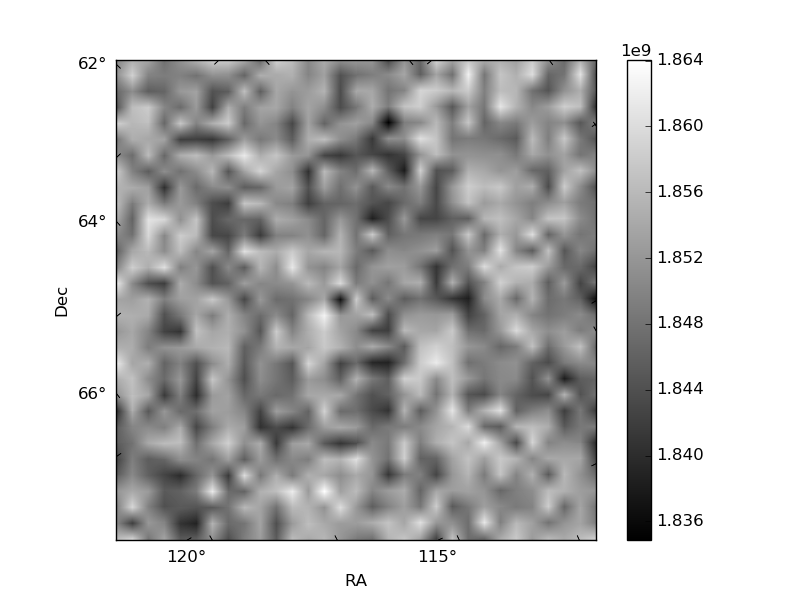
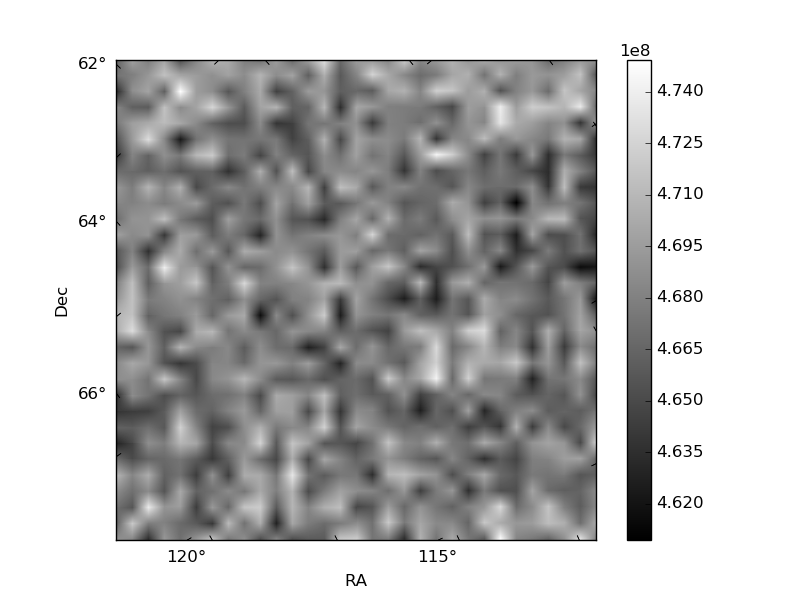
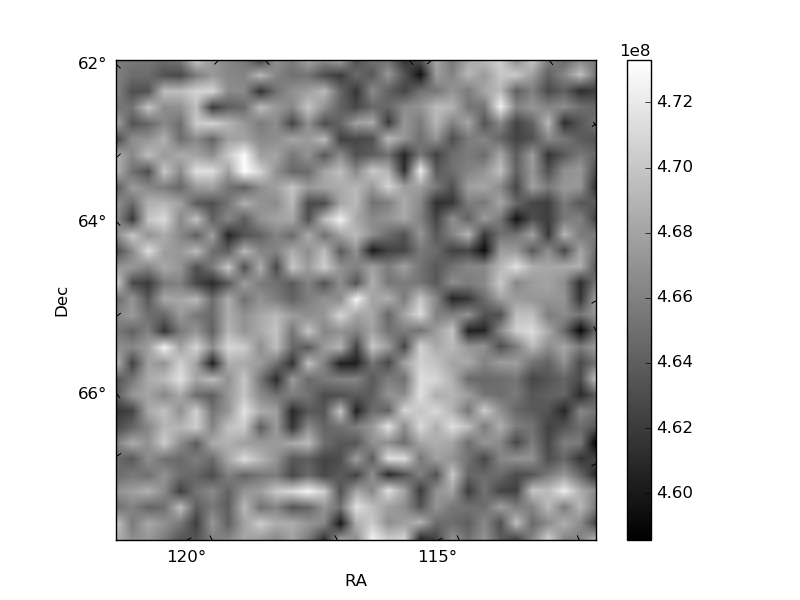
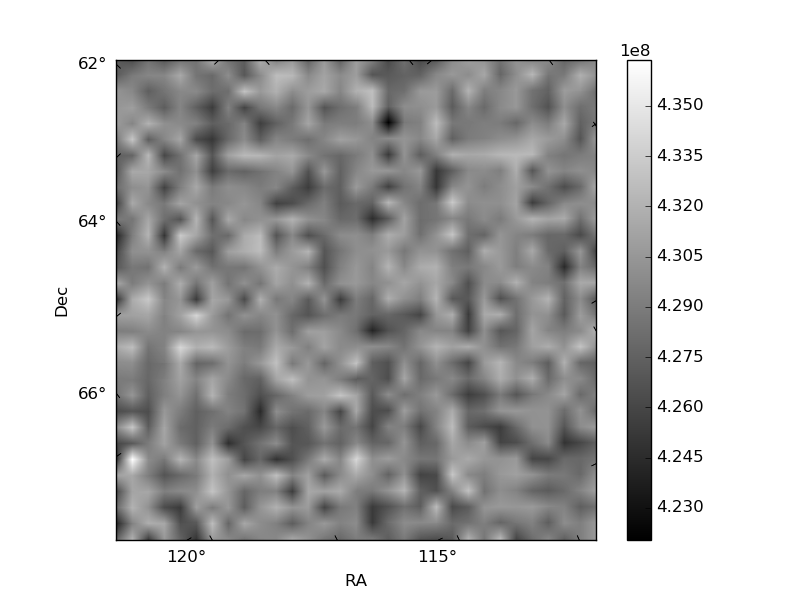
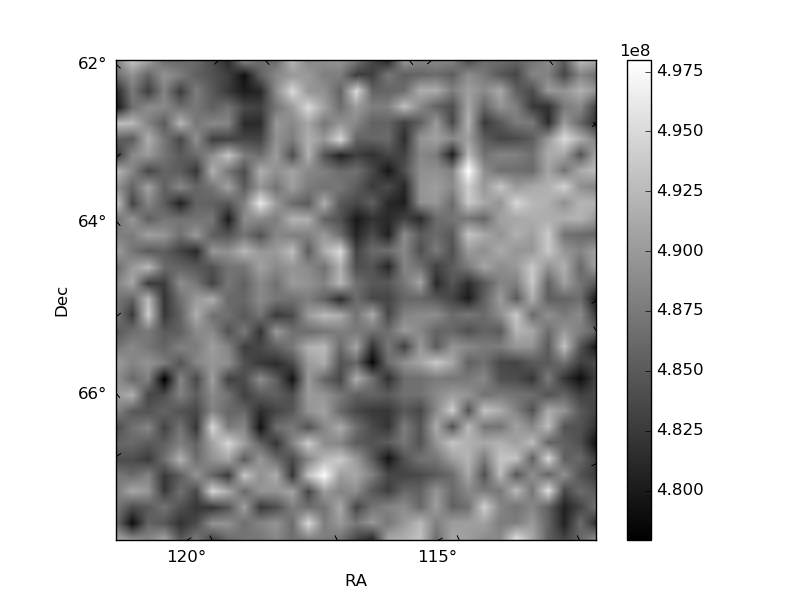
Histogram calculated using DETX and DETY for each event in the final _common_clean file
| Quadrant A | 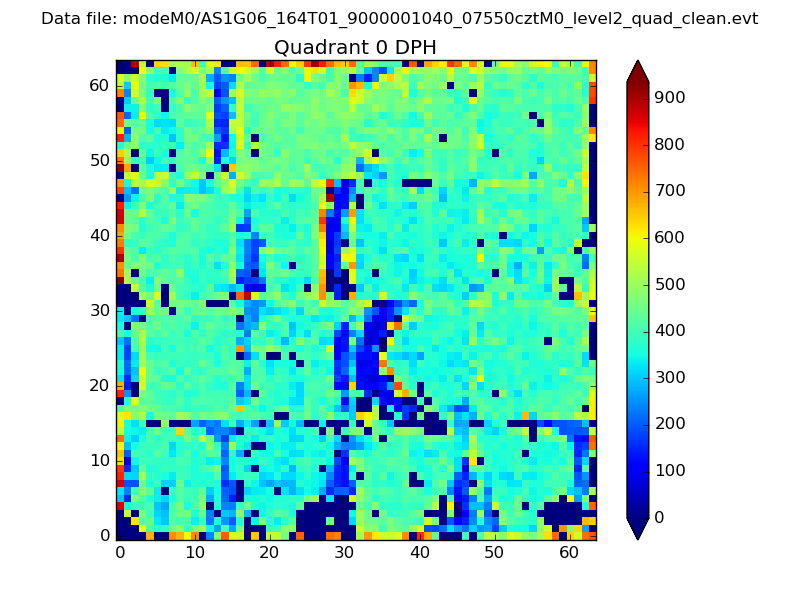 |
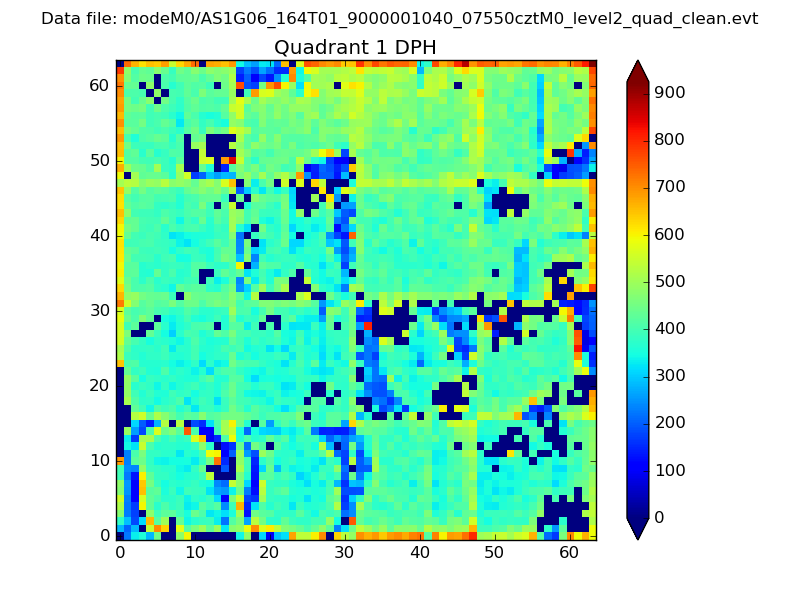 |
Quadrant B |
|---|---|---|---|
| Quadrant D | 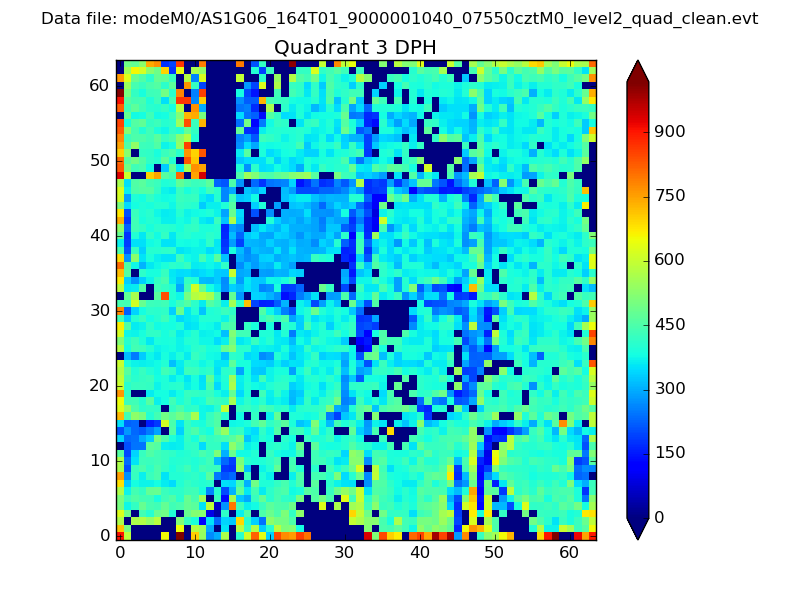 |
 |
Quadrant C |
| Plot type | Count rate plots | Images |
|---|---|---|
| Comparison with Poisson distribution Blue bars denote a histogram of data divided into 1 sec bins. Red curve is a Poisson curve with rate = median count rate of data. |
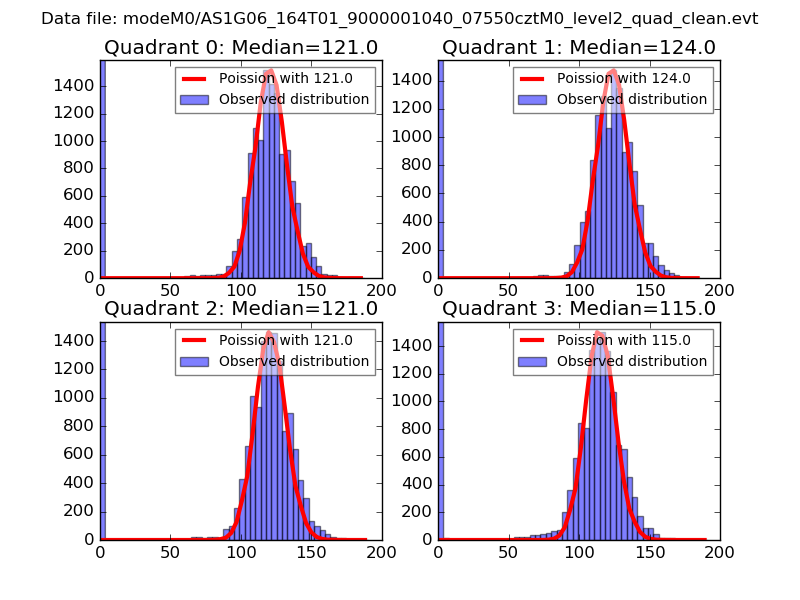 |
 |
| Quadrant-wise count rates Data is divided into 100 sec bins |
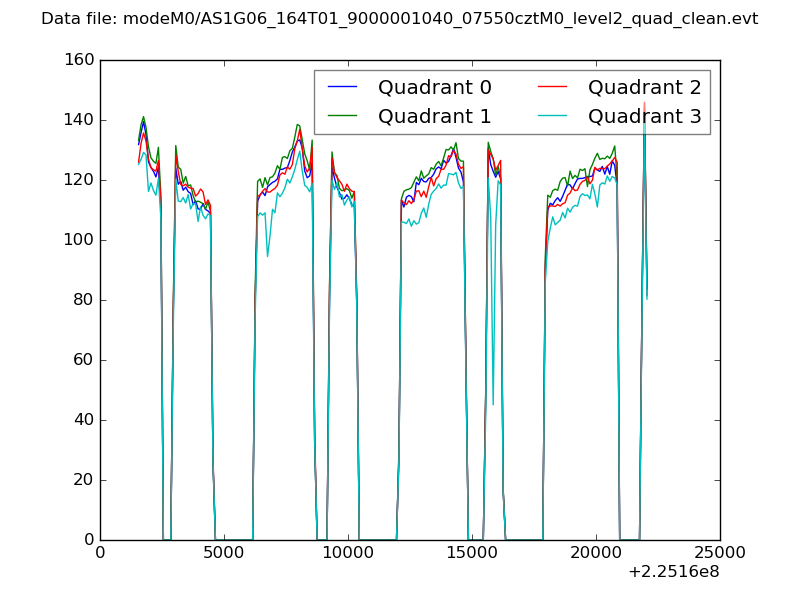 |
|
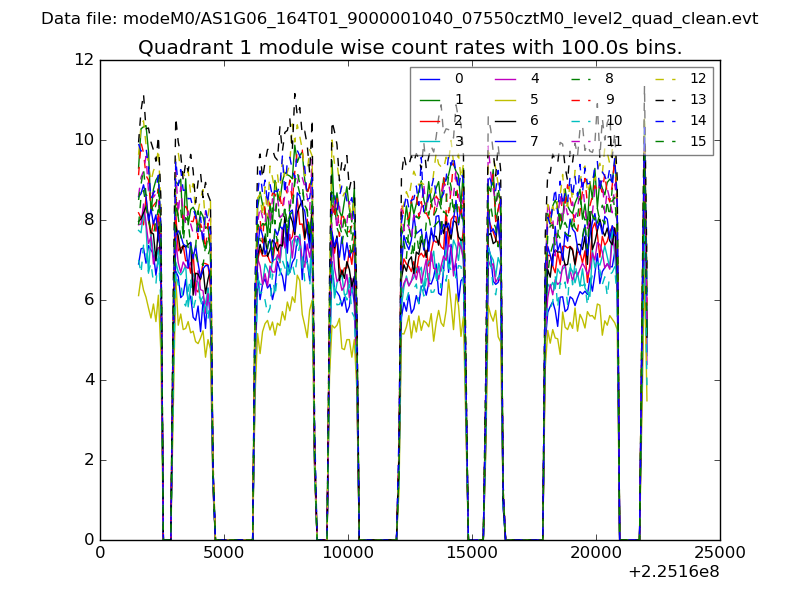
| Module-wise count rates for Quadrant A Data is divided into 100 sec bins |
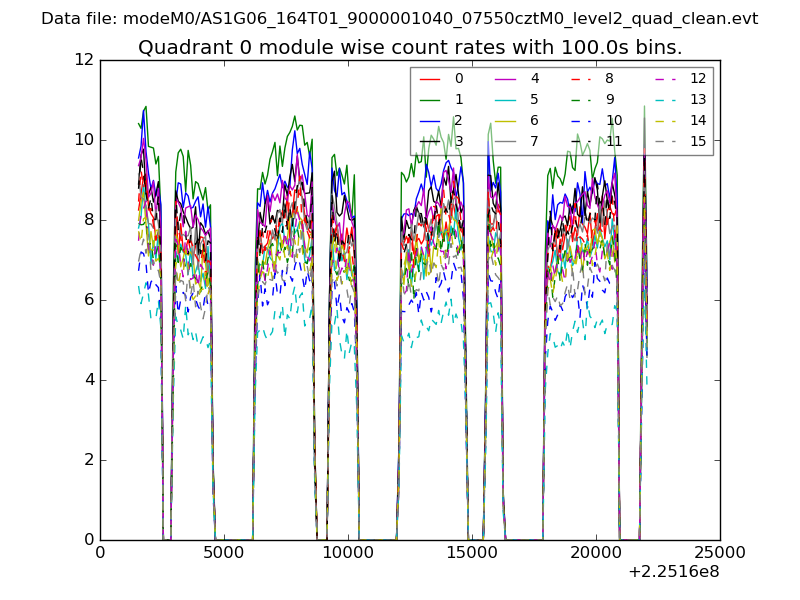 |
 |
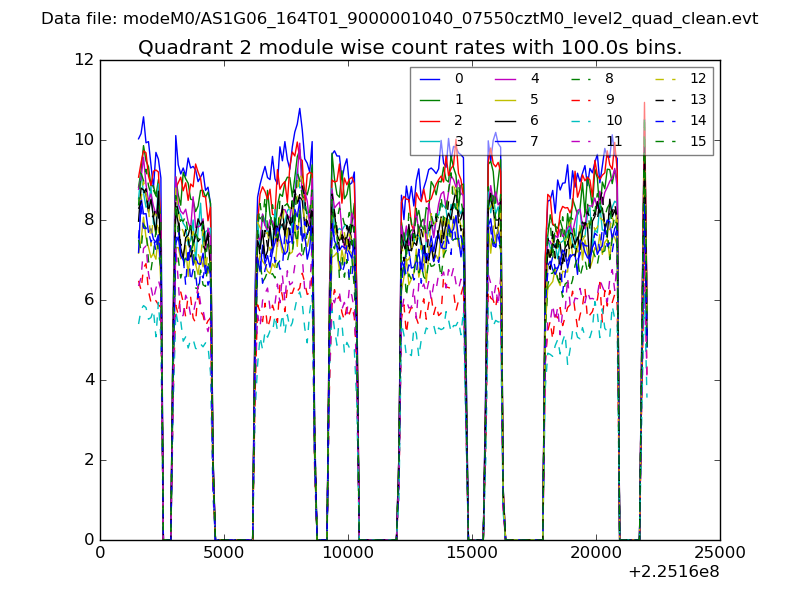
| Module-wise count rates for Quadrant B Data is divided into 100 sec bins |
 |
 |
| Module-wise count rates for Quadrant C Data is divided into 100 sec bins |
 |
 |
| Module-wise count rates for Quadrant D Data is divided into 100 sec bins |
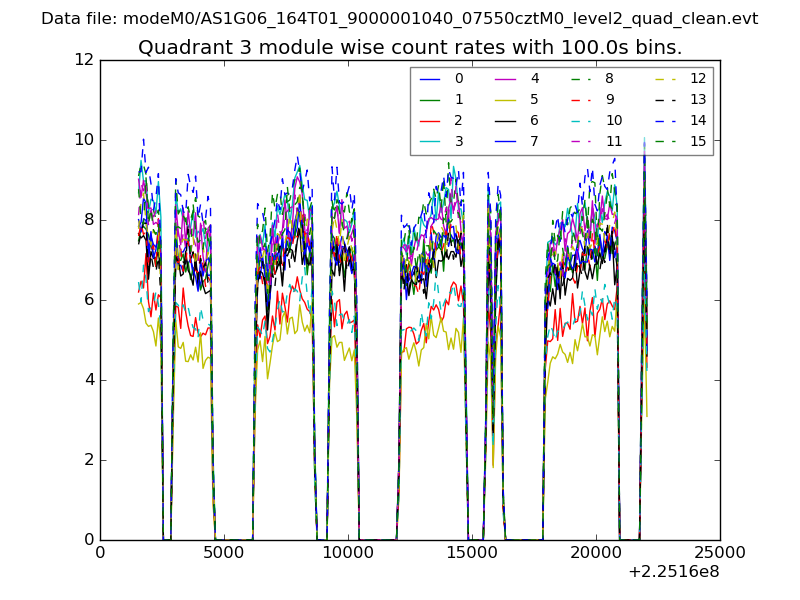 |
 |
| Parameter | Plot |
|---|---|
| CZT HV Monitor | 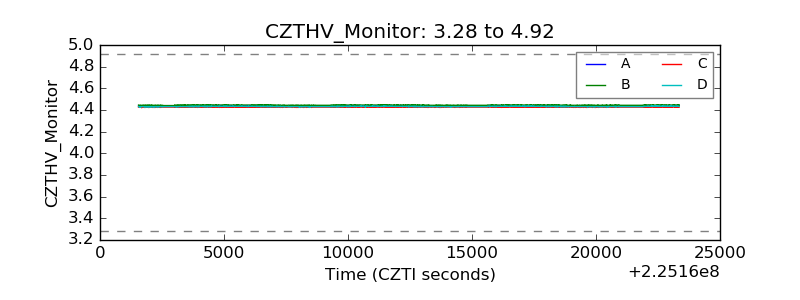 |
| D_VDD | 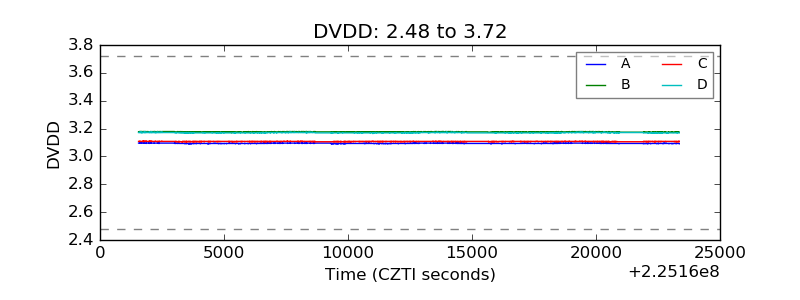 |
| Temperature 1 |  |
| Veto HV Monitor | 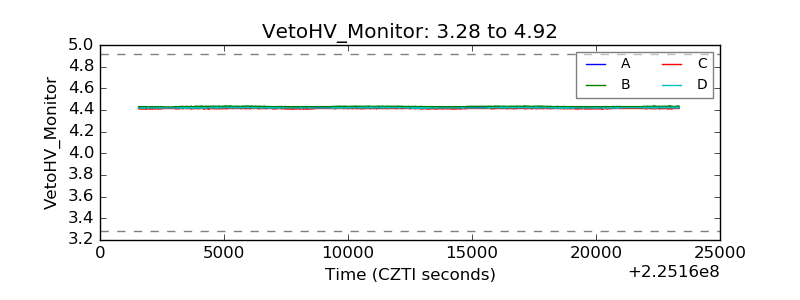 |
| Veto LLD | 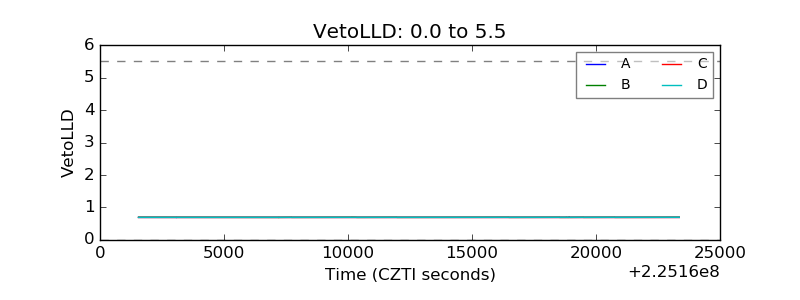 |
| Alpha Counter | 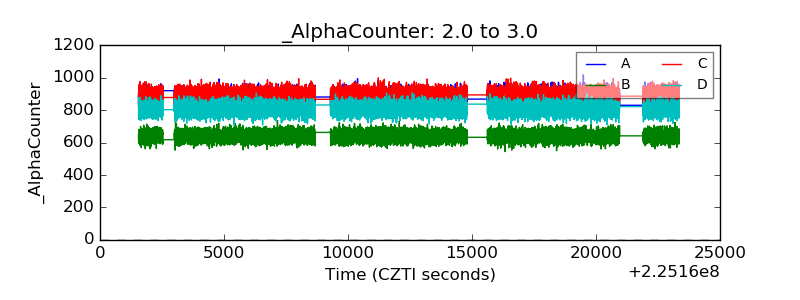 |
| _CPM_Rate | 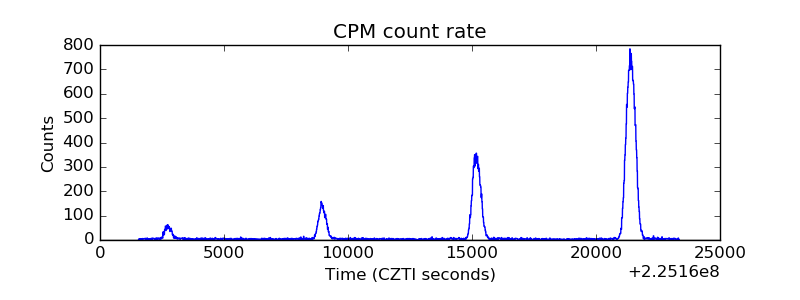 |
| CZT Counter | 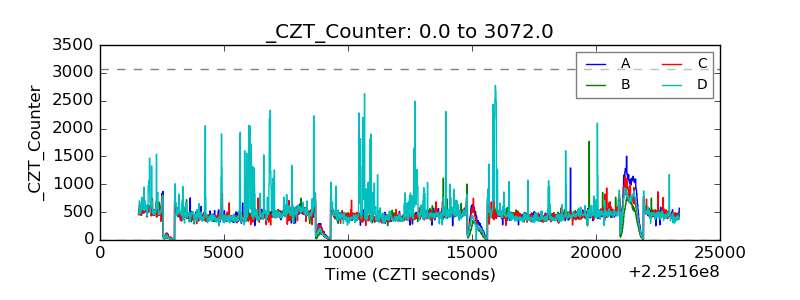 |
| +2.5 Volts monitor |  |
| +5 Volts monitor | 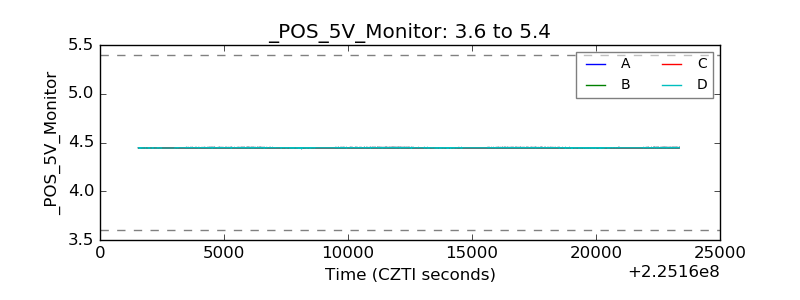 |
| _ROLL_ROT | 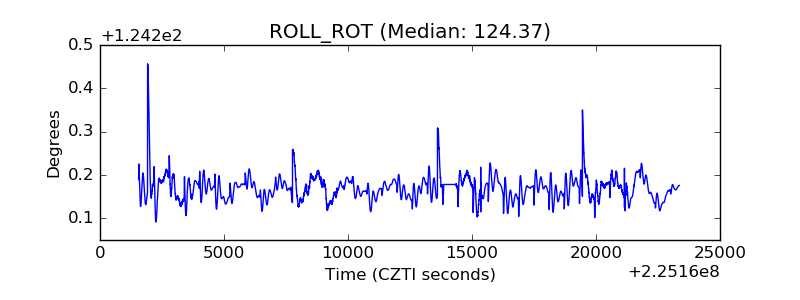 |
| _Roll_DEC | 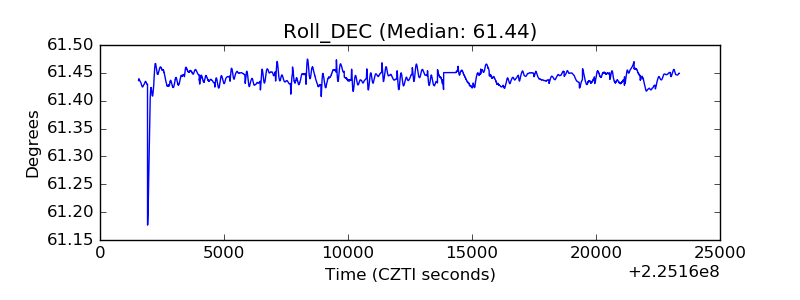 |
| _Roll_RA | 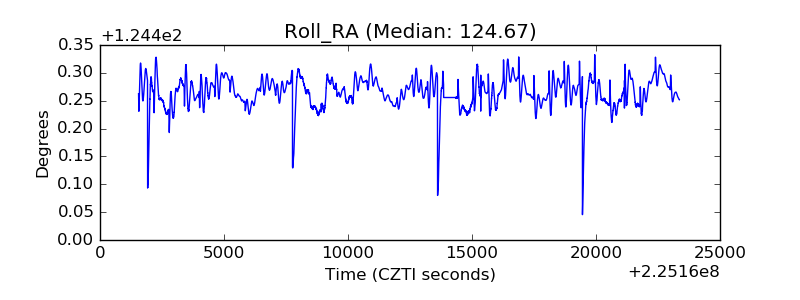 |
| Veto Counter | 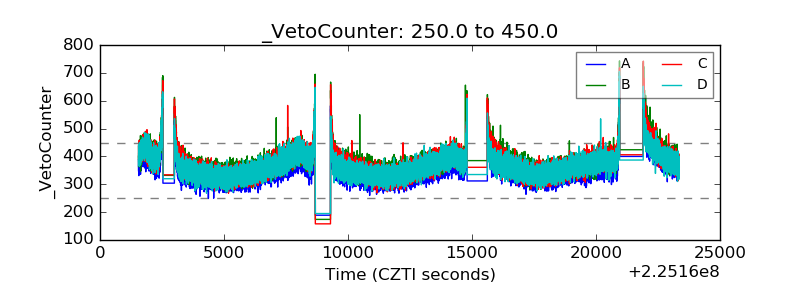 |