| Param | Original file | Final file |
|---|---|---|
| Filename | modeM0/AS1G06_164T01_9000001040_07552cztM0_level2.evt | modeM0/AS1G06_164T01_9000001040_07552cztM0_level2_quad_clean.evt |
| Size (bytes) | 450,630,720 | 78,710,400 |
| Size | 429.8 MB | 75.1 MB |
| Events in quadrant A | 3,275,933 | 477,256 |
| Events in quadrant B | 3,329,358 | 486,953 |
| Events in quadrant C | 3,267,423 | 476,380 |
| Events in quadrant D | 3,298,832 | 455,380 |
| Mode SS | |||
|---|---|---|---|
| Quadrant | BADHDUFLAG | Total packets | Discarded packets |
| A | 0 | 142 | 0 |
| B | 0 | 142 | 0 |
| C | 0 | 142 | 0 |
| D | 0 | 142 | 0 |
| Mode M0 | |||
|---|---|---|---|
| Quadrant | BADHDUFLAG | Total packets | Discarded packets |
| A | 0 | 14388 | 3 |
| B | 0 | 14434 | 2 |
| C | 0 | 14404 | 2 |
| D | 0 | 14717 | 2 |
| Mode M9 | |||
|---|---|---|---|
| Quadrant | BADHDUFLAG | Total packets | Discarded packets |
| A | 0 | 21 | 0 |
| B | 0 | 21 | 0 |
| C | 0 | 21 | 0 |
| D | 0 | 21 | 0 |
| Quadrant | Total seconds | Saturated seconds | Saturation percentage |
|---|---|---|---|
| A | 7005 | 92 | 1.313348% |
| B | 7005 | 99 | 1.413276% |
| C | 7005 | 62 | 0.885082% |
| D | 7005 | 103 | 1.470378% |
Noise dominated data is calculated using 1-second bins in cleaned event files. If a bin has >2000 counts, and if more than 50% of those come from <1% of pixels, then it is considered to be noise-dominated and hence unusable.
| Quadrant | # 1 sec bins | Bins with >0 counts | Bins with >2000 counts | High rate bins dominated by noise | Noise dominated (total time) | Noise dominated (detector-on time) | Marked lightcurve |
|---|---|---|---|---|---|---|---|
| A | 9040 | 7005 | 0 | 0 | 0.00% | 0.00% | 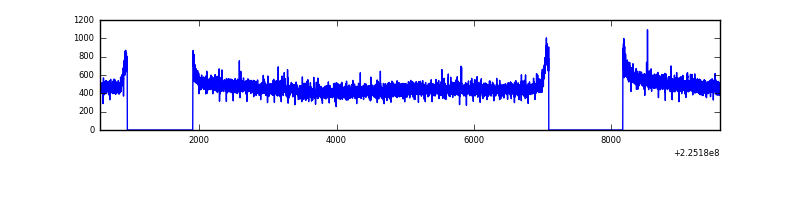 |
| B | 9040 | 7005 | 0 | 0 | 0.00% | 0.00% | 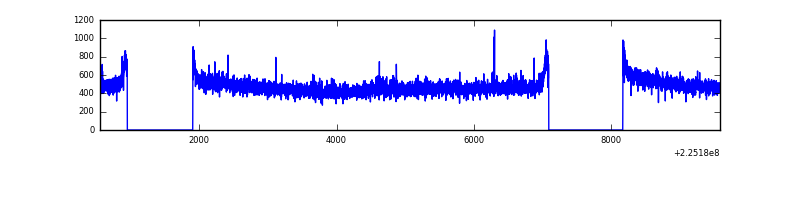 |
| C | 9040 | 7005 | 0 | 0 | 0.00% | 0.00% | 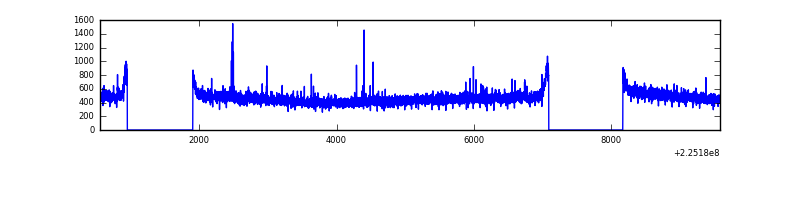 |
| D | 9040 | 7005 | 21 | 21 | 0.23% | 0.30% | 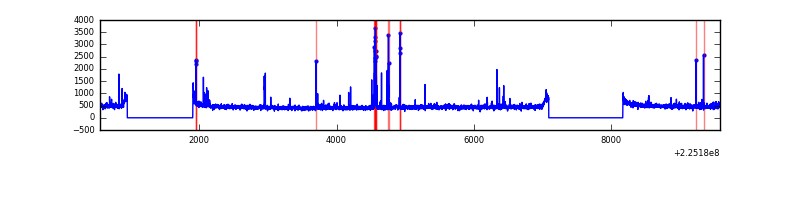 |
Top three noisy pixels from each quadrant. If the there are fewer than three noisy pixels in the level2.evt file, extra rows are filled as -1
| Pixel properties | Quadrant properties | ||||||
|---|---|---|---|---|---|---|---|
| Quadrant | DetID | PixID | Counts | Sigma | Mean | Median | Sigma |
| A | 0 | 226 | 8010 | 41.64 | 849 | 831 | 172.4 |
| A | 12 | 194 | 7275 | 37.38 | 849 | 831 | 172.4 |
| A | 15 | 239 | 4183 | 19.44 | 849 | 831 | 172.4 |
| B | 12 | 111 | 16828 | 98.46 | 854 | 832 | 162.5 |
| B | 0 | 214 | 13620 | 78.71 | 854 | 832 | 162.5 |
| B | 11 | 111 | 13251 | 76.44 | 854 | 832 | 162.5 |
| C | 9 | 68 | 46752 | 241.59 | 820 | 823 | 190.1 |
| C | 13 | 61 | 6542 | 30.08 | 820 | 823 | 190.1 |
| C | 8 | 222 | 5632 | 25.3 | 820 | 823 | 190.1 |
| D | 2 | 14 | 95235 | 470.33 | 819 | 792 | 200.8 |
| D | 2 | 152 | 43340 | 211.89 | 819 | 792 | 200.8 |
| D | 2 | 136 | 17936 | 85.38 | 819 | 792 | 200.8 |
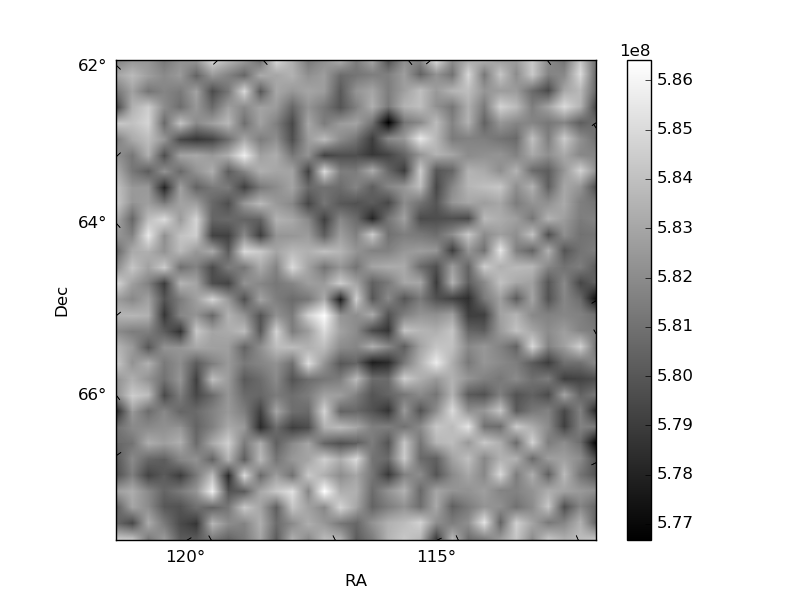
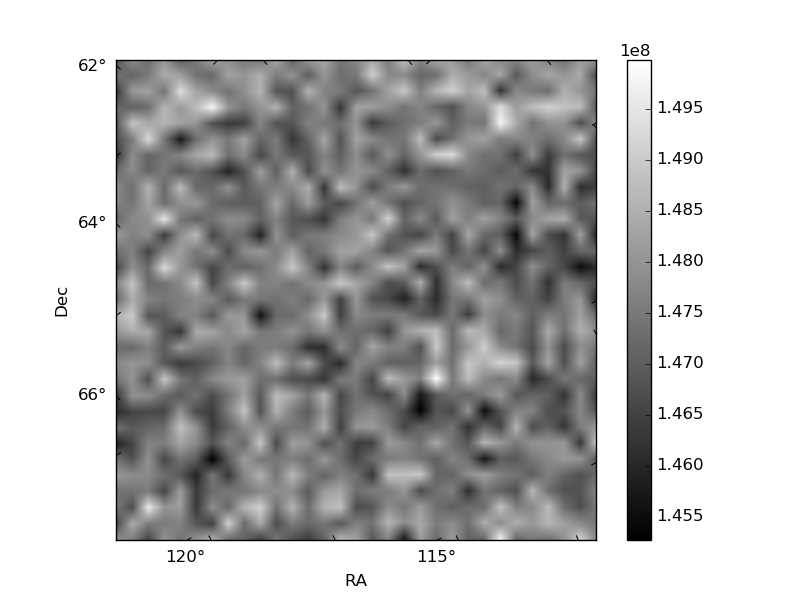
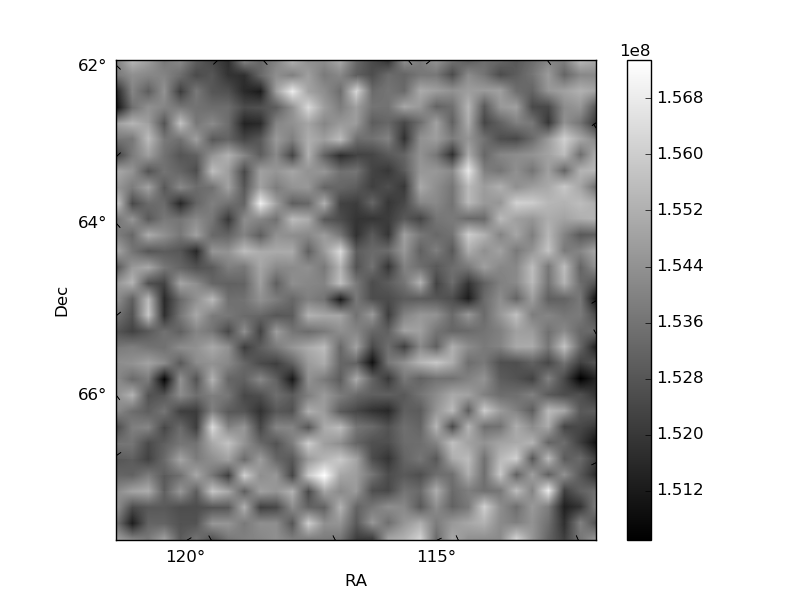
Histogram calculated using DETX and DETY for each event in the final _common_clean file
| Quadrant A | 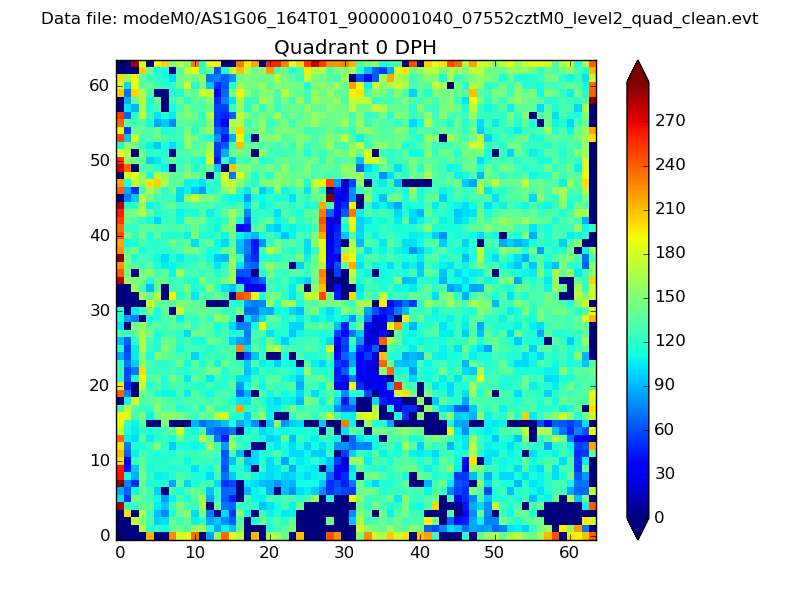 |
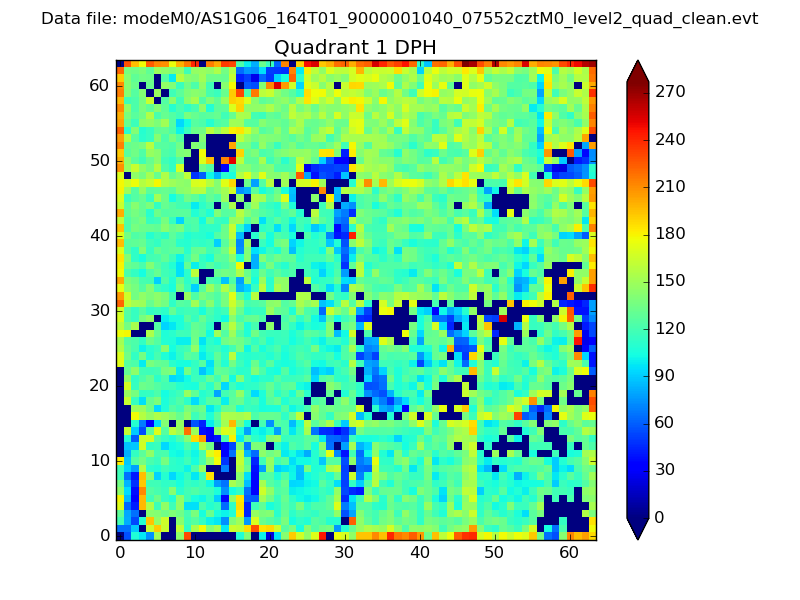 |
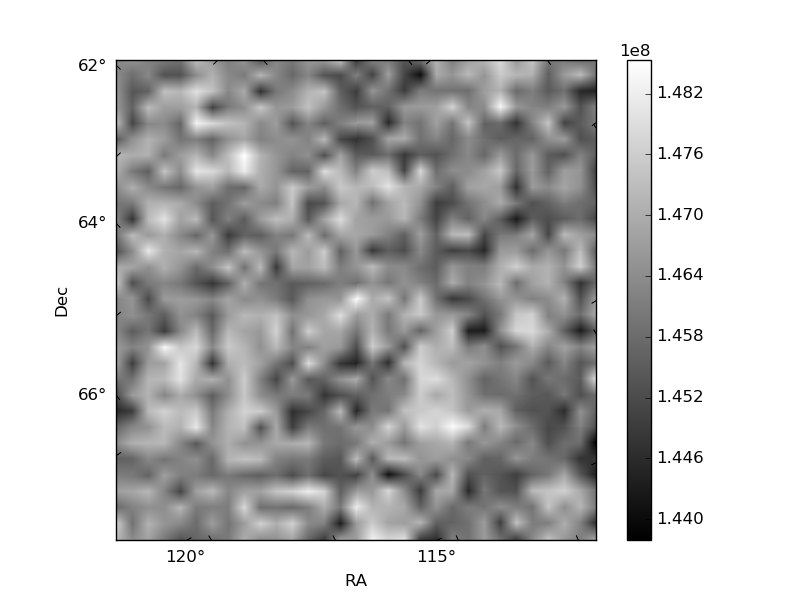
Quadrant B |
|---|---|---|---|
| Quadrant D | 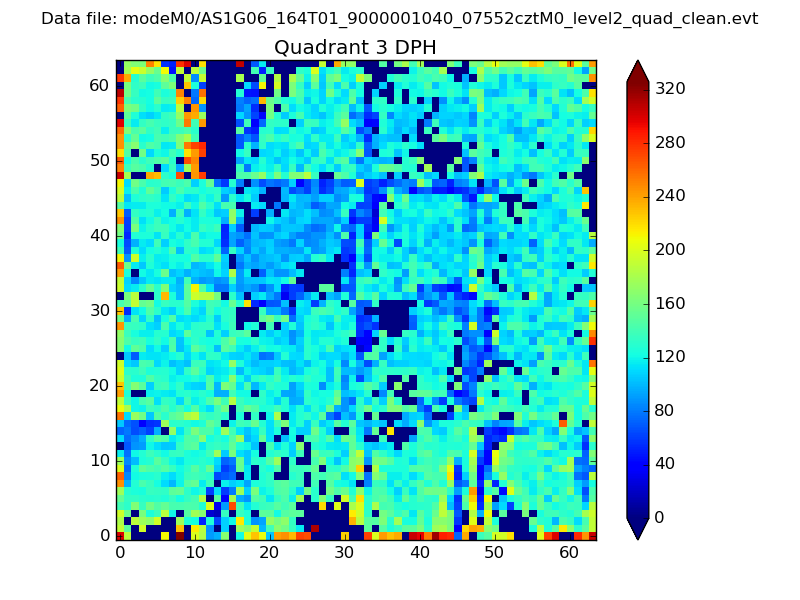 |
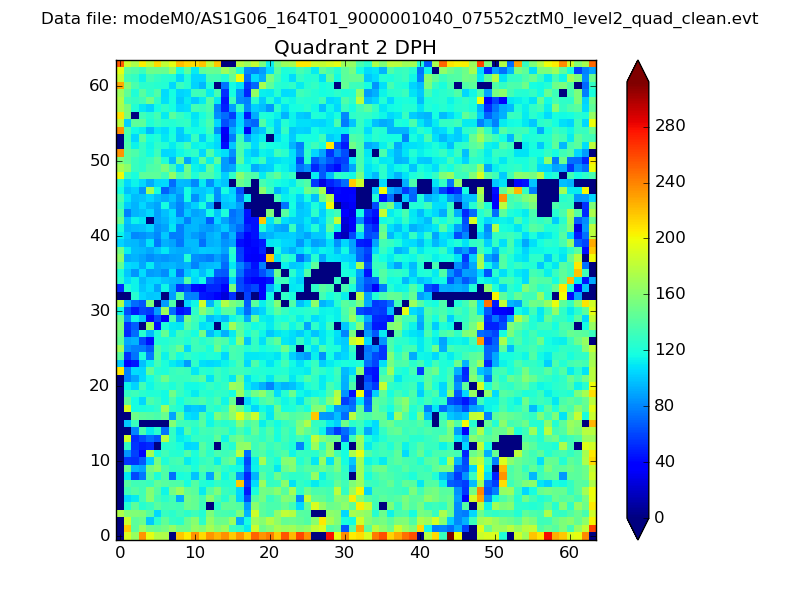 |
Quadrant C |
| Plot type | Count rate plots | Images |
|---|---|---|
| Comparison with Poisson distribution Blue bars denote a histogram of data divided into 1 sec bins. Red curve is a Poisson curve with rate = median count rate of data. |
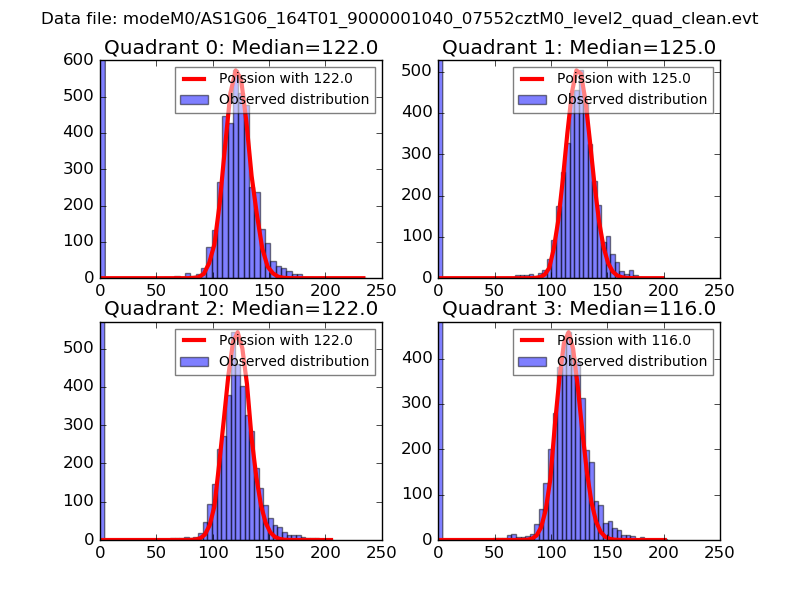 |
 |
| Quadrant-wise count rates Data is divided into 100 sec bins |
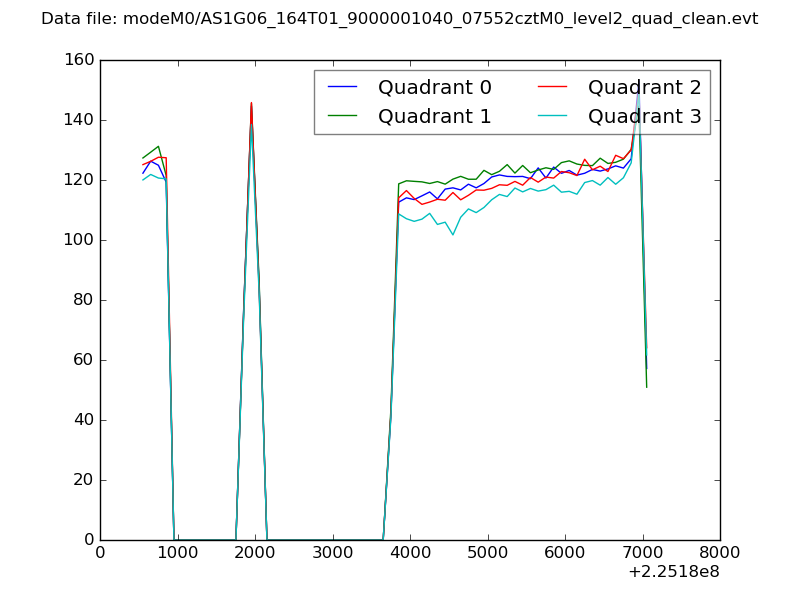 |
|
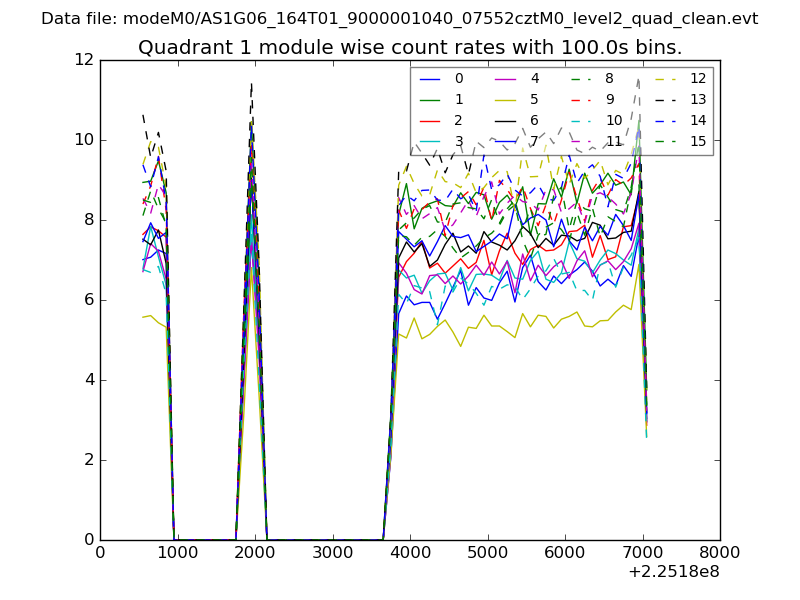
| Module-wise count rates for Quadrant A Data is divided into 100 sec bins |
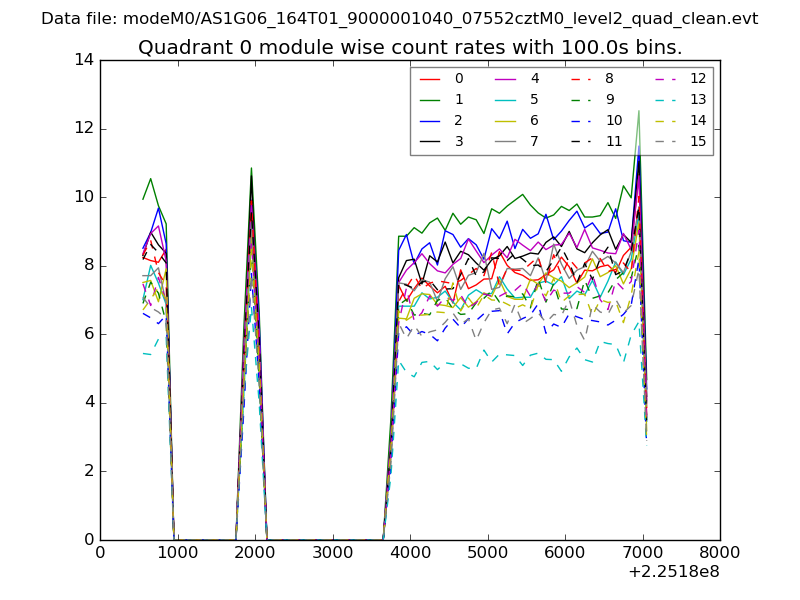 |
 |
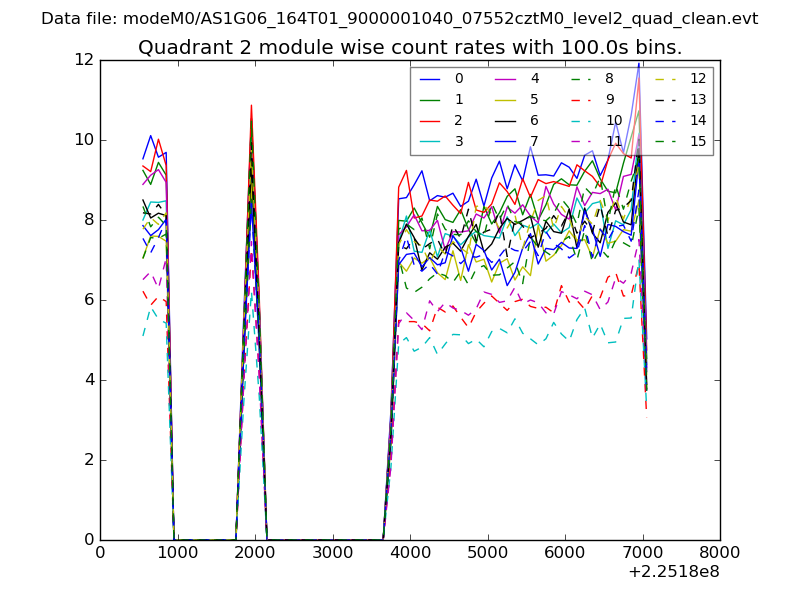
| Module-wise count rates for Quadrant B Data is divided into 100 sec bins |
 |
 |
| Module-wise count rates for Quadrant C Data is divided into 100 sec bins |
 |
 |
| Module-wise count rates for Quadrant D Data is divided into 100 sec bins |
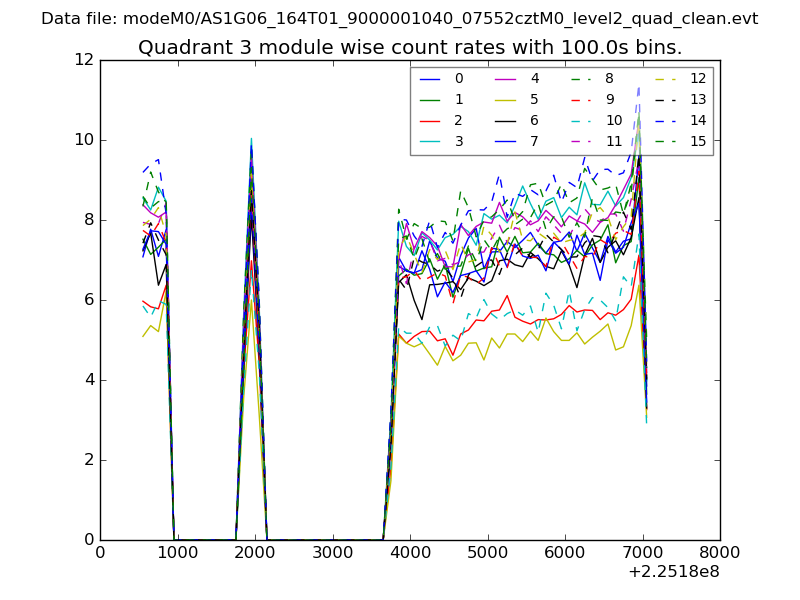 |
 |
| Parameter | Plot |
|---|---|
| CZT HV Monitor | 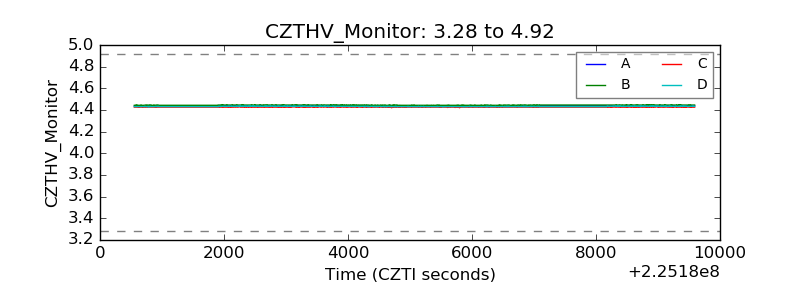 |
| D_VDD | 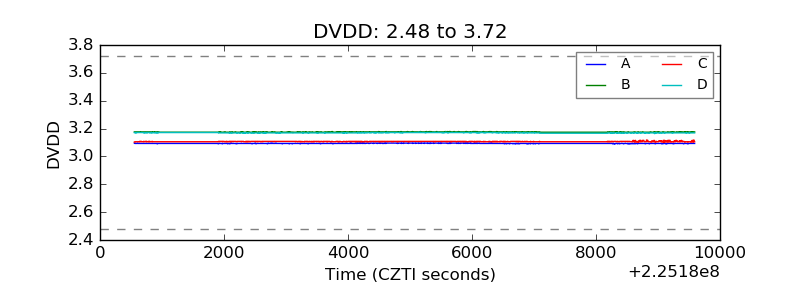 |
| Temperature 1 | 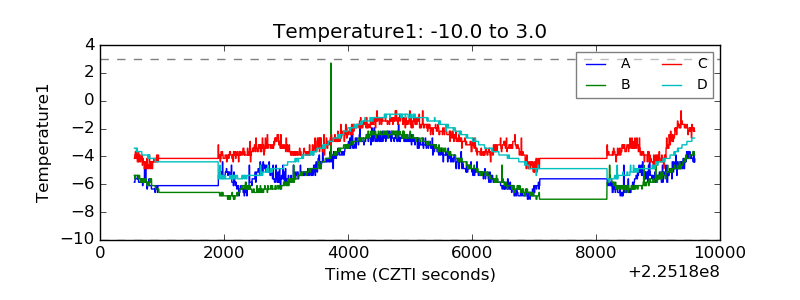 |
| Veto HV Monitor | 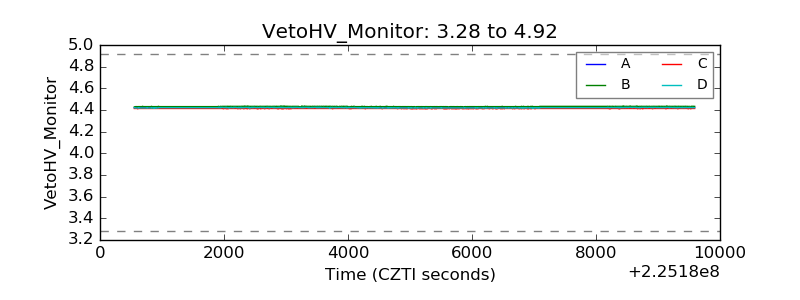 |
| Veto LLD | 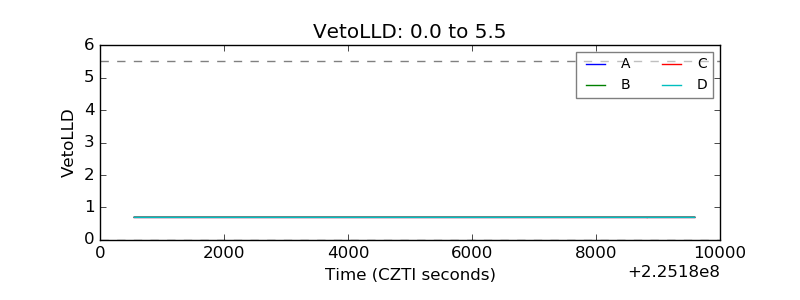 |
| Alpha Counter | 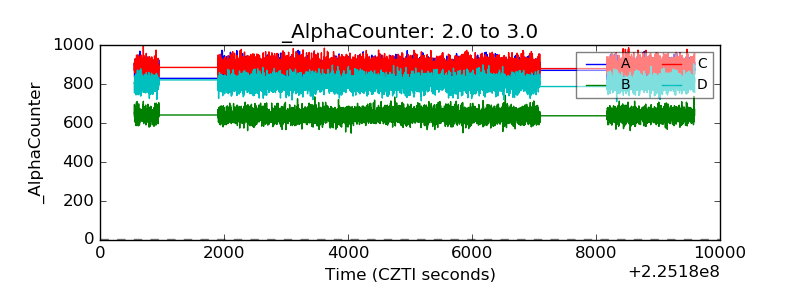 |
| _CPM_Rate | 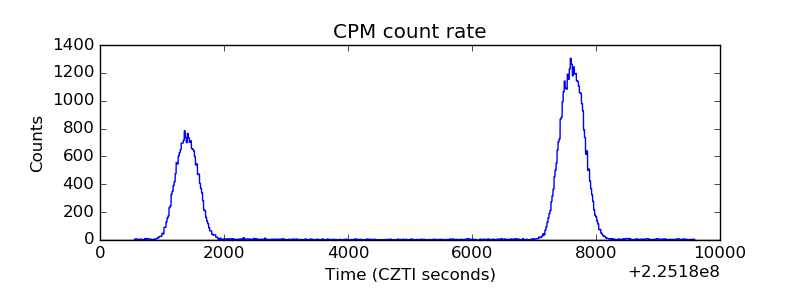 |
| CZT Counter | 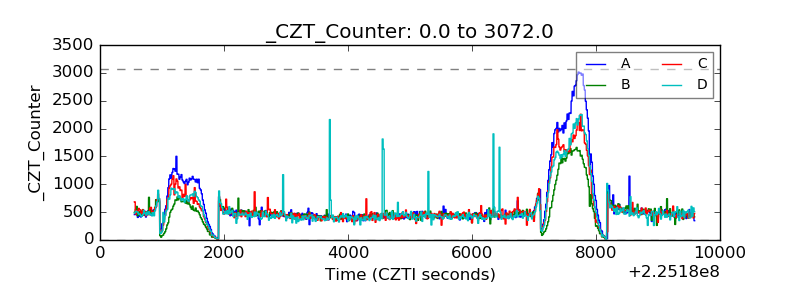 |
| +2.5 Volts monitor |  |
| +5 Volts monitor |  |
| _ROLL_ROT | 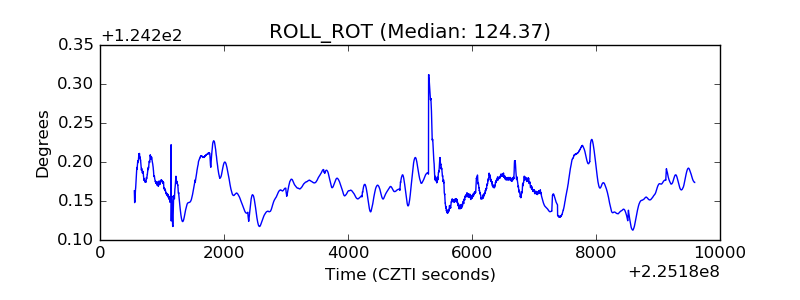 |
| _Roll_DEC | 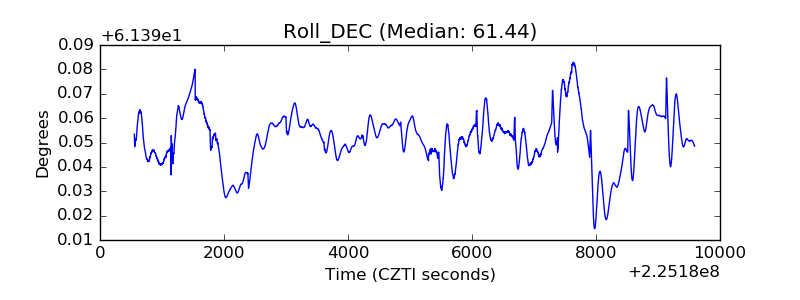 |
| _Roll_RA | 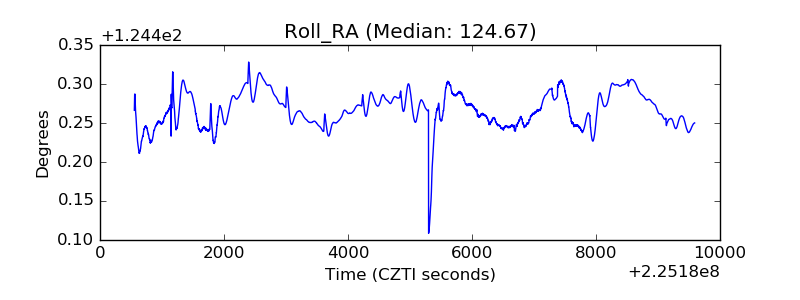 |
| Veto Counter | 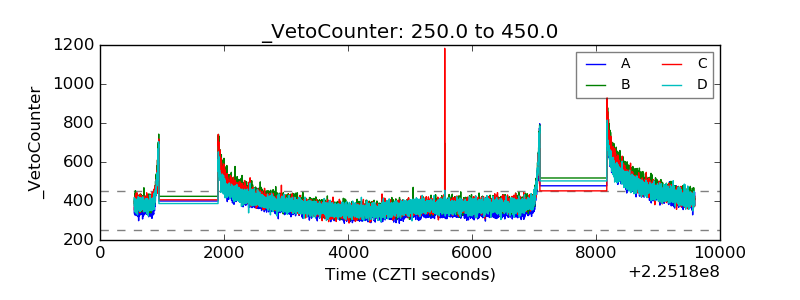 |