| Param | Original file | Final file |
|---|---|---|
| Filename | modeM0/AS1G06_164T01_9000001040_07553cztM0_level2.evt | modeM0/AS1G06_164T01_9000001040_07553cztM0_level2_quad_clean.evt |
| Size (bytes) | 443,908,800 | 78,762,240 |
| Size | 423.3 MB | 75.1 MB |
| Events in quadrant A | 3,188,372 | 489,555 |
| Events in quadrant B | 3,153,513 | 501,846 |
| Events in quadrant C | 3,152,570 | 481,841 |
| Events in quadrant D | 3,510,951 | 461,789 |
| Mode SS | |||
|---|---|---|---|
| Quadrant | BADHDUFLAG | Total packets | Discarded packets |
| A | 0 | 132 | 0 |
| B | 0 | 132 | 0 |
| C | 0 | 132 | 0 |
| D | 0 | 132 | 0 |
| Mode M0 | |||
|---|---|---|---|
| Quadrant | BADHDUFLAG | Total packets | Discarded packets |
| A | 0 | 13521 | 3 |
| B | 0 | 13462 | 2 |
| C | 0 | 13536 | 2 |
| D | 0 | 14629 | 2 |
| Mode M9 | |||
|---|---|---|---|
| Quadrant | BADHDUFLAG | Total packets | Discarded packets |
| A | 0 | 18 | 0 |
| B | 0 | 18 | 0 |
| C | 0 | 18 | 0 |
| D | 0 | 19 | 0 |
| Quadrant | Total seconds | Saturated seconds | Saturation percentage |
|---|---|---|---|
| A | 6445 | 85 | 1.318852% |
| B | 6445 | 82 | 1.272304% |
| C | 6445 | 69 | 1.070597% |
| D | 6445 | 114 | 1.768813% |
Noise dominated data is calculated using 1-second bins in cleaned event files. If a bin has >2000 counts, and if more than 50% of those come from <1% of pixels, then it is considered to be noise-dominated and hence unusable.
| Quadrant | # 1 sec bins | Bins with >0 counts | Bins with >2000 counts | High rate bins dominated by noise | Noise dominated (total time) | Noise dominated (detector-on time) | Marked lightcurve |
|---|---|---|---|---|---|---|---|
| A | 7635 | 6445 | 2 | 2 | 0.03% | 0.03% | 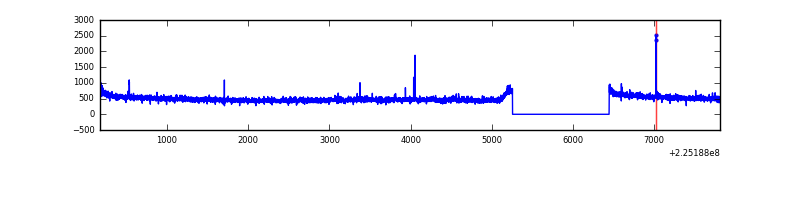 |
| B | 7635 | 6445 | 0 | 0 | 0.00% | 0.00% | 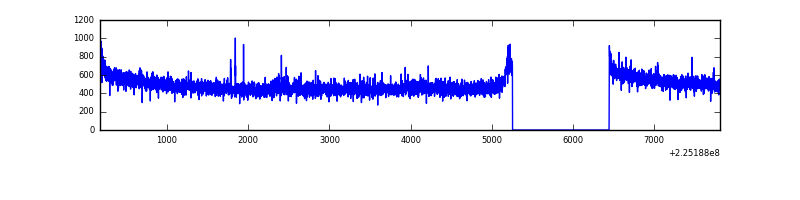 |
| C | 7635 | 6445 | 15 | 15 | 0.20% | 0.23% | 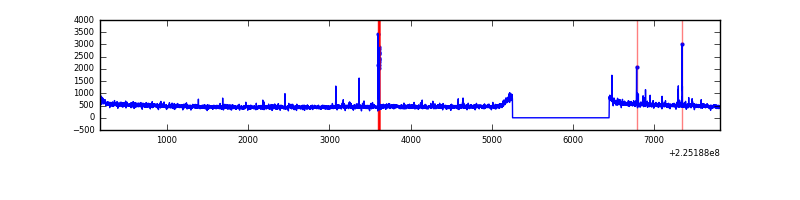 |
| D | 7635 | 6445 | 46 | 46 | 0.60% | 0.71% | 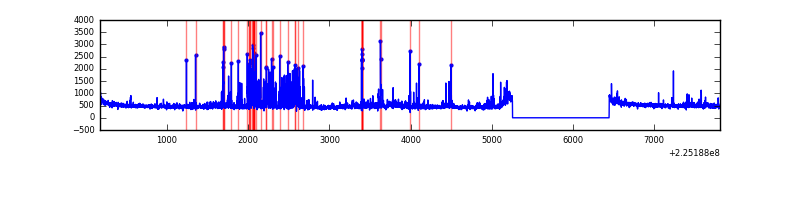 |
Top three noisy pixels from each quadrant. If the there are fewer than three noisy pixels in the level2.evt file, extra rows are filled as -1
| Pixel properties | Quadrant properties | ||||||
|---|---|---|---|---|---|---|---|
| Quadrant | DetID | PixID | Counts | Sigma | Mean | Median | Sigma |
| A | 14 | 111 | 42855 | 258.01 | 810 | 794 | 163.0 |
| A | 15 | 239 | 17118 | 100.13 | 810 | 794 | 163.0 |
| A | 13 | 14 | 11499 | 65.67 | 810 | 794 | 163.0 |
| B | 0 | 214 | 15903 | 99.03 | 809 | 790 | 152.6 |
| B | 12 | 111 | 15628 | 97.23 | 809 | 790 | 152.6 |
| B | 11 | 111 | 12299 | 75.42 | 809 | 790 | 152.6 |
| C | 9 | 68 | 77333 | 430.45 | 775 | 779 | 177.8 |
| C | 1 | 16 | 26323 | 143.63 | 775 | 779 | 177.8 |
| C | 8 | 128 | 11860 | 62.31 | 775 | 779 | 177.8 |
| D | 2 | 152 | 462242 | 2435.56 | 777 | 751 | 189.5 |
| D | 2 | 14 | 32412 | 167.09 | 777 | 751 | 189.5 |
| D | 12 | 233 | 27050 | 138.8 | 777 | 751 | 189.5 |
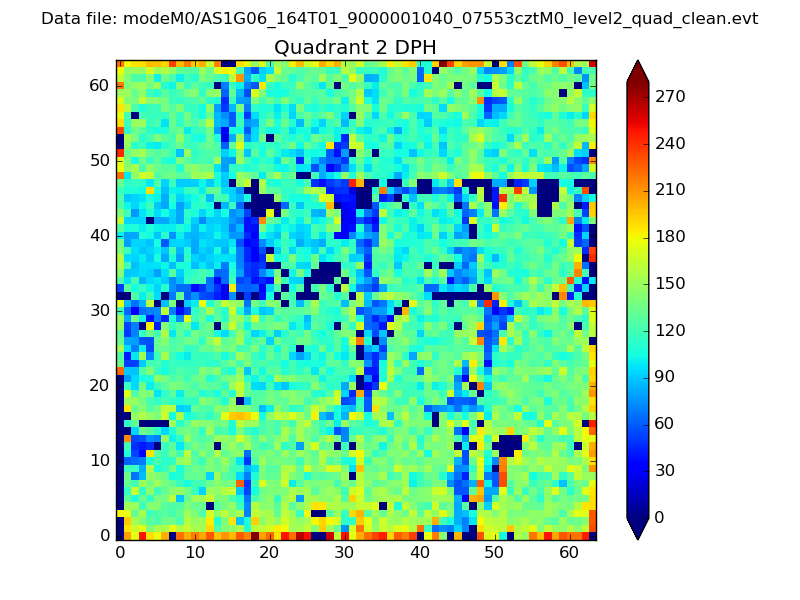
Histogram calculated using DETX and DETY for each event in the final _common_clean file
| Quadrant A | 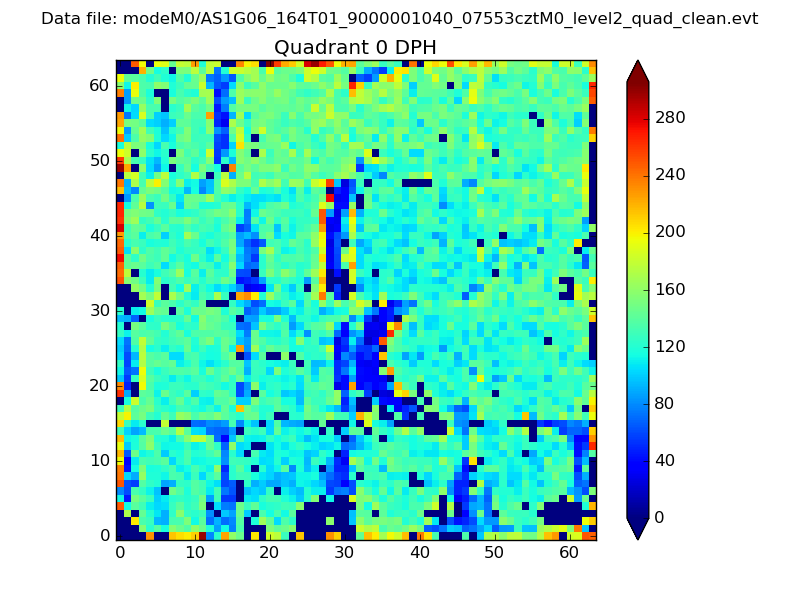 |
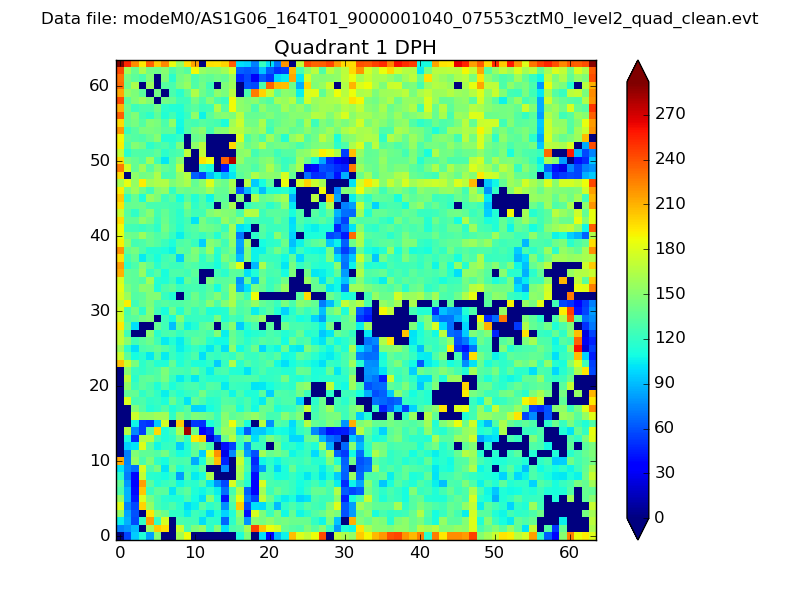 |
Quadrant B |
|---|---|---|---|
| Quadrant D | 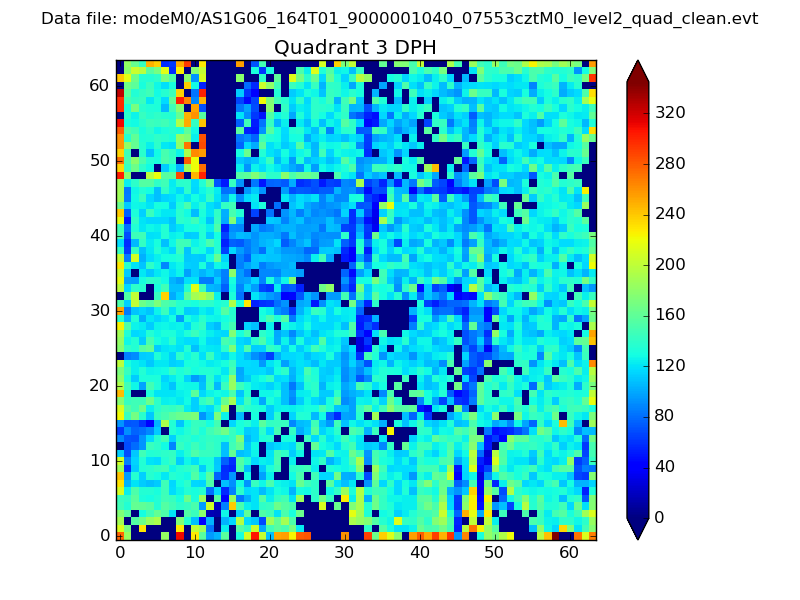 |
 |
Quadrant C |
| Plot type | Count rate plots | Images |
|---|---|---|
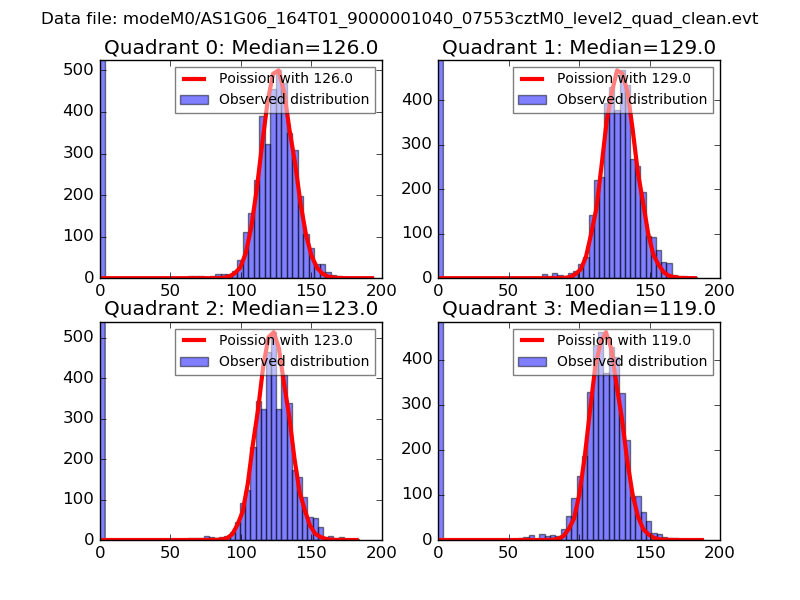
| Comparison with Poisson distribution Blue bars denote a histogram of data divided into 1 sec bins. Red curve is a Poisson curve with rate = median count rate of data. |
 |
 |
| Quadrant-wise count rates Data is divided into 100 sec bins |
 |
|
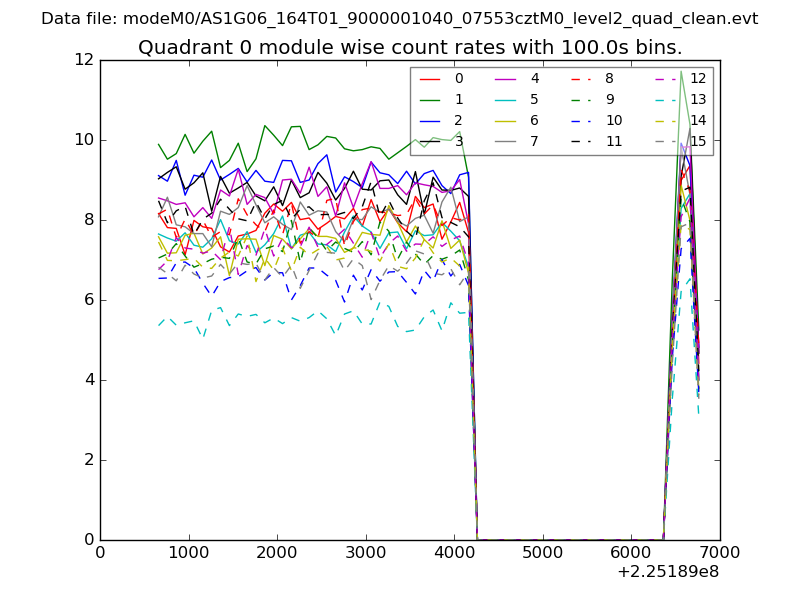
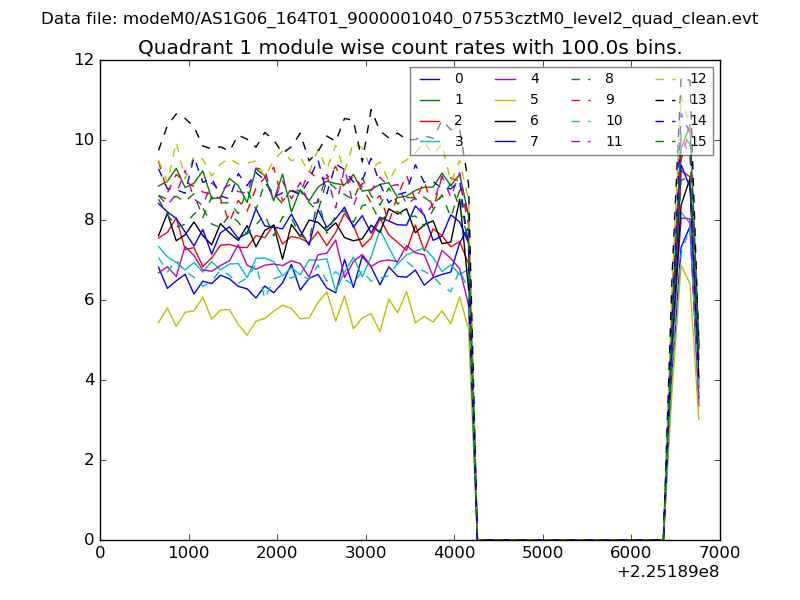
| Module-wise count rates for Quadrant A Data is divided into 100 sec bins |
 |
 |
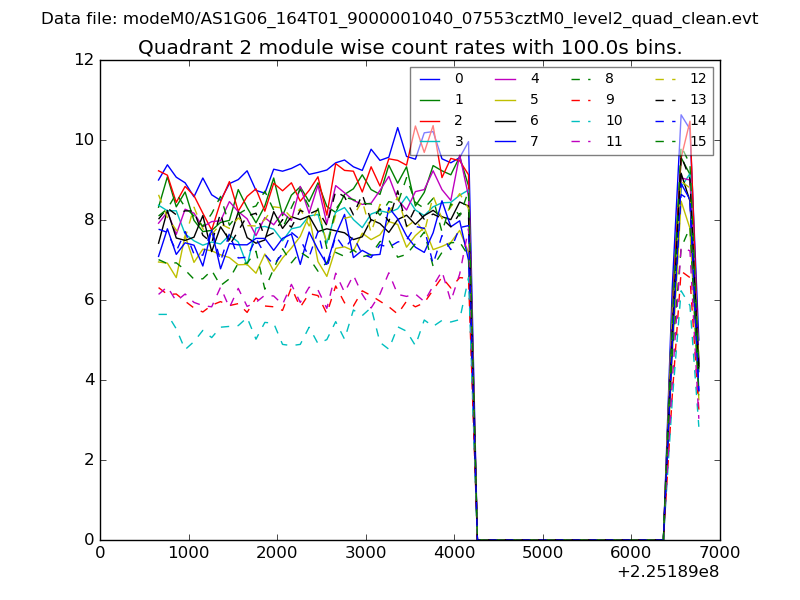
| Module-wise count rates for Quadrant B Data is divided into 100 sec bins |
 |
 |
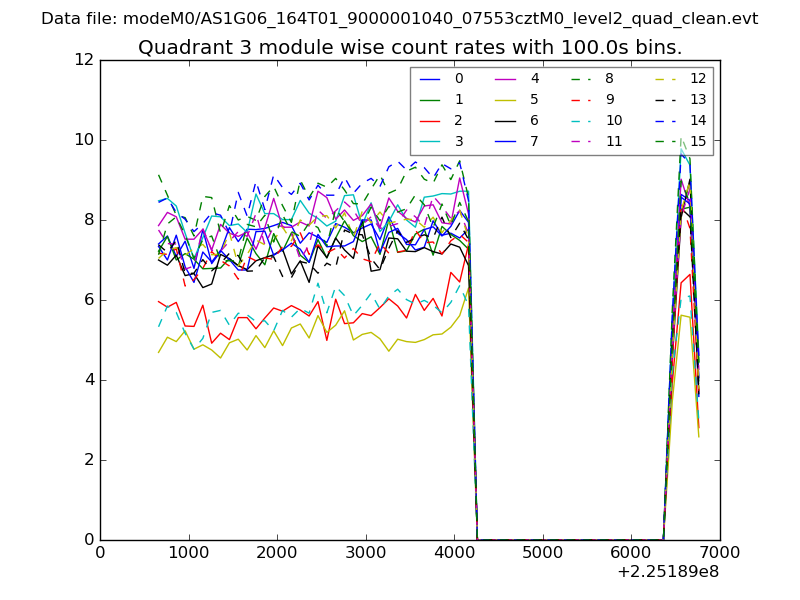
| Module-wise count rates for Quadrant C Data is divided into 100 sec bins |
 |
 |
| Module-wise count rates for Quadrant D Data is divided into 100 sec bins |
 |
 |
| Parameter | Plot |
|---|---|
| CZT HV Monitor | 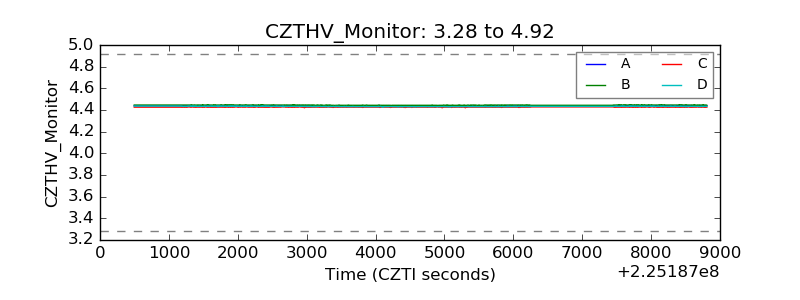 |
| D_VDD |  |
| Temperature 1 | 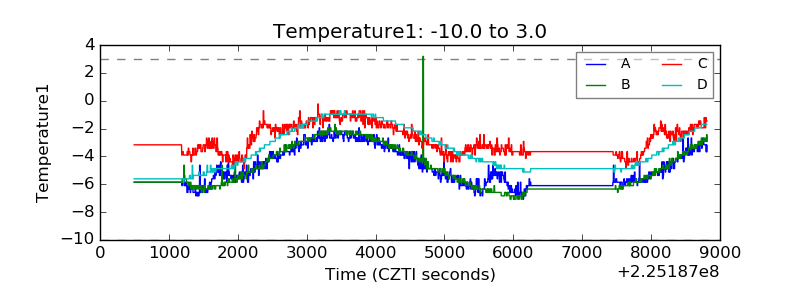 |
| Veto HV Monitor | 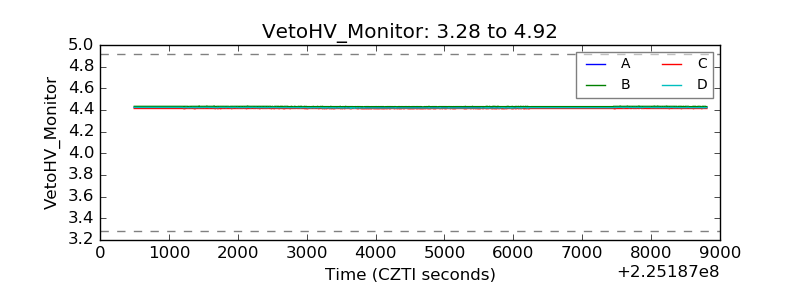 |
| Veto LLD | 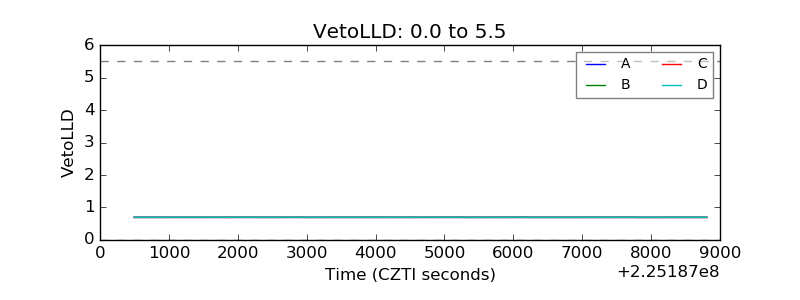 |
| Alpha Counter |  |
| _CPM_Rate | 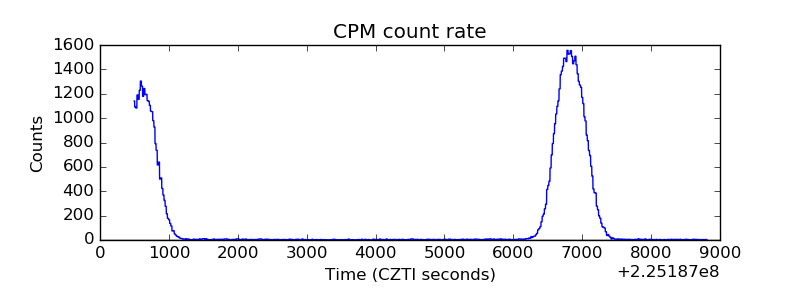 |
| CZT Counter | 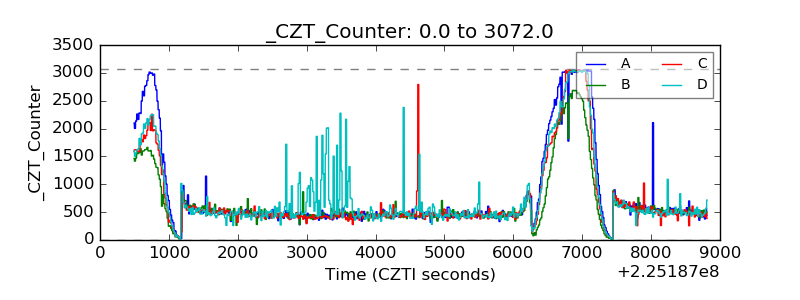 |
| +2.5 Volts monitor |  |
| +5 Volts monitor |  |
| _ROLL_ROT | 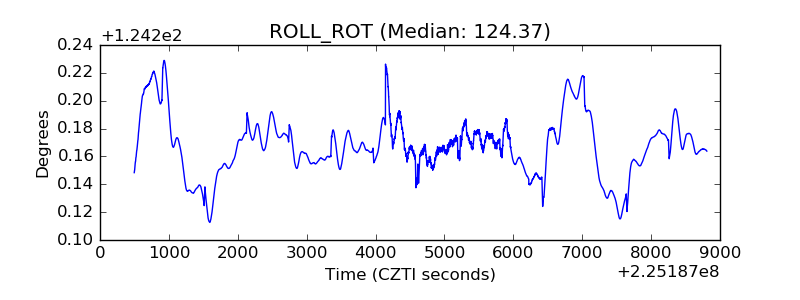 |
| _Roll_DEC | 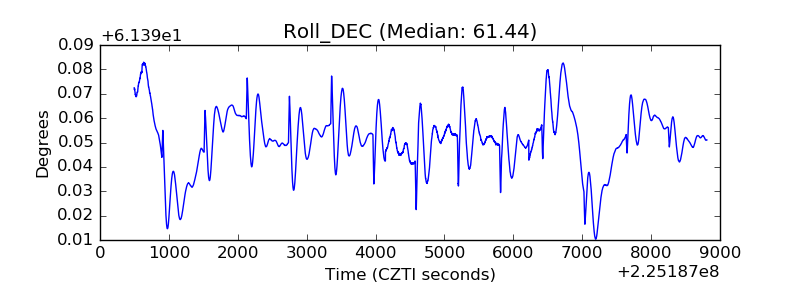 |
| _Roll_RA | 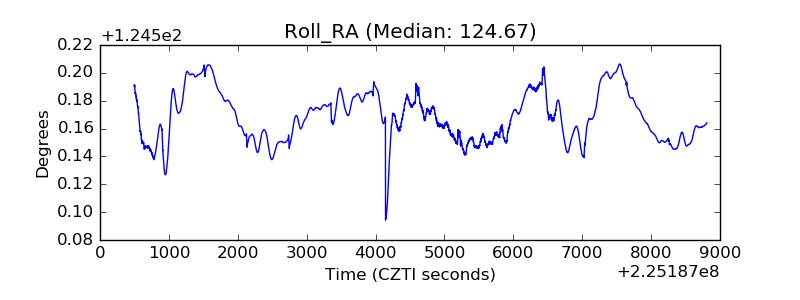 |
| Veto Counter | 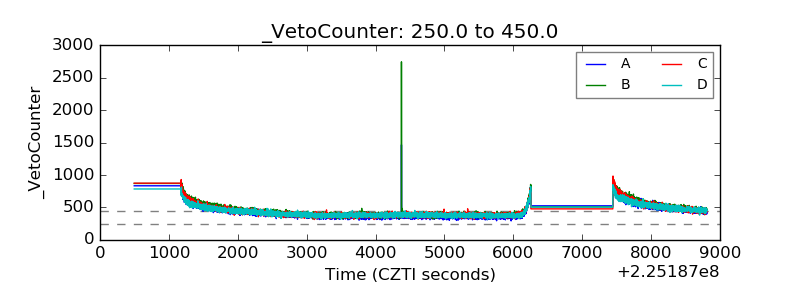 |