| Param | Original file | Final file |
|---|---|---|
| Filename | modeM0/AS1G06_164T01_9000001040_07554cztM0_level2.evt | modeM0/AS1G06_164T01_9000001040_07554cztM0_level2_quad_clean.evt |
| Size (bytes) | 470,842,560 | 99,506,880 |
| Size | 449.0 MB | 94.9 MB |
| Events in quadrant A | 3,305,037 | 649,867 |
| Events in quadrant B | 3,306,821 | 662,445 |
| Events in quadrant C | 3,654,337 | 630,122 |
| Events in quadrant D | 3,547,187 | 612,927 |
| Mode SS | |||
|---|---|---|---|
| Quadrant | BADHDUFLAG | Total packets | Discarded packets |
| A | 0 | 134 | 0 |
| B | 0 | 134 | 0 |
| C | 0 | 134 | 0 |
| D | 0 | 134 | 0 |
| Mode M0 | |||
|---|---|---|---|
| Quadrant | BADHDUFLAG | Total packets | Discarded packets |
| A | 0 | 14008 | 3 |
| B | 0 | 13900 | 2 |
| C | 0 | 15038 | 2 |
| D | 0 | 14784 | 2 |
| Mode M9 | |||
|---|---|---|---|
| Quadrant | BADHDUFLAG | Total packets | Discarded packets |
| A | 0 | 17 | 0 |
| B | 0 | 17 | 0 |
| C | 0 | 17 | 0 |
| D | 0 | 18 | 0 |
| Quadrant | Total seconds | Saturated seconds | Saturation percentage |
|---|---|---|---|
| A | 6566 | 80 | 1.218398% |
| B | 6566 | 70 | 1.066098% |
| C | 6566 | 193 | 2.939385% |
| D | 6566 | 77 | 1.172708% |
Noise dominated data is calculated using 1-second bins in cleaned event files. If a bin has >2000 counts, and if more than 50% of those come from <1% of pixels, then it is considered to be noise-dominated and hence unusable.
| Quadrant | # 1 sec bins | Bins with >0 counts | Bins with >2000 counts | High rate bins dominated by noise | Noise dominated (total time) | Noise dominated (detector-on time) | Marked lightcurve |
|---|---|---|---|---|---|---|---|
| A | 7851 | 6566 | 5 | 5 | 0.06% | 0.08% | 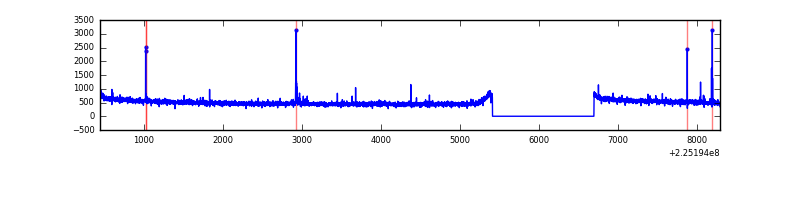 |
| B | 7851 | 6566 | 0 | 0 | 0.00% | 0.00% | 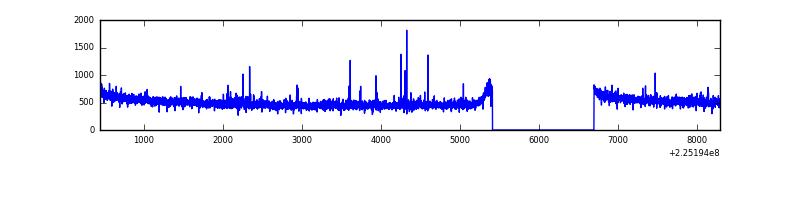 |
| C | 7851 | 6566 | 136 | 136 | 1.73% | 2.07% | 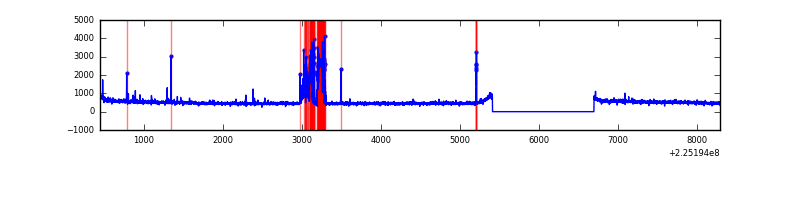 |
| D | 7851 | 6566 | 26 | 26 | 0.33% | 0.40% | 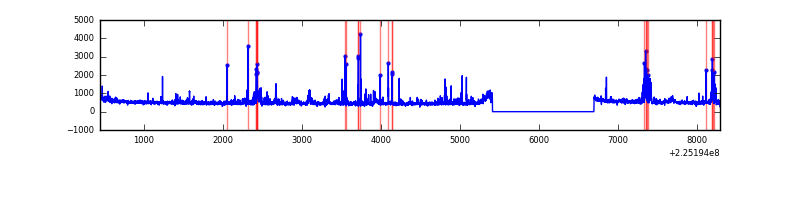 |
Top three noisy pixels from each quadrant. If the there are fewer than three noisy pixels in the level2.evt file, extra rows are filled as -1
| Pixel properties | Quadrant properties | ||||||
|---|---|---|---|---|---|---|---|
| Quadrant | DetID | PixID | Counts | Sigma | Mean | Median | Sigma |
| A | 15 | 239 | 45782 | 267.59 | 845 | 829 | 168.0 |
| A | 0 | 226 | 8111 | 43.35 | 845 | 829 | 168.0 |
| A | 12 | 194 | 7386 | 39.03 | 845 | 829 | 168.0 |
| B | 0 | 214 | 24936 | 154.46 | 842 | 824 | 156.1 |
| B | 12 | 111 | 15779 | 95.8 | 842 | 824 | 156.1 |
| B | 11 | 111 | 12661 | 75.83 | 842 | 824 | 156.1 |
| C | 1 | 16 | 458501 | 2485.09 | 802 | 804 | 184.2 |
| C | 9 | 68 | 66798 | 358.32 | 802 | 804 | 184.2 |
| C | 13 | 61 | 6225 | 29.43 | 802 | 804 | 184.2 |
| D | 2 | 152 | 345597 | 1758.68 | 814 | 790 | 196.1 |
| D | 2 | 14 | 57653 | 290.03 | 814 | 790 | 196.1 |
| D | 5 | 97 | 33831 | 168.52 | 814 | 790 | 196.1 |
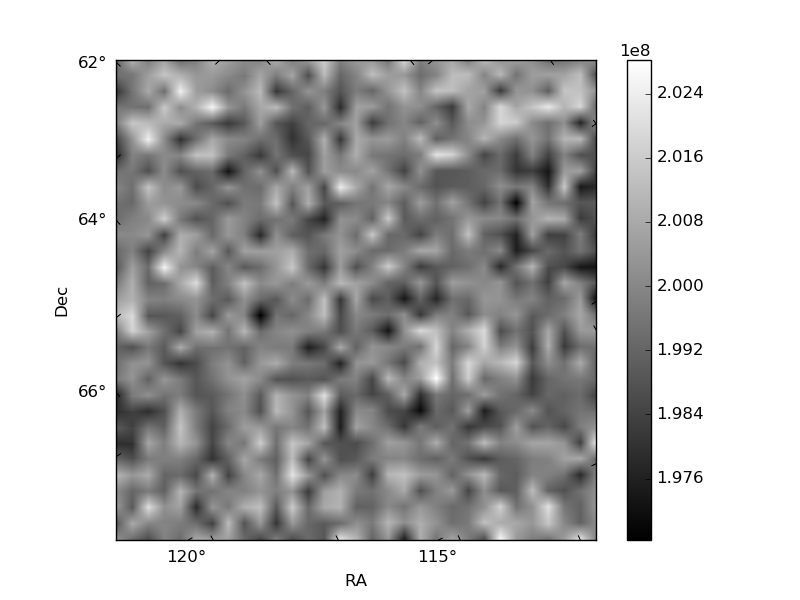
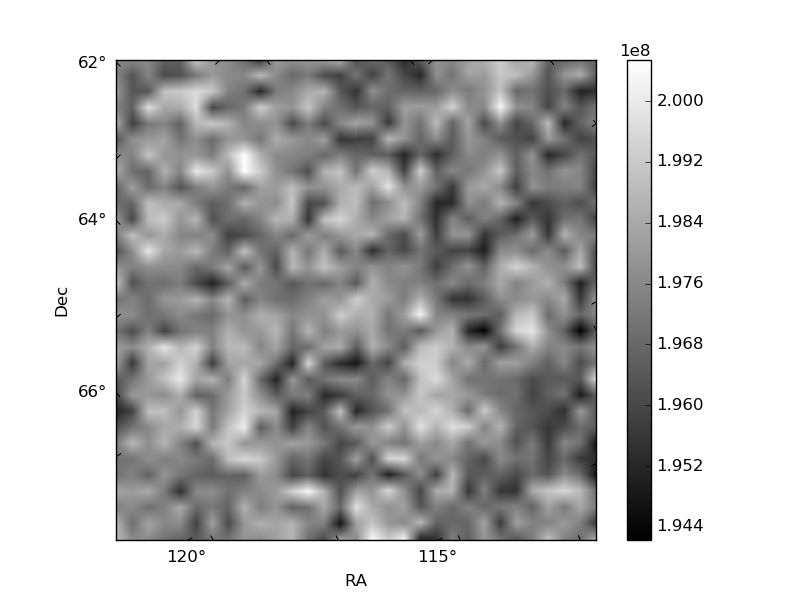
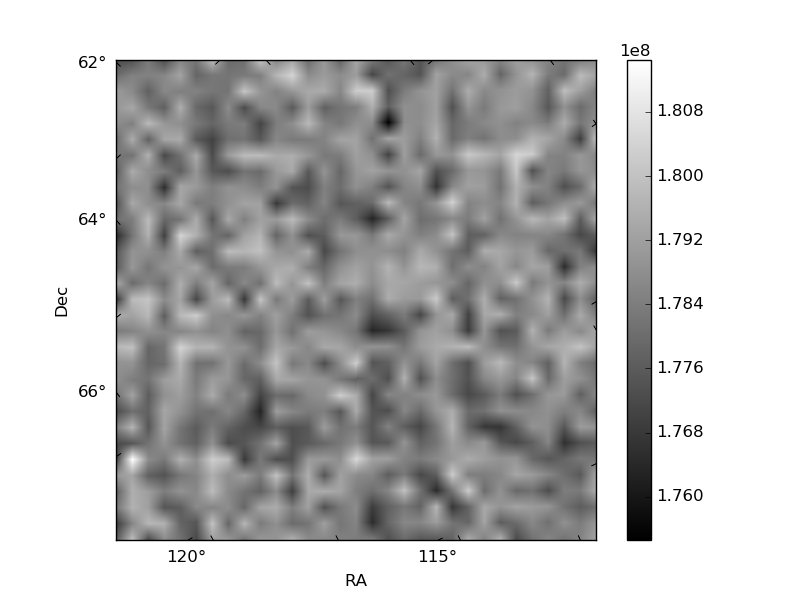
Histogram calculated using DETX and DETY for each event in the final _common_clean file
| Quadrant A | 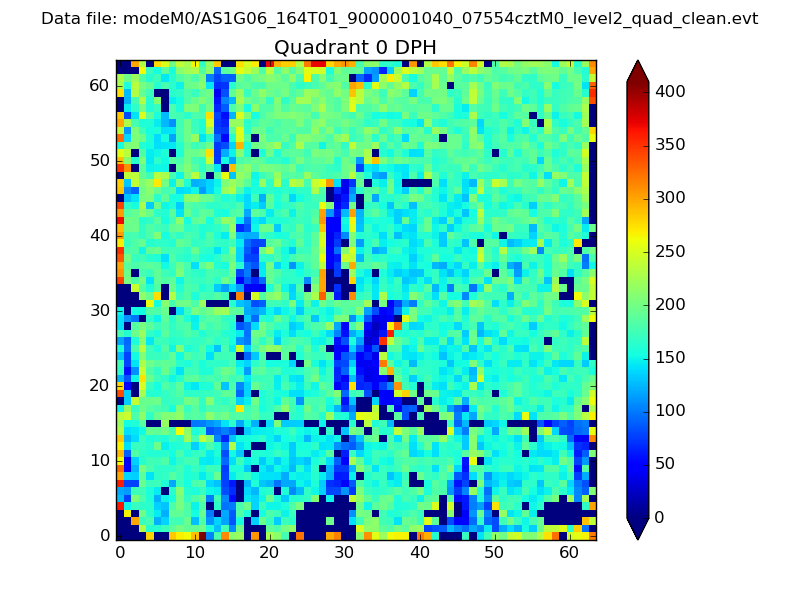 |
 |
Quadrant B |
|---|---|---|---|
| Quadrant D | 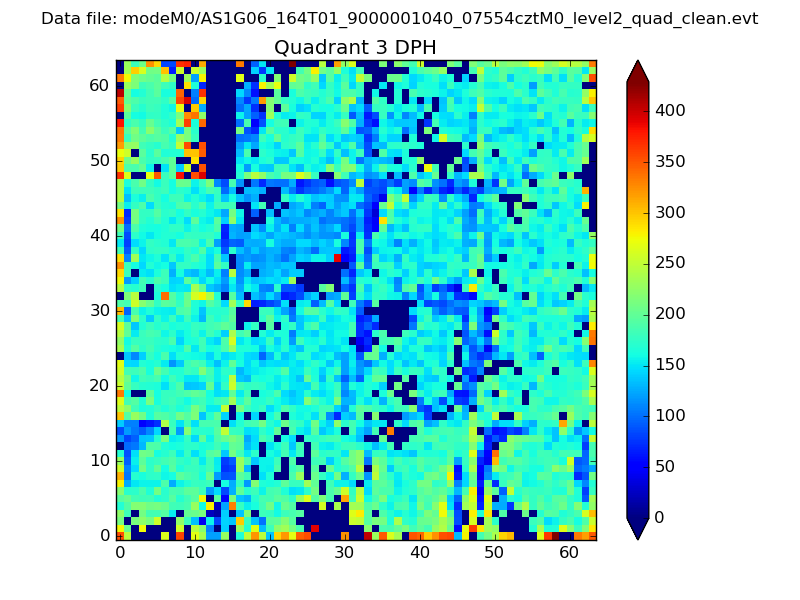 |
 |
Quadrant C |
| Plot type | Count rate plots | Images |
|---|---|---|
| Comparison with Poisson distribution Blue bars denote a histogram of data divided into 1 sec bins. Red curve is a Poisson curve with rate = median count rate of data. |
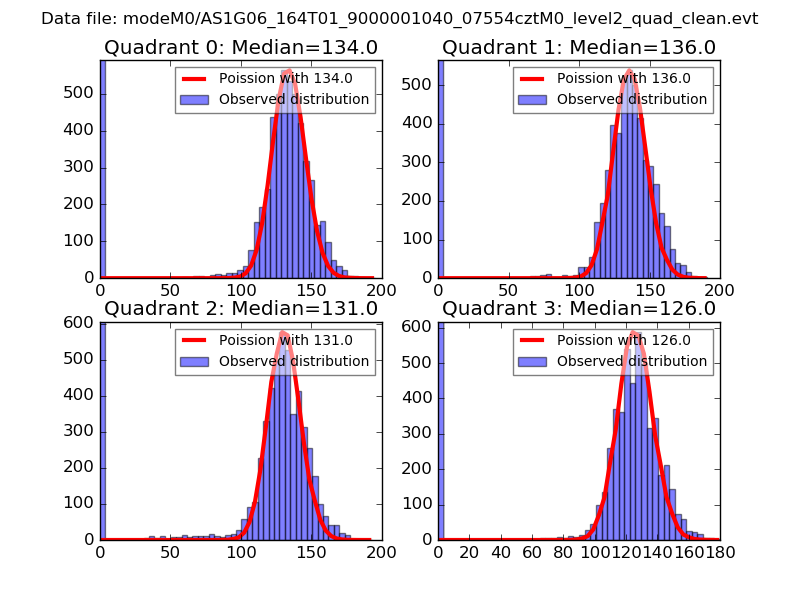 |
 |
| Quadrant-wise count rates Data is divided into 100 sec bins |
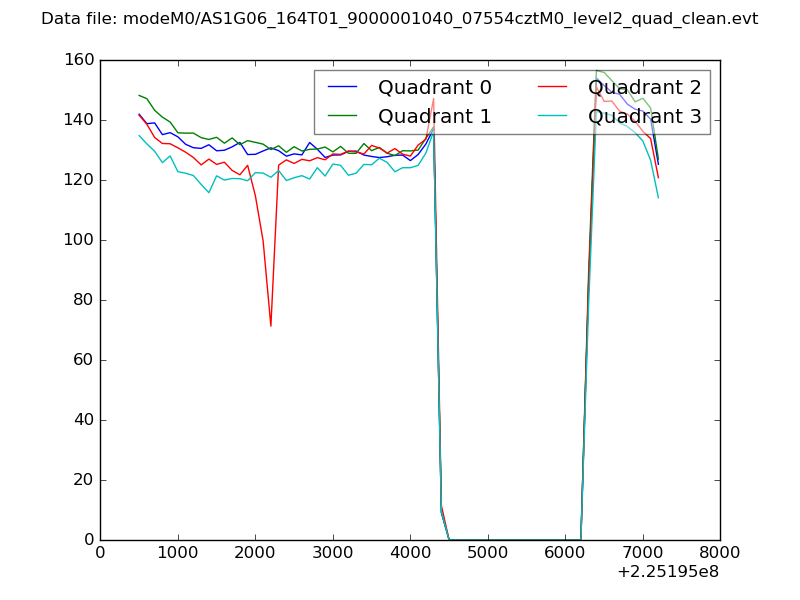 |
|
| Module-wise count rates for Quadrant A Data is divided into 100 sec bins |
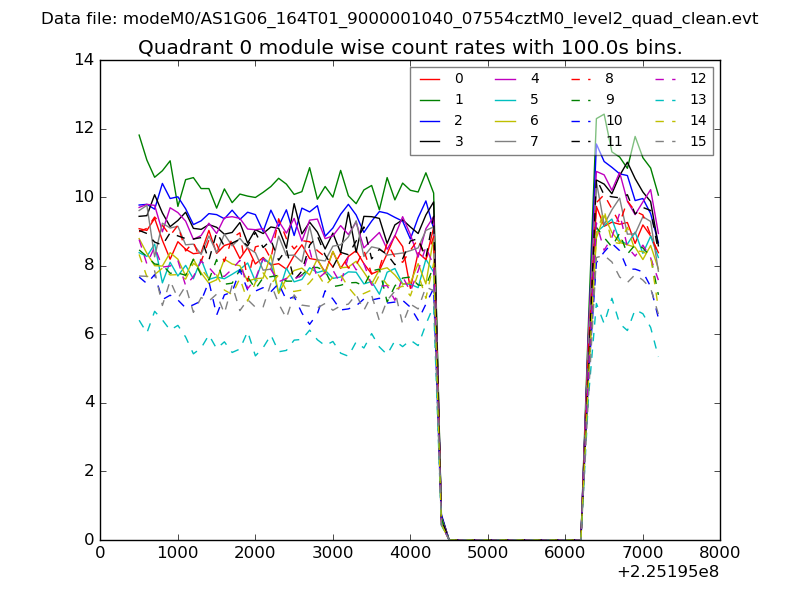 |
 |
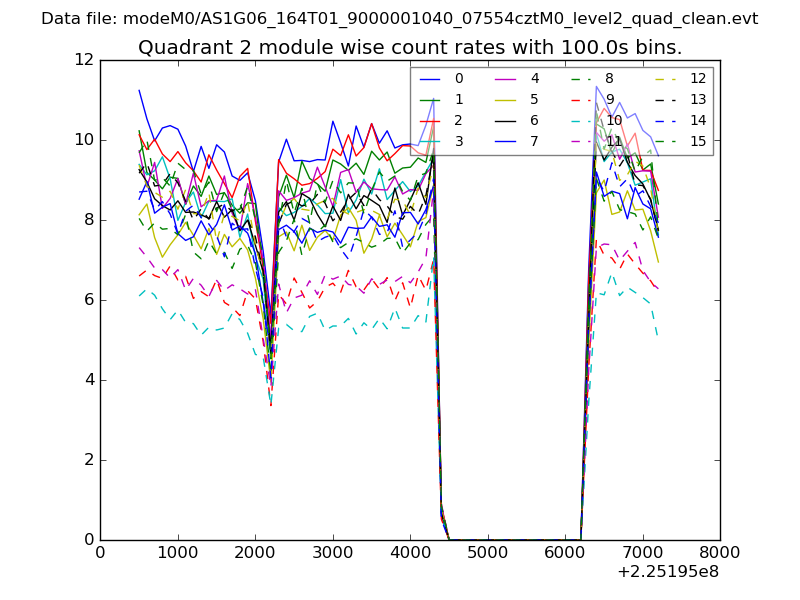
| Module-wise count rates for Quadrant B Data is divided into 100 sec bins |
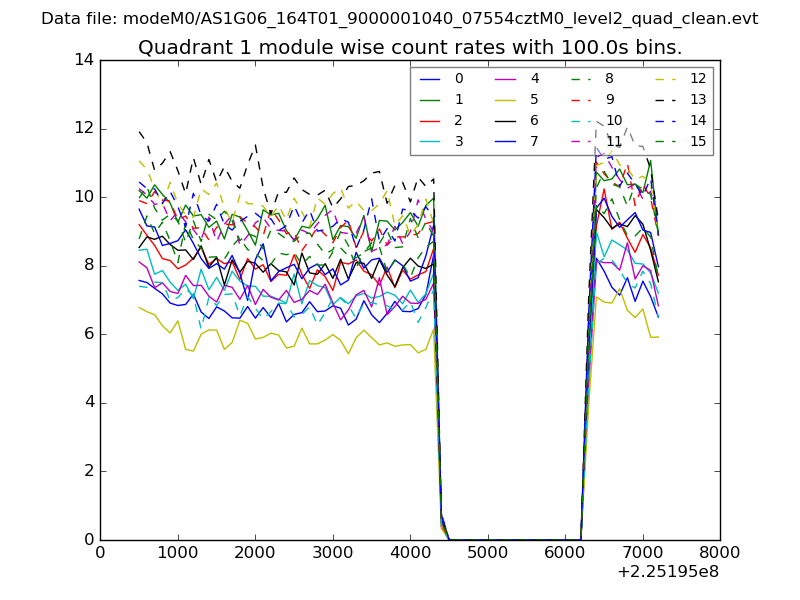 |
 |
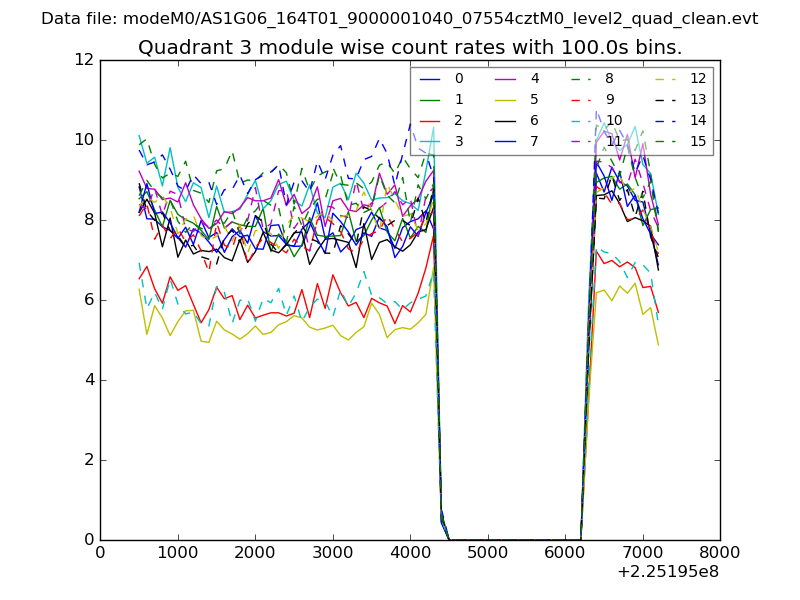
| Module-wise count rates for Quadrant C Data is divided into 100 sec bins |
 |
 |
| Module-wise count rates for Quadrant D Data is divided into 100 sec bins |
 |
 |
| Parameter | Plot |
|---|---|
| CZT HV Monitor | 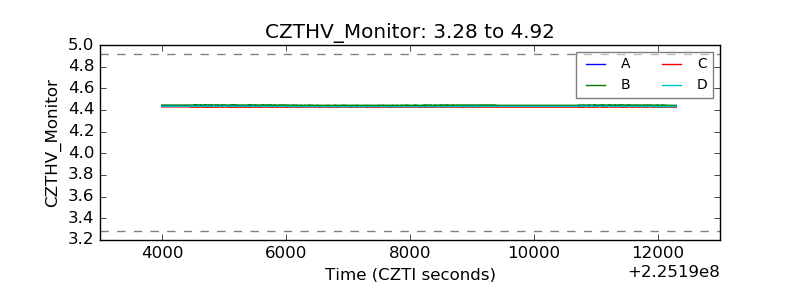 |
| D_VDD | 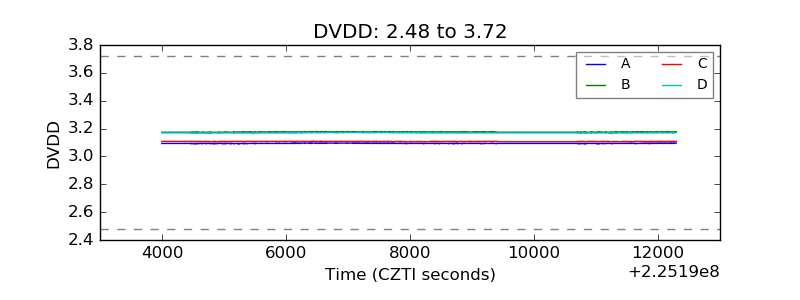 |
| Temperature 1 |  |
| Veto HV Monitor | 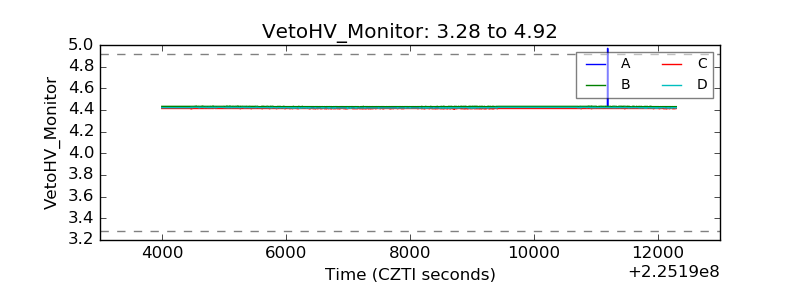 |
| Veto LLD | 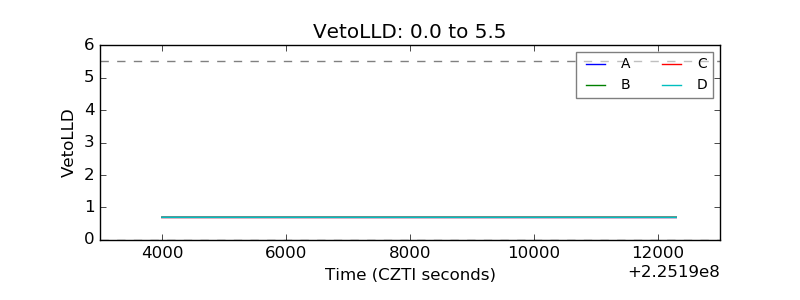 |
| Alpha Counter | 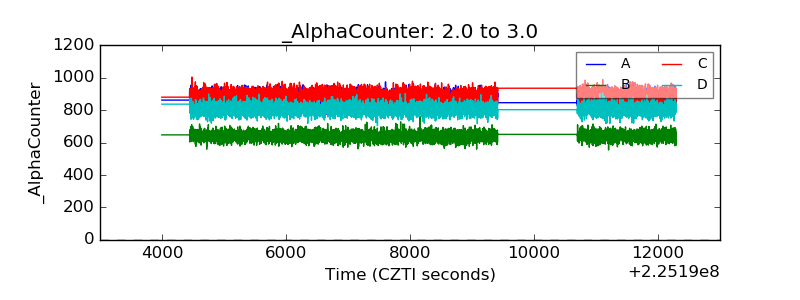 |
| _CPM_Rate | 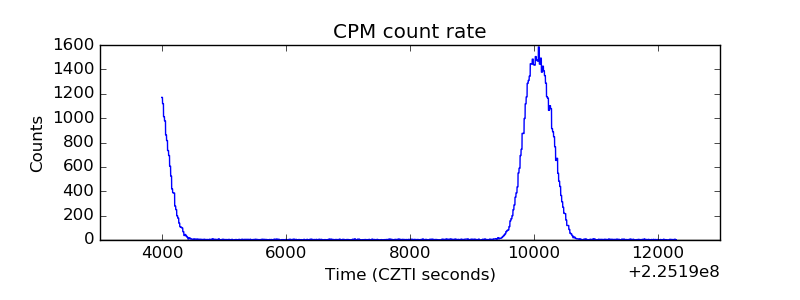 |
| CZT Counter | 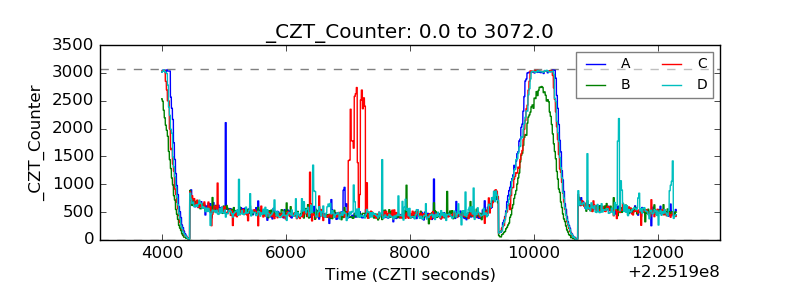 |
| +2.5 Volts monitor |  |
| +5 Volts monitor | 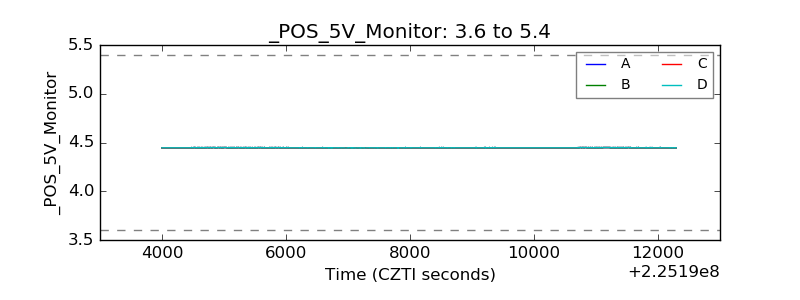 |
| _ROLL_ROT | 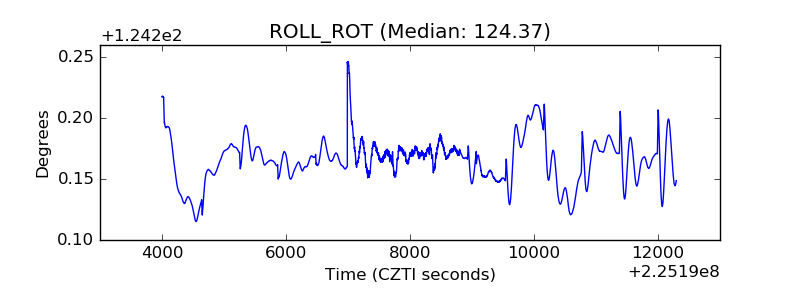 |
| _Roll_DEC | 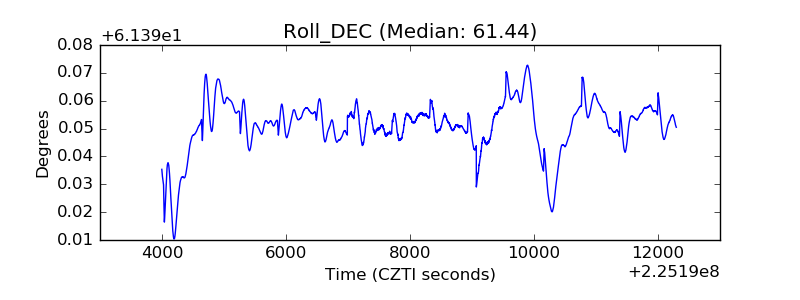 |
| _Roll_RA | 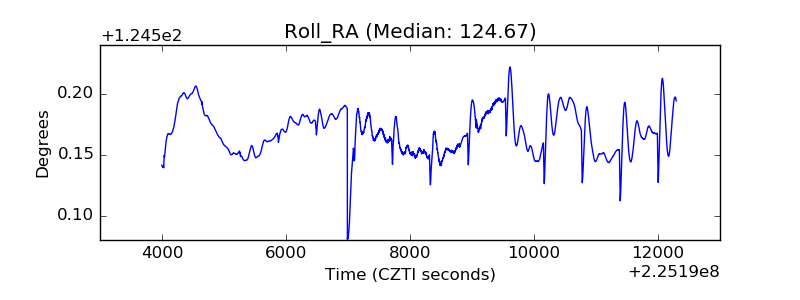 |
| Veto Counter | 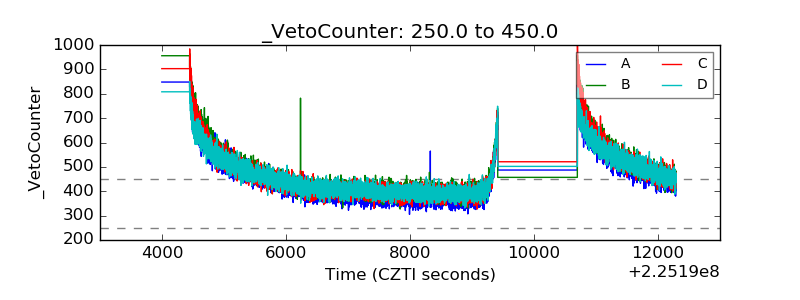 |