| Param | Original file | Final file |
|---|---|---|
| Filename | modeM0/AS1G06_164T01_9000001040_07555cztM0_level2.evt | modeM0/AS1G06_164T01_9000001040_07555cztM0_level2_quad_clean.evt |
| Size (bytes) | 242,596,800 | 72,072,000 |
| Size | 231.4 MB | 68.7 MB |
| Events in quadrant A | 1,697,189 | 488,787 |
| Events in quadrant B | 1,751,729 | 495,574 |
| Events in quadrant C | 1,716,953 | 479,040 |
| Events in quadrant D | 1,932,239 | 461,878 |
| Mode SS | |||
|---|---|---|---|
| Quadrant | BADHDUFLAG | Total packets | Discarded packets |
| A | 0 | 72 | 0 |
| B | 0 | 72 | 0 |
| C | 0 | 72 | 0 |
| D | 0 | 72 | 0 |
| Mode M0 | |||
|---|---|---|---|
| Quadrant | BADHDUFLAG | Total packets | Discarded packets |
| A | 0 | 7407 | 0 |
| B | 0 | 7453 | 0 |
| C | 0 | 7462 | 0 |
| D | 0 | 8158 | 0 |
| Quadrant | Total seconds | Saturated seconds | Saturation percentage |
|---|---|---|---|
| A | 3639 | 8 | 0.219841% |
| B | 3639 | 0 | 0.000000% |
| C | 3639 | 8 | 0.219841% |
| D | 3639 | 38 | 1.044243% |
Noise dominated data is calculated using 1-second bins in cleaned event files. If a bin has >2000 counts, and if more than 50% of those come from <1% of pixels, then it is considered to be noise-dominated and hence unusable.
| Quadrant | # 1 sec bins | Bins with >0 counts | Bins with >2000 counts | High rate bins dominated by noise | Noise dominated (total time) | Noise dominated (detector-on time) | Marked lightcurve |
|---|---|---|---|---|---|---|---|
| A | 3639 | 3639 | 5 | 5 | 0.14% | 0.14% | 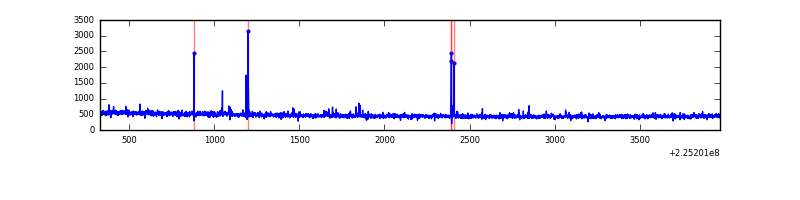 |
| B | 3639 | 3639 | 0 | 0 | 0.00% | 0.00% | 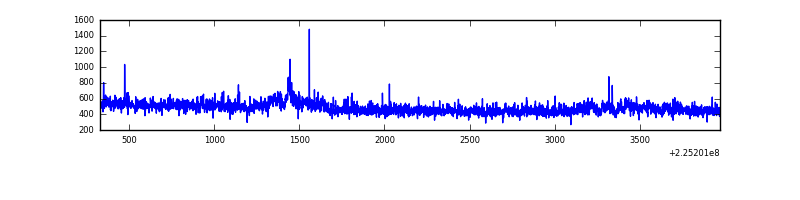 |
| C | 3639 | 3639 | 4 | 4 | 0.11% | 0.11% | 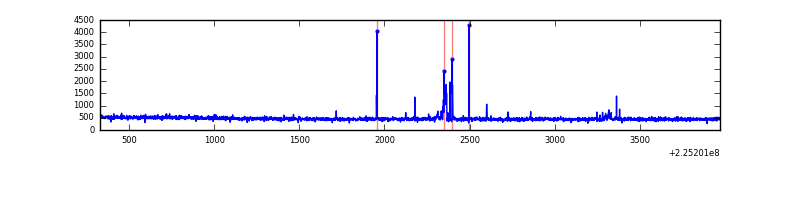 |
| D | 3639 | 3639 | 33 | 33 | 0.91% | 0.91% | 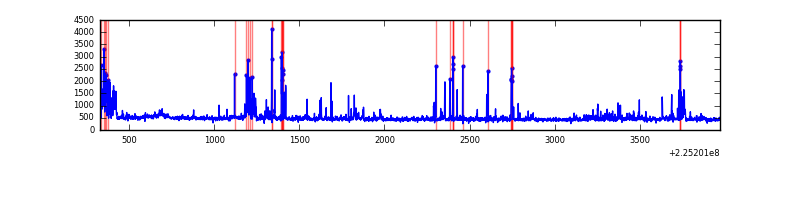 |
Top three noisy pixels from each quadrant. If the there are fewer than three noisy pixels in the level2.evt file, extra rows are filled as -1
| Pixel properties | Quadrant properties | ||||||
|---|---|---|---|---|---|---|---|
| Quadrant | DetID | PixID | Counts | Sigma | Mean | Median | Sigma |
| A | 15 | 239 | 29334 | 326.89 | 431 | 422 | 88.4 |
| A | 3 | 1 | 8002 | 85.7 | 431 | 422 | 88.4 |
| A | 0 | 226 | 4111 | 41.71 | 431 | 422 | 88.4 |
| B | 0 | 219 | 57098 | 706.63 | 431 | 421 | 80.2 |
| B | 0 | 214 | 13679 | 165.3 | 431 | 421 | 80.2 |
| B | 10 | 245 | 10714 | 128.33 | 431 | 421 | 80.2 |
| C | 1 | 16 | 52803 | 537.87 | 418 | 419 | 97.4 |
| C | 9 | 68 | 32862 | 333.12 | 418 | 419 | 97.4 |
| C | 13 | 61 | 3154 | 28.08 | 418 | 419 | 97.4 |
| D | 2 | 152 | 155387 | 1517.4 | 419 | 405 | 102.1 |
| D | 5 | 97 | 74317 | 723.66 | 419 | 405 | 102.1 |
| D | 2 | 14 | 43938 | 426.22 | 419 | 405 | 102.1 |
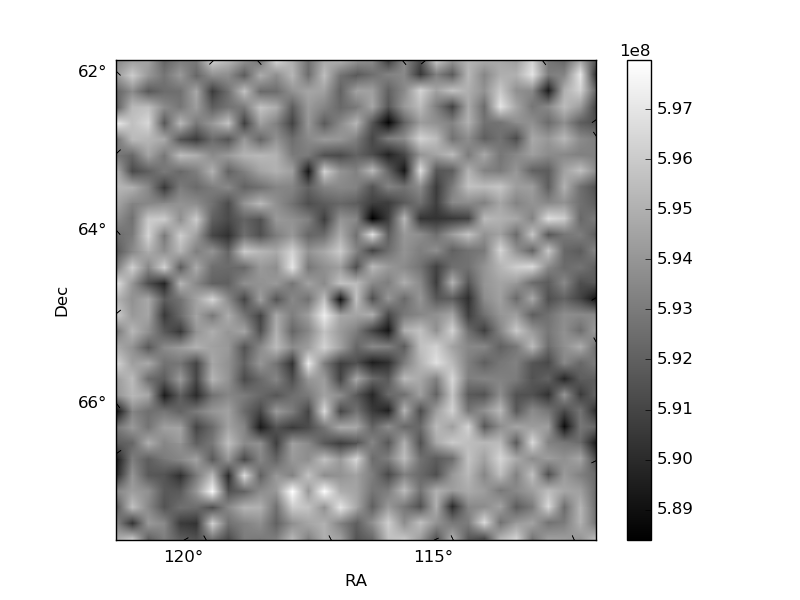
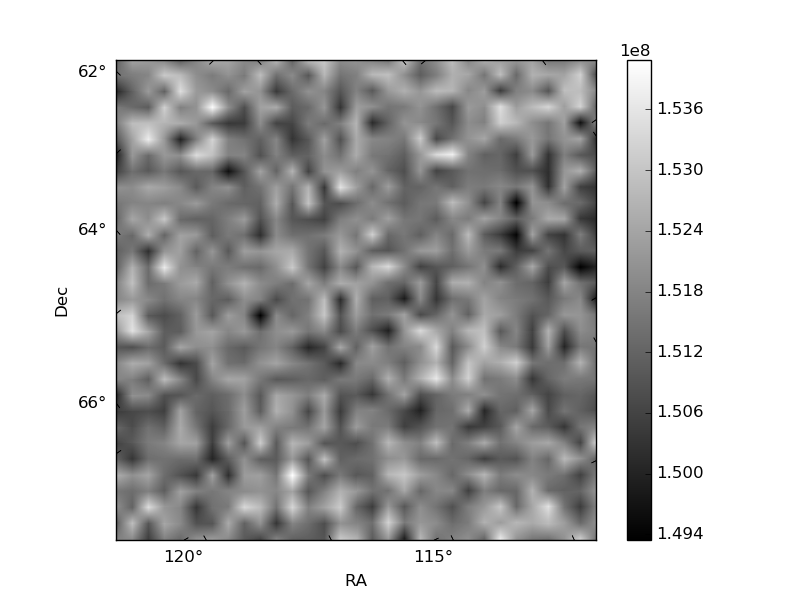
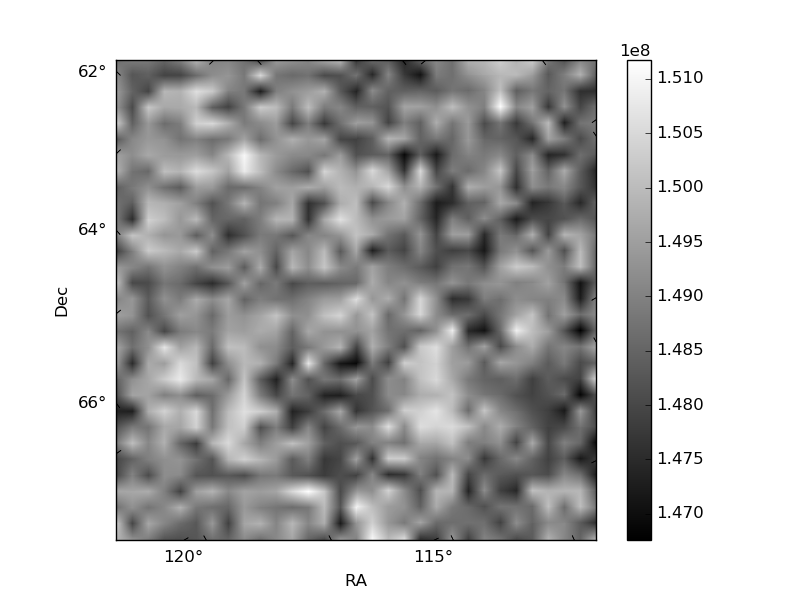
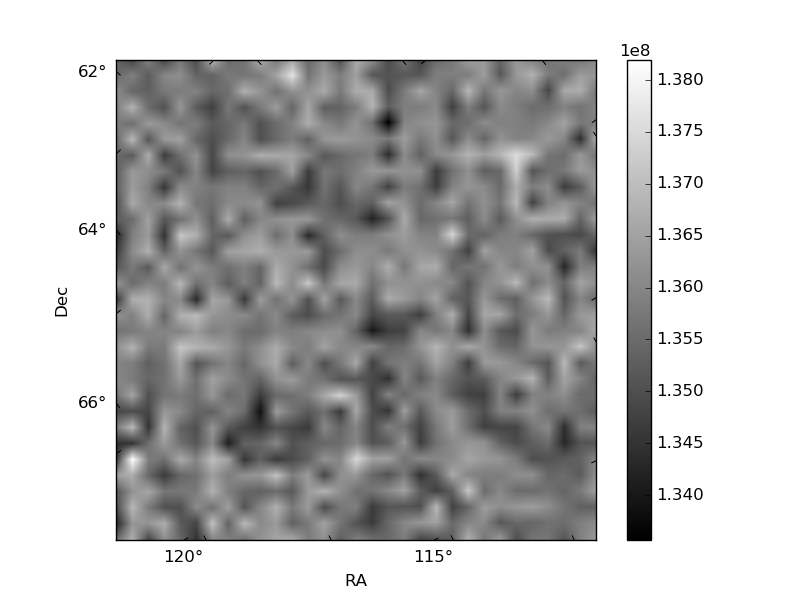
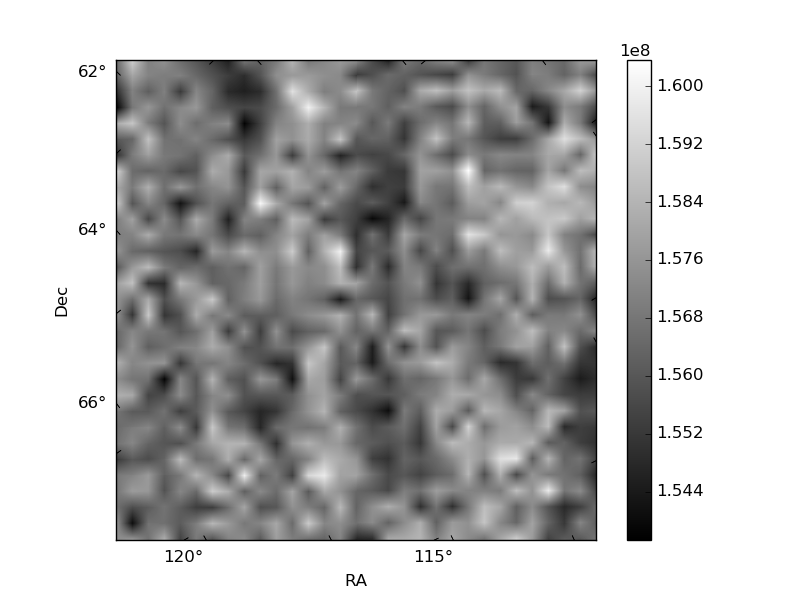
Histogram calculated using DETX and DETY for each event in the final _common_clean file
| Quadrant A | 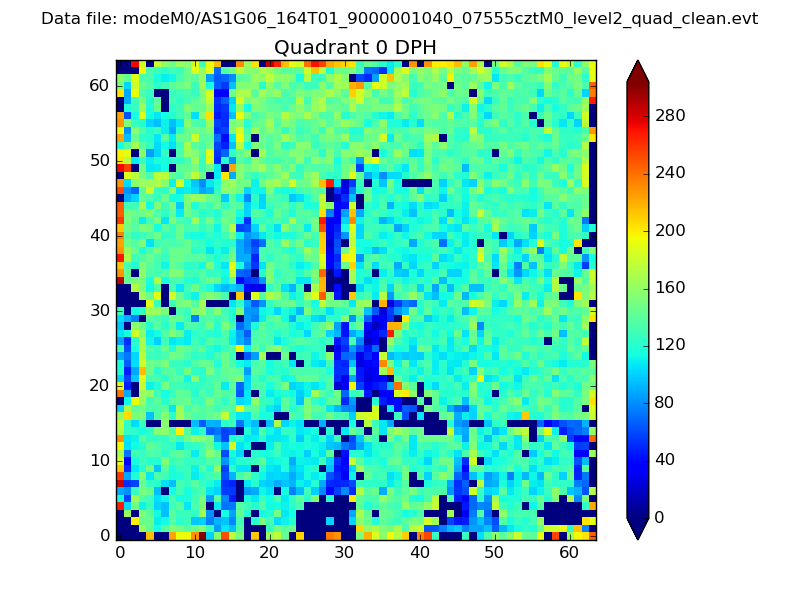 |
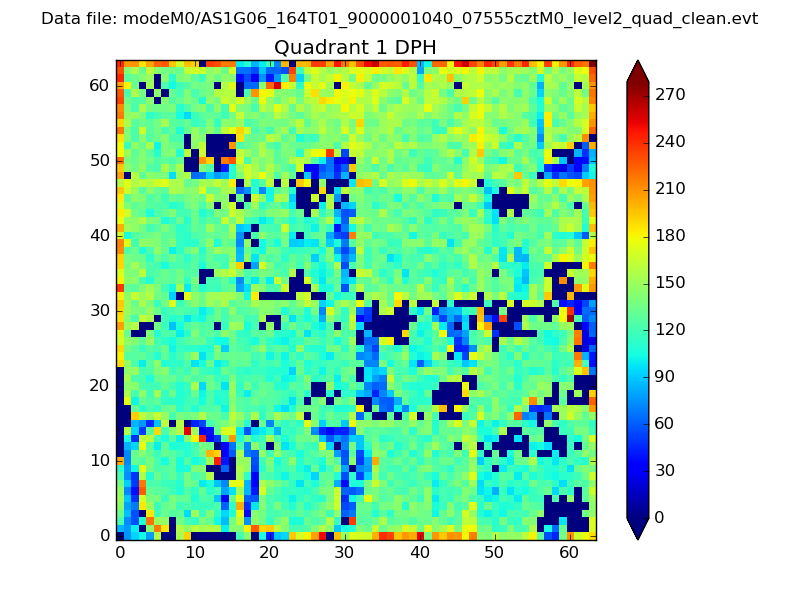 |
Quadrant B |
|---|---|---|---|
| Quadrant D | 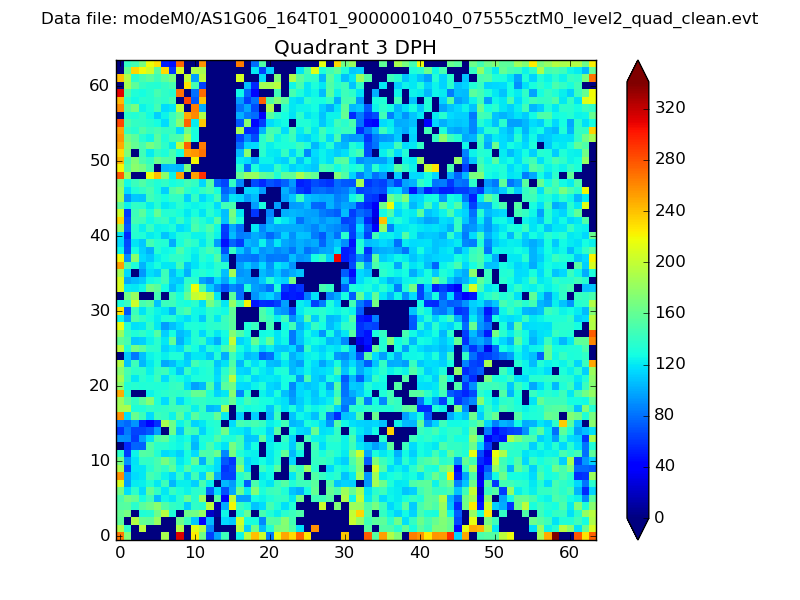 |
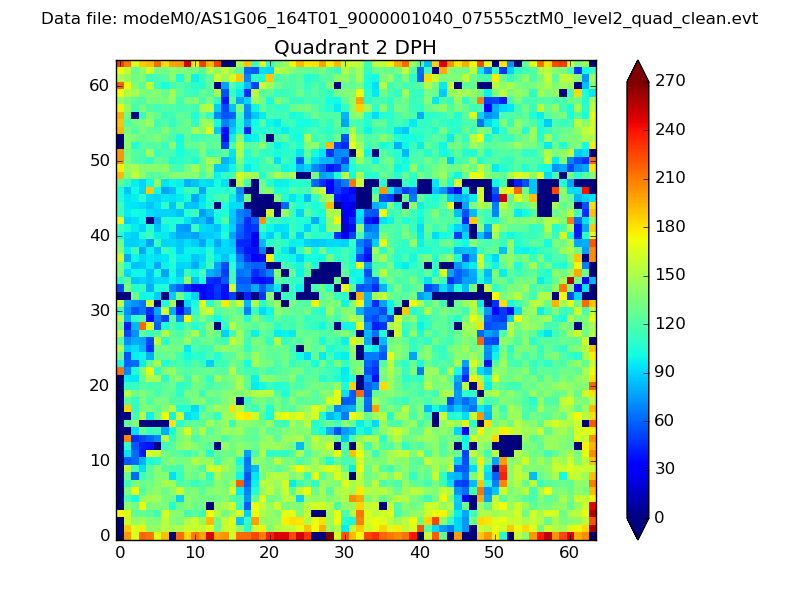 |
Quadrant C |
| Plot type | Count rate plots | Images |
|---|---|---|
| Comparison with Poisson distribution Blue bars denote a histogram of data divided into 1 sec bins. Red curve is a Poisson curve with rate = median count rate of data. |
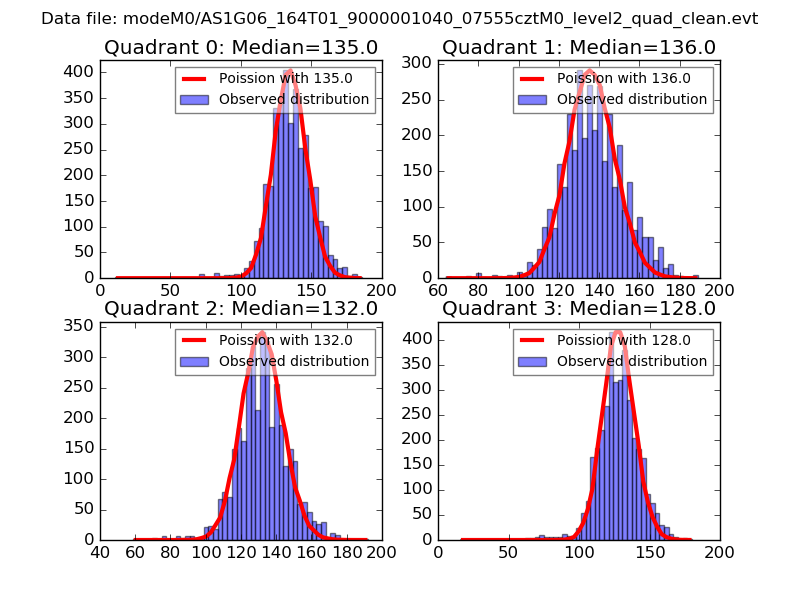 |
 |
| Quadrant-wise count rates Data is divided into 100 sec bins |
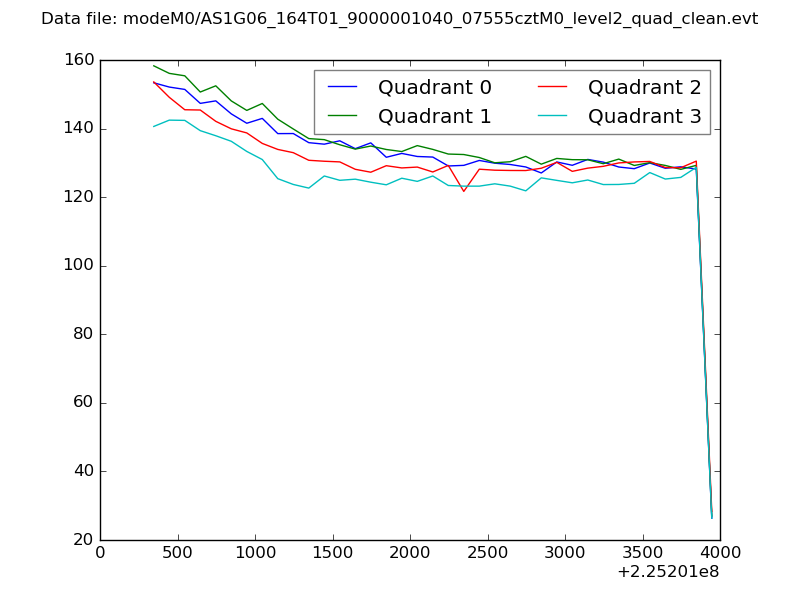 |
|
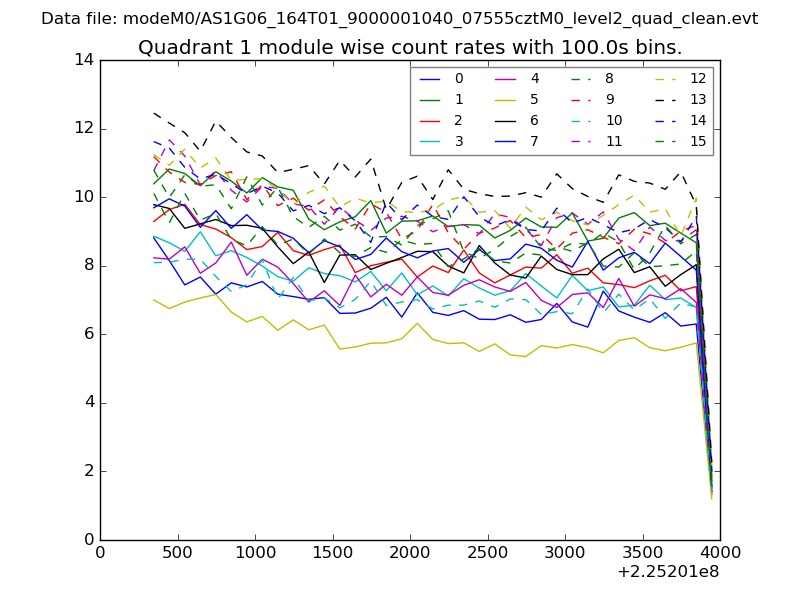
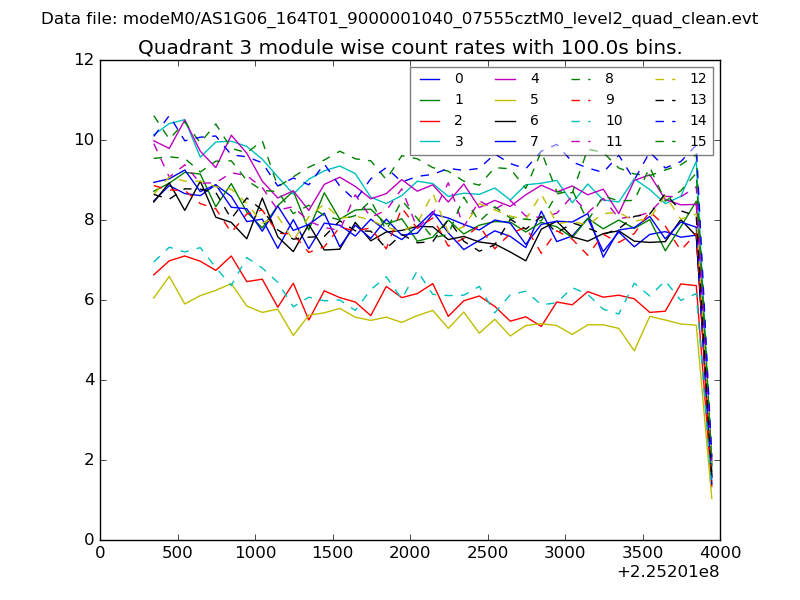
| Module-wise count rates for Quadrant A Data is divided into 100 sec bins |
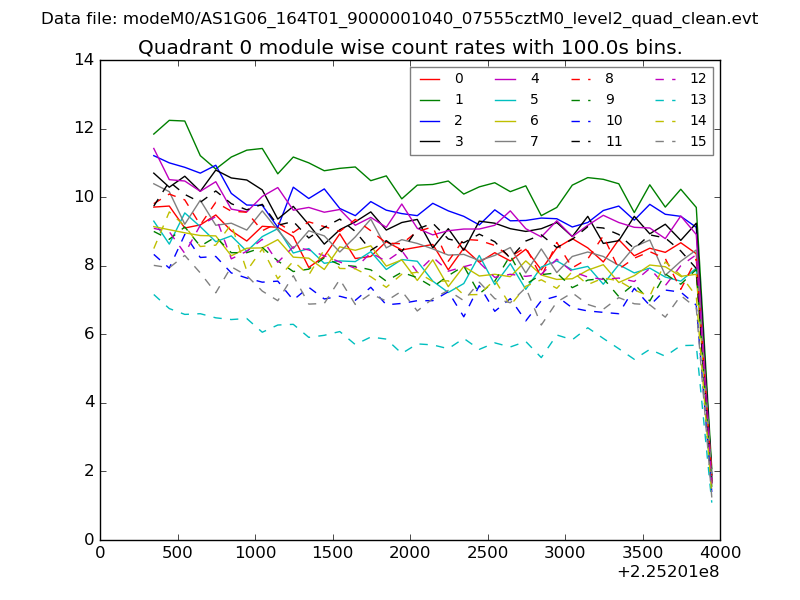 |
 |
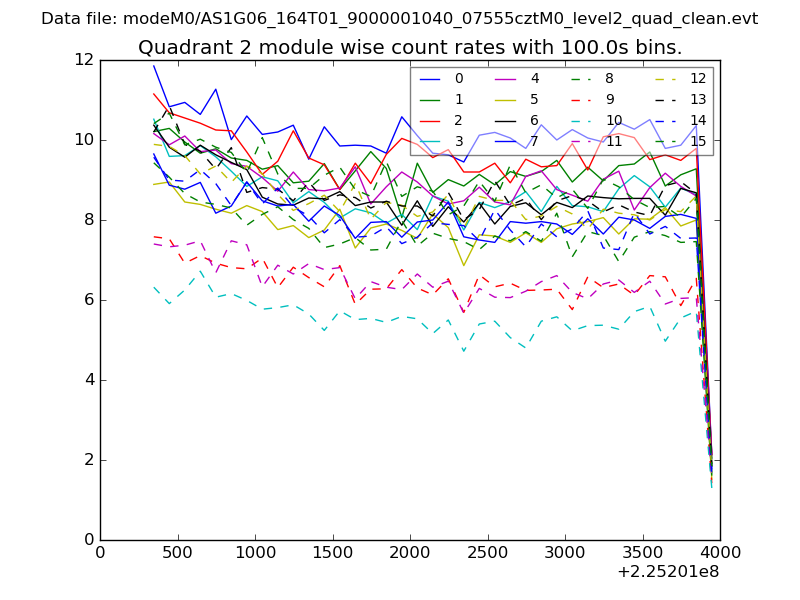
| Module-wise count rates for Quadrant B Data is divided into 100 sec bins |
 |
 |
| Module-wise count rates for Quadrant C Data is divided into 100 sec bins |
 |
 |
| Module-wise count rates for Quadrant D Data is divided into 100 sec bins |
 |
 |
| Parameter | Plot |
|---|---|
| CZT HV Monitor | 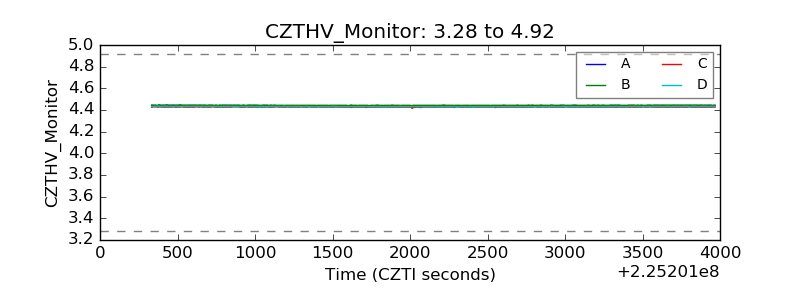 |
| D_VDD | 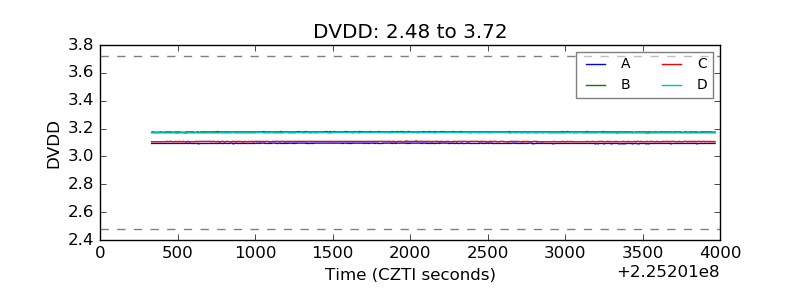 |
| Temperature 1 |  |
| Veto HV Monitor | 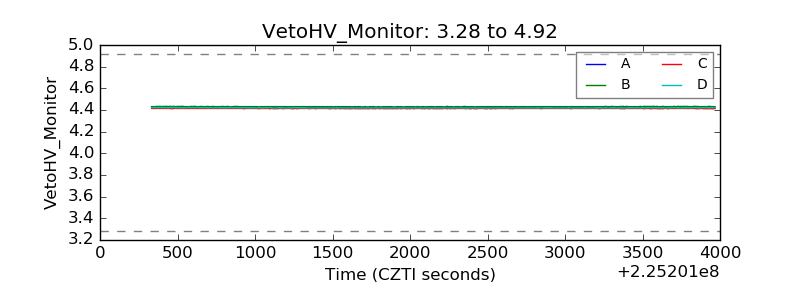 |
| Veto LLD | 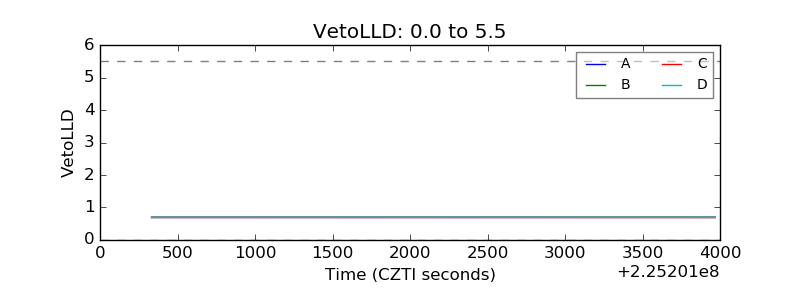 |
| Alpha Counter |  |
| _CPM_Rate | 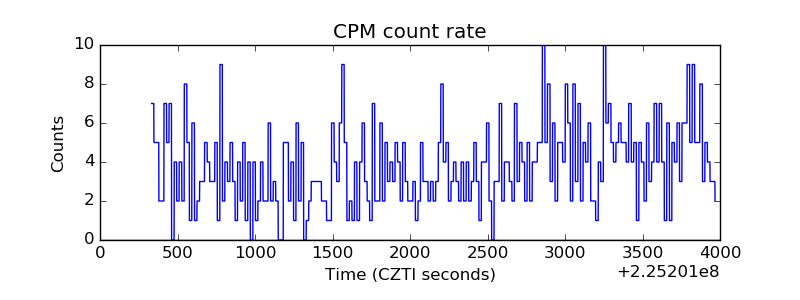 |
| CZT Counter |  |
| +2.5 Volts monitor |  |
| +5 Volts monitor | 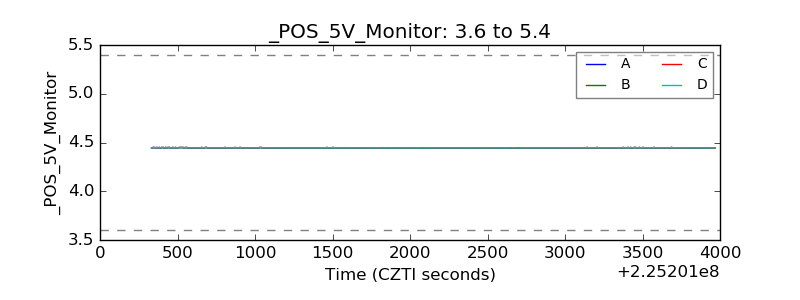 |
| _ROLL_ROT | 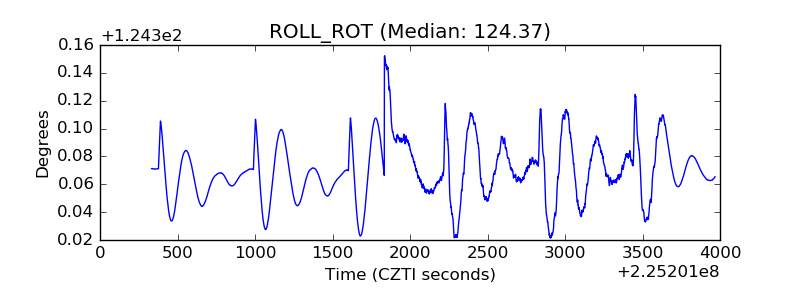 |
| _Roll_DEC | 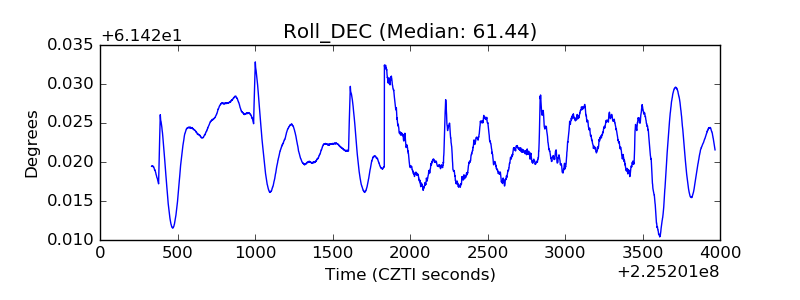 |
| _Roll_RA |  |
| Veto Counter | 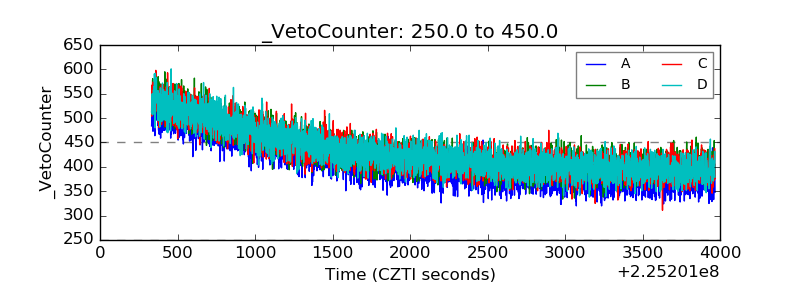 |