| Param | Original file | Final file |
|---|---|---|
| Filename | modeM0/AS1T01_155T01_9000001042_07555cztM0_level2.evt | modeM0/AS1T01_155T01_9000001042_07555cztM0_level2_quad_clean.evt |
| Size (bytes) | 111,850,560 | 33,624,000 |
| Size | 106.7 MB | 32.1 MB |
| Events in quadrant A | 806,639 | 233,158 |
| Events in quadrant B | 817,620 | 235,439 |
| Events in quadrant C | 822,749 | 226,824 |
| Events in quadrant D | 842,548 | 218,265 |
| Mode M0 | |||
|---|---|---|---|
| Quadrant | BADHDUFLAG | Total packets | Discarded packets |
| A | 0 | 3236 | 2 |
| B | 0 | 3294 | 1 |
| C | 0 | 3287 | 1 |
| D | 0 | 3337 | 1 |
| Mode M9 | |||
|---|---|---|---|
| Quadrant | BADHDUFLAG | Total packets | Discarded packets |
| A | 0 | 13 | 0 |
| B | 0 | 13 | 0 |
| C | 0 | 13 | 0 |
| D | 0 | 13 | 0 |
| Mode SS | |||
|---|---|---|---|
| Quadrant | BADHDUFLAG | Total packets | Discarded packets |
| A | 0 | 30 | 0 |
| B | 0 | 30 | 0 |
| C | 0 | 30 | 0 |
| D | 0 | 30 | 0 |
| Quadrant | Total seconds | Saturated seconds | Saturation percentage |
|---|---|---|---|
| A | 1398 | 10 | 0.715308% |
| B | 1398 | 13 | 0.929900% |
| C | 1398 | 7 | 0.500715% |
| D | 1398 | 12 | 0.858369% |
Noise dominated data is calculated using 1-second bins in cleaned event files. If a bin has >2000 counts, and if more than 50% of those come from <1% of pixels, then it is considered to be noise-dominated and hence unusable.
| Quadrant | # 1 sec bins | Bins with >0 counts | Bins with >2000 counts | High rate bins dominated by noise | Noise dominated (total time) | Noise dominated (detector-on time) | Marked lightcurve |
|---|---|---|---|---|---|---|---|
| A | 2648 | 1398 | 0 | 0 | 0.00% | 0.00% |  |
| B | 2648 | 1398 | 0 | 0 | 0.00% | 0.00% | 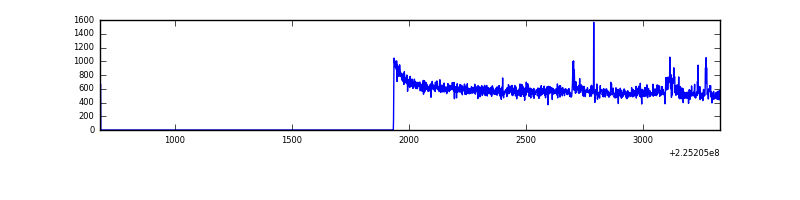 |
| C | 2648 | 1398 | 0 | 0 | 0.00% | 0.00% | 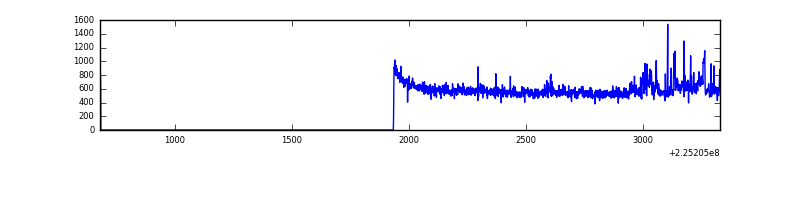 |
| D | 2648 | 1398 | 1 | 1 | 0.04% | 0.07% | 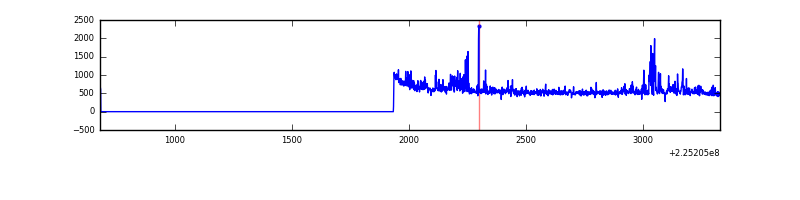 |
Top three noisy pixels from each quadrant. If the there are fewer than three noisy pixels in the level2.evt file, extra rows are filled as -1
| Pixel properties | Quadrant properties | ||||||
|---|---|---|---|---|---|---|---|
| Quadrant | DetID | PixID | Counts | Sigma | Mean | Median | Sigma |
| A | 13 | 251 | 5637 | 125.11 | 206 | 203 | 43.4 |
| A | 1 | 162 | 3658 | 79.54 | 206 | 203 | 43.4 |
| A | 0 | 226 | 1937 | 39.92 | 206 | 203 | 43.4 |
| B | 0 | 219 | 15486 | 374.34 | 202 | 199 | 40.8 |
| B | 0 | 214 | 8978 | 214.98 | 202 | 199 | 40.8 |
| B | 15 | 204 | 8658 | 207.14 | 202 | 199 | 40.8 |
| C | 9 | 68 | 59835 | 1298.23 | 191 | 193 | 45.9 |
| C | 10 | 22 | 10375 | 221.63 | 191 | 193 | 45.9 |
| C | 8 | 229 | 2610 | 52.61 | 191 | 193 | 45.9 |
| D | 2 | 152 | 75668 | 1522.72 | 197 | 192 | 49.6 |
| D | 5 | 184 | 9413 | 186.03 | 197 | 192 | 49.6 |
| D | 5 | 81 | 3881 | 74.42 | 197 | 192 | 49.6 |
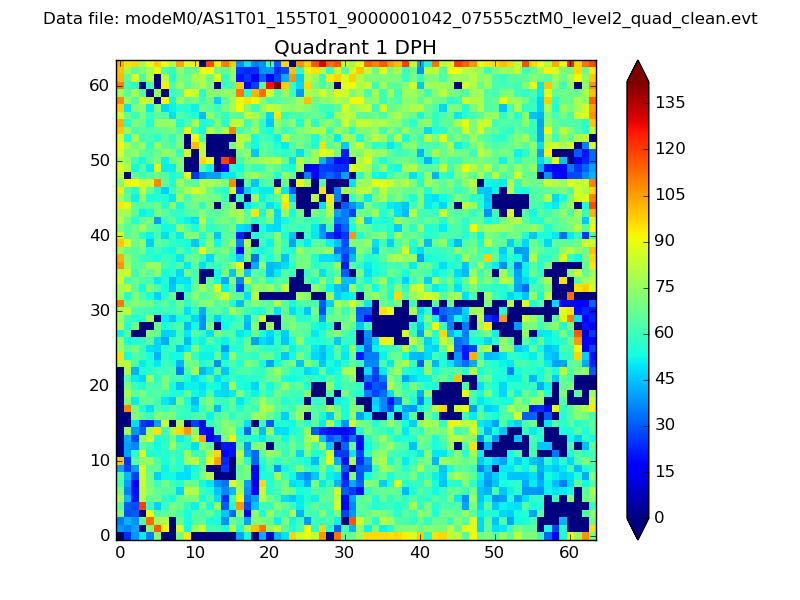
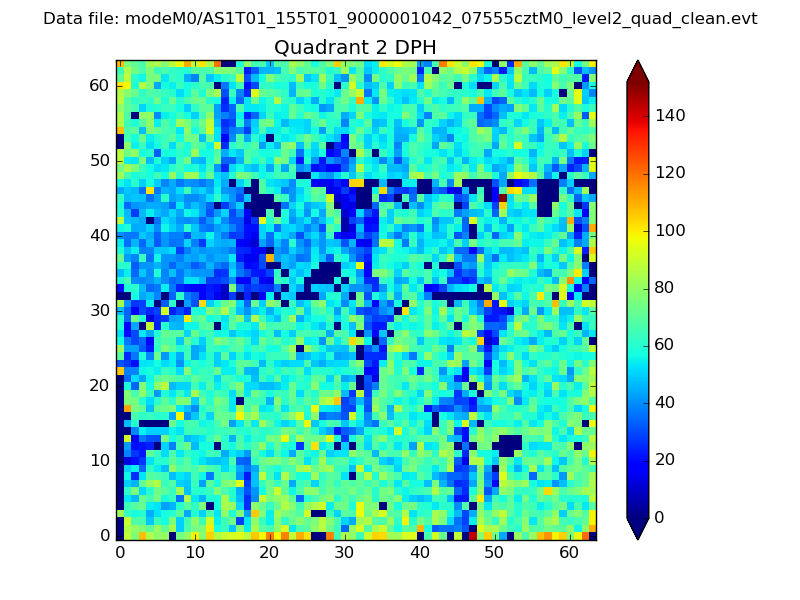
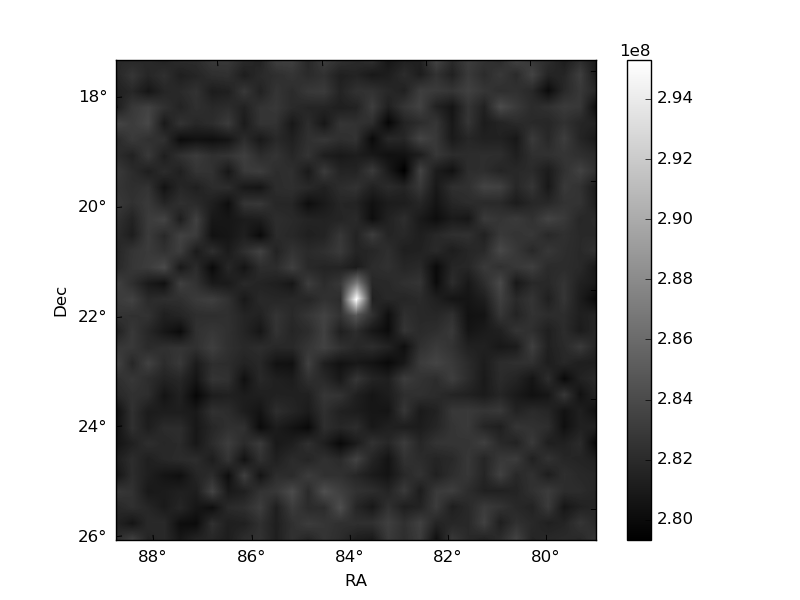
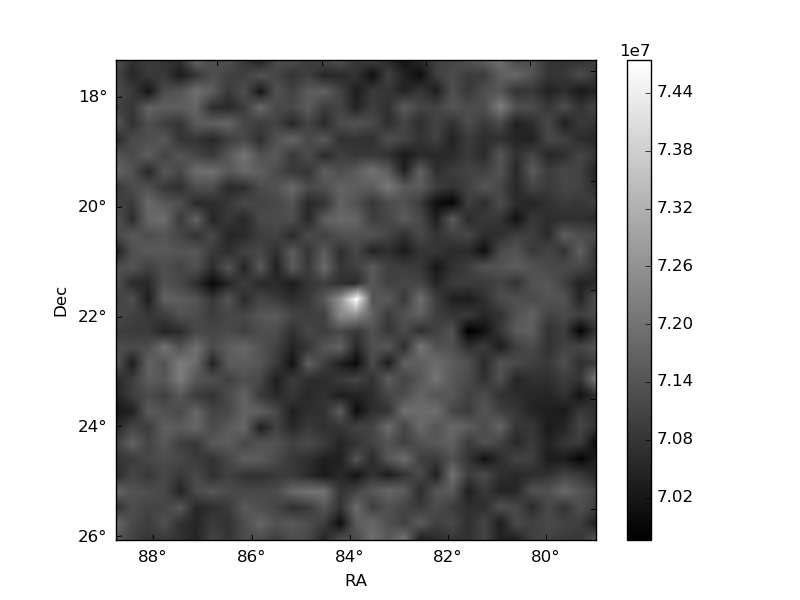
Histogram calculated using DETX and DETY for each event in the final _common_clean file
| Quadrant A | 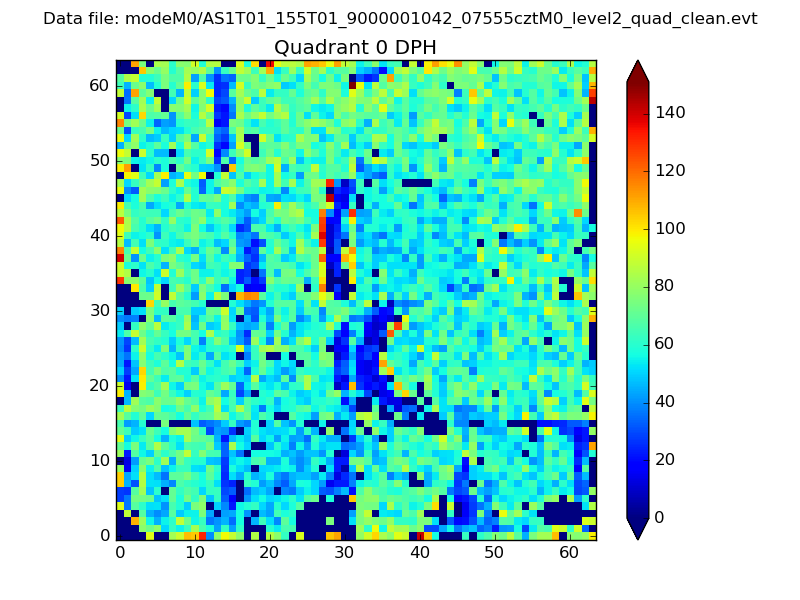 |
 |
Quadrant B |
|---|---|---|---|
| Quadrant D | 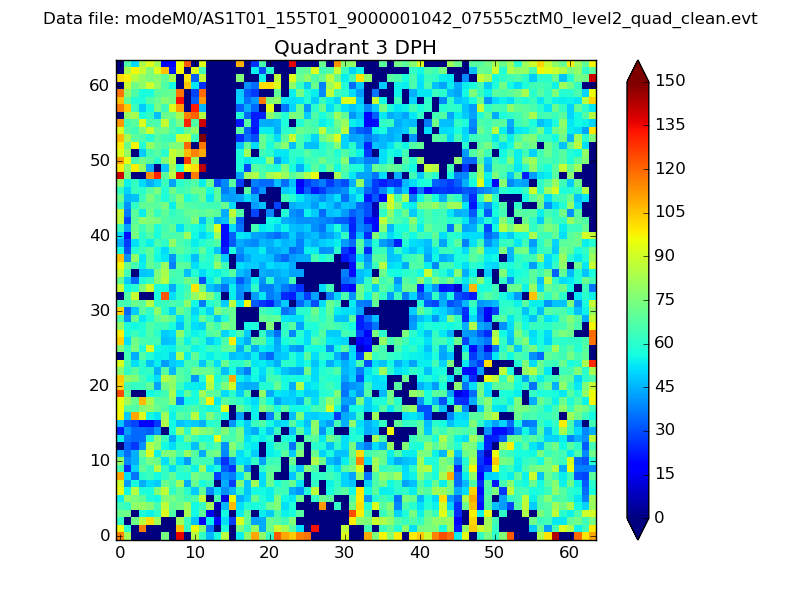 |
 |
Quadrant C |
| Plot type | Count rate plots | Images |
|---|---|---|
| Comparison with Poisson distribution Blue bars denote a histogram of data divided into 1 sec bins. Red curve is a Poisson curve with rate = median count rate of data. |
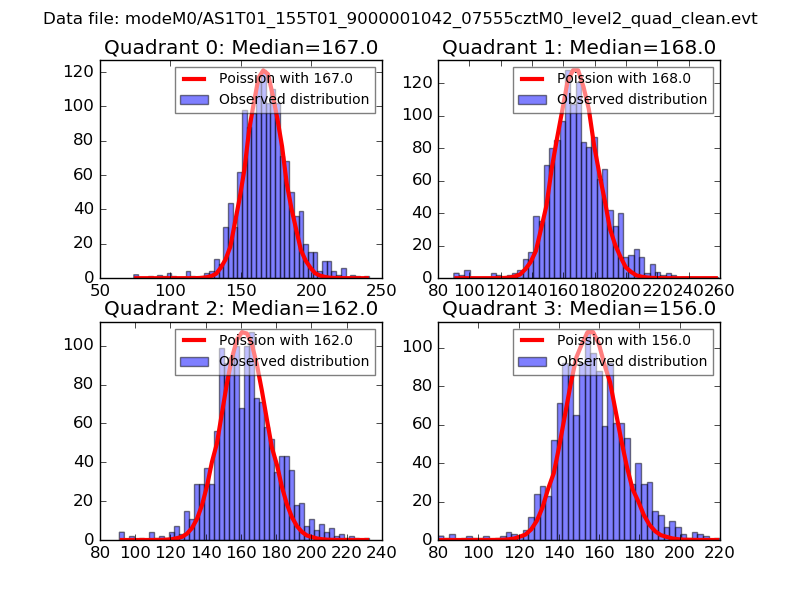 |
 |
| Quadrant-wise count rates Data is divided into 100 sec bins |
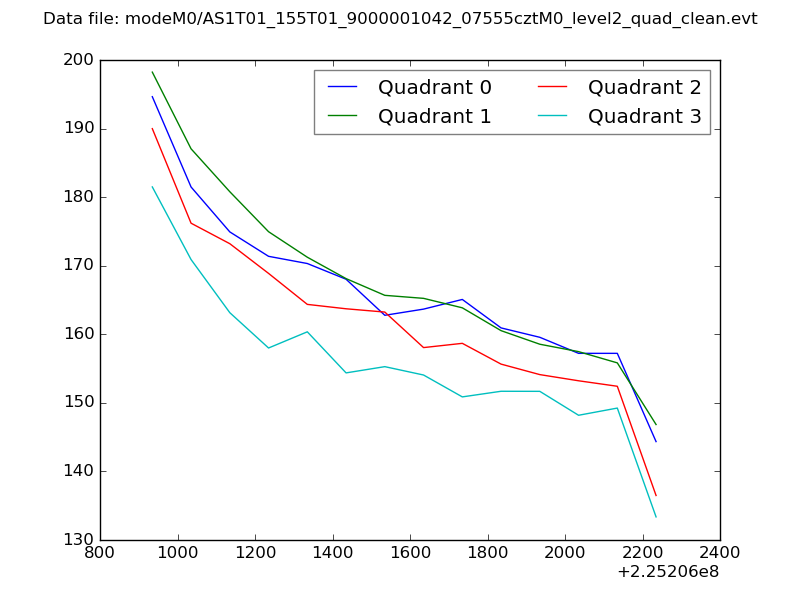 |
|
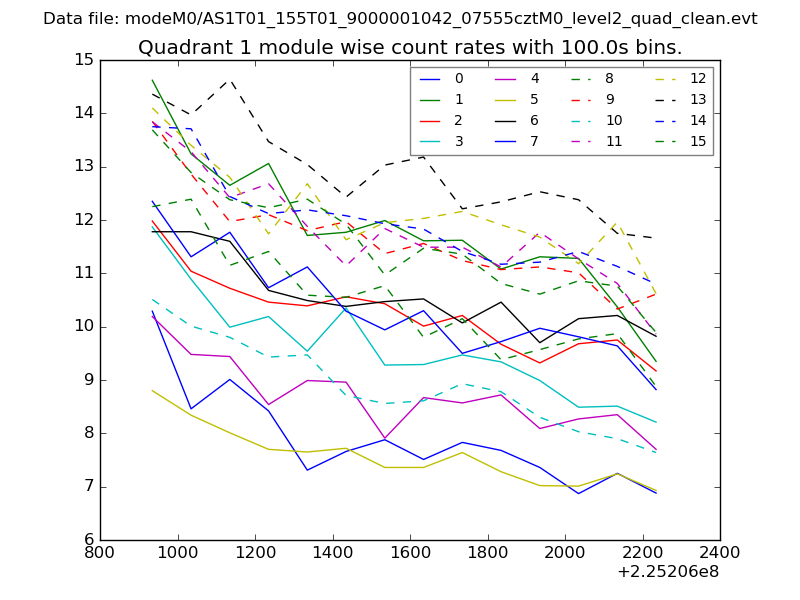
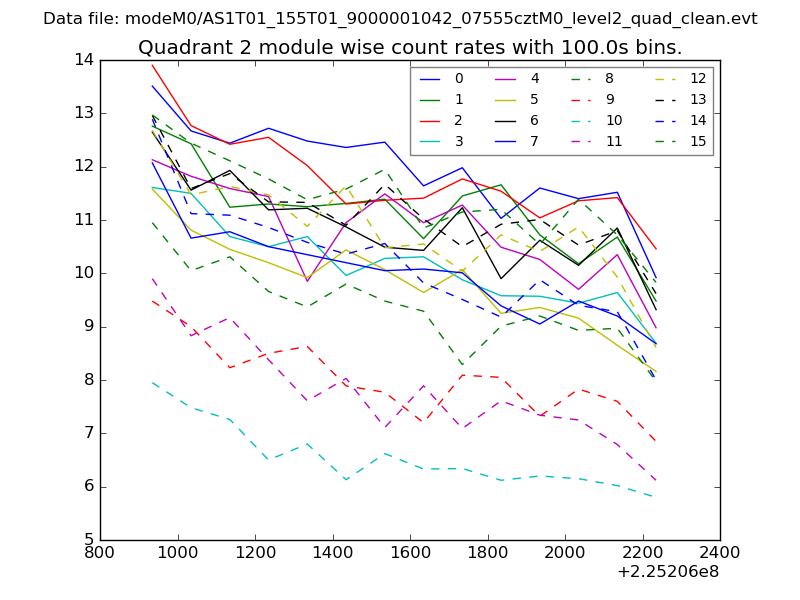
| Module-wise count rates for Quadrant A Data is divided into 100 sec bins |
 |
 |
| Module-wise count rates for Quadrant B Data is divided into 100 sec bins |
 |
 |
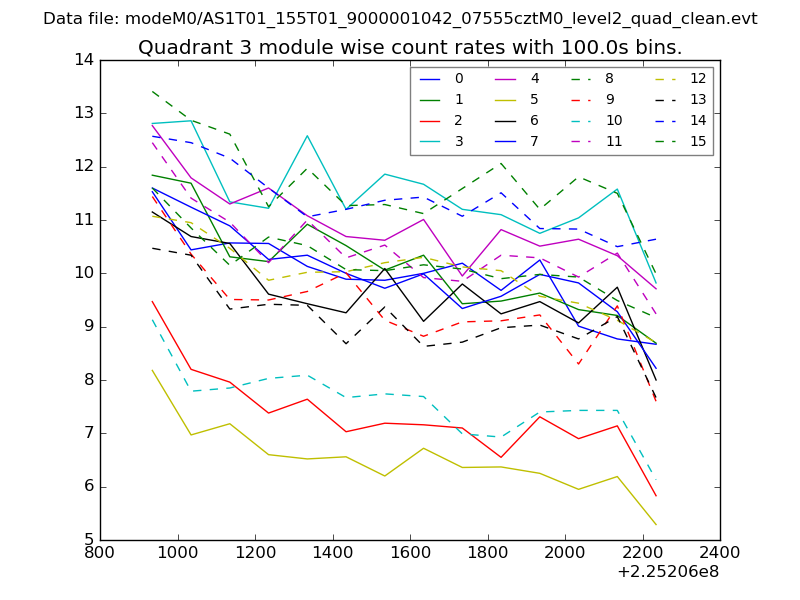
| Module-wise count rates for Quadrant C Data is divided into 100 sec bins |
 |
 |
| Module-wise count rates for Quadrant D Data is divided into 100 sec bins |
 |
 |
| Parameter | Plot |
|---|---|
| CZT HV Monitor | 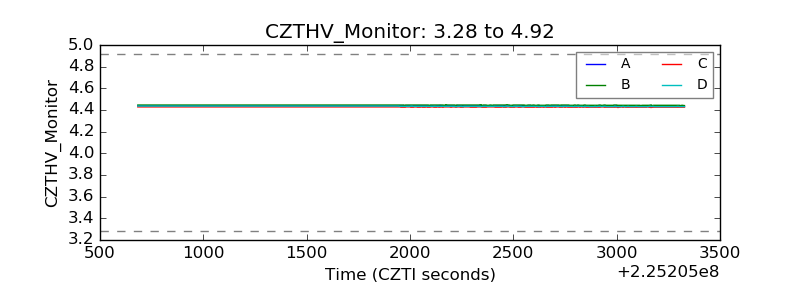 |
| D_VDD | 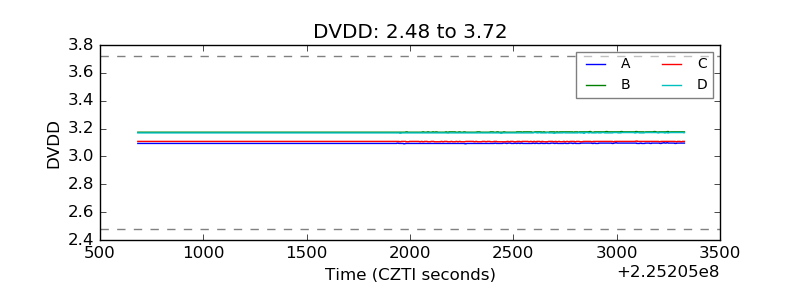 |
| Temperature 1 | 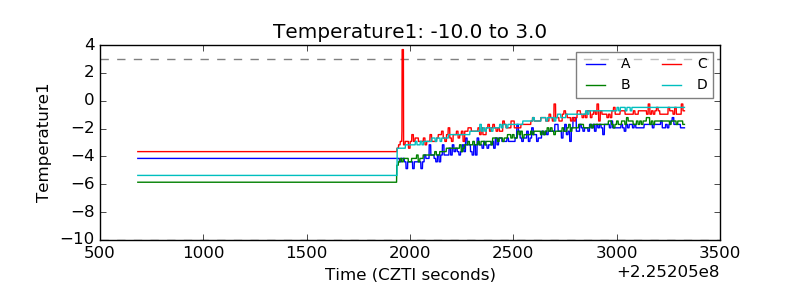 |
| Veto HV Monitor |  |
| Veto LLD | 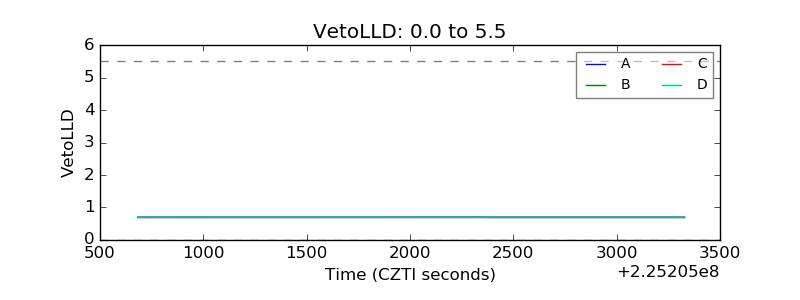 |
| Alpha Counter | 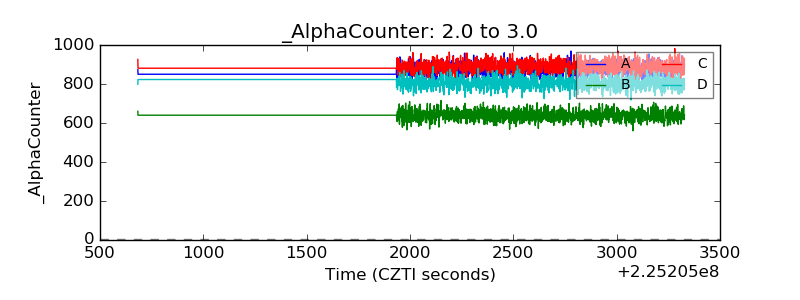 |
| _CPM_Rate | 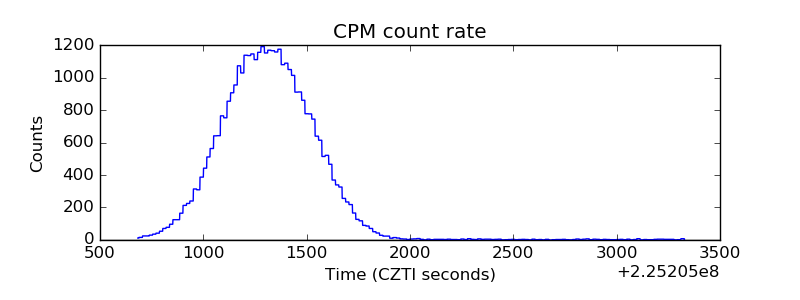 |
| CZT Counter | 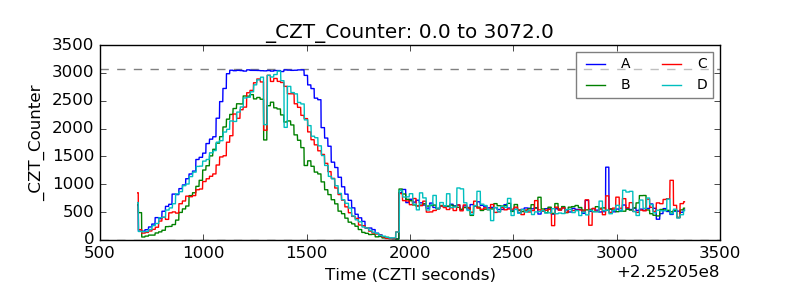 |
| +2.5 Volts monitor |  |
| +5 Volts monitor |  |
| _ROLL_ROT | 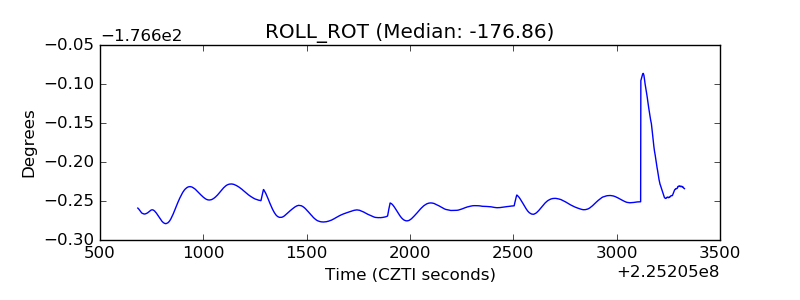 |
| _Roll_DEC | 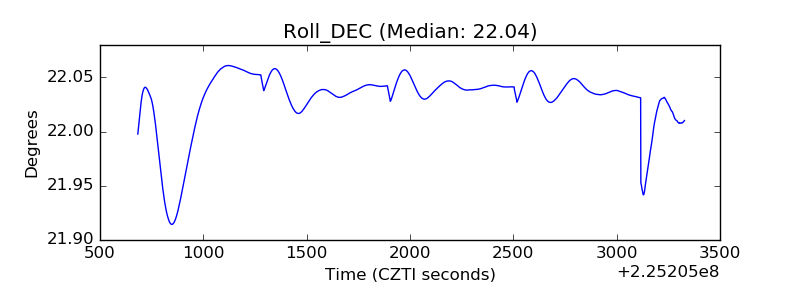 |
| _Roll_RA | 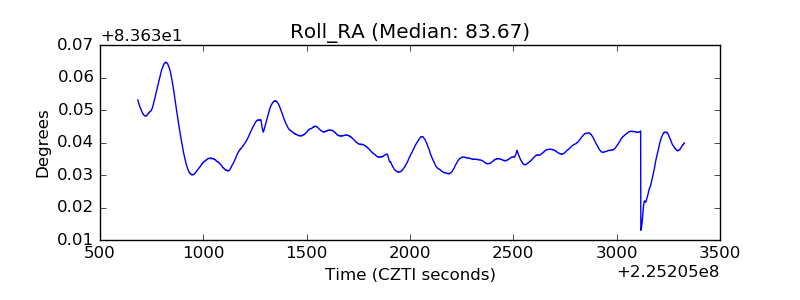 |
| Veto Counter | 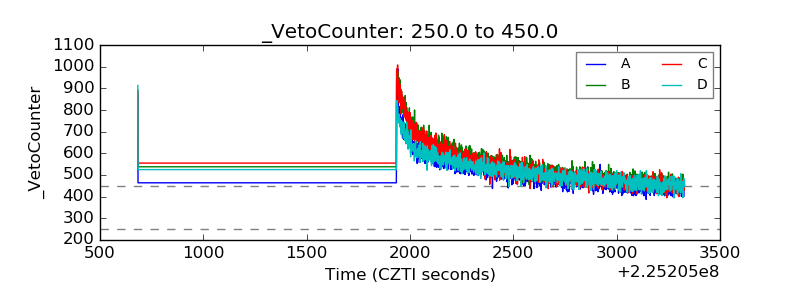 |