| Param | Original file | Final file |
|---|---|---|
| Filename | modeM0/AS1T01_155T01_9000001042_07558cztM0_level2.evt | modeM0/AS1T01_155T01_9000001042_07558cztM0_level2_quad_clean.evt |
| Size (bytes) | 441,622,080 | 94,821,120 |
| Size | 421.2 MB | 90.4 MB |
| Events in quadrant A | 2,878,992 | 637,026 |
| Events in quadrant B | 2,908,209 | 637,851 |
| Events in quadrant C | 4,051,704 | 605,996 |
| Events in quadrant D | 3,150,930 | 594,768 |
| Mode M0 | |||
|---|---|---|---|
| Quadrant | BADHDUFLAG | Total packets | Discarded packets |
| A | 0 | 12032 | 2 |
| B | 0 | 12151 | 1 |
| C | 0 | 15726 | 1 |
| D | 0 | 12959 | 1 |
| Mode M9 | |||
|---|---|---|---|
| Quadrant | BADHDUFLAG | Total packets | Discarded packets |
| A | 0 | 12 | 0 |
| B | 0 | 12 | 0 |
| C | 0 | 12 | 0 |
| D | 0 | 12 | 0 |
| Mode SS | |||
|---|---|---|---|
| Quadrant | BADHDUFLAG | Total packets | Discarded packets |
| A | 0 | 116 | 0 |
| B | 0 | 116 | 0 |
| C | 0 | 116 | 0 |
| D | 0 | 116 | 0 |
| Quadrant | Total seconds | Saturated seconds | Saturation percentage |
|---|---|---|---|
| A | 5658 | 137 | 2.421350% |
| B | 5658 | 120 | 2.120891% |
| C | 5658 | 262 | 4.630612% |
| D | 5658 | 144 | 2.545069% |
Noise dominated data is calculated using 1-second bins in cleaned event files. If a bin has >2000 counts, and if more than 50% of those come from <1% of pixels, then it is considered to be noise-dominated and hence unusable.
| Quadrant | # 1 sec bins | Bins with >0 counts | Bins with >2000 counts | High rate bins dominated by noise | Noise dominated (total time) | Noise dominated (detector-on time) | Marked lightcurve |
|---|---|---|---|---|---|---|---|
| A | 6848 | 5658 | 2 | 2 | 0.03% | 0.04% | 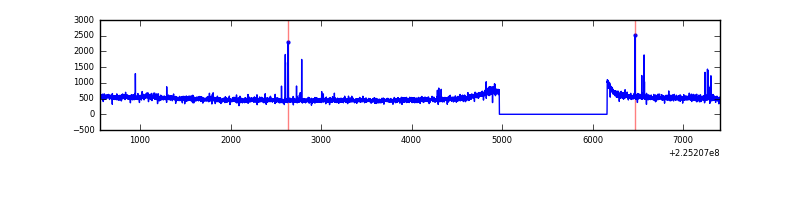 |
| B | 6848 | 5659 | 1 | 1 | 0.01% | 0.02% | 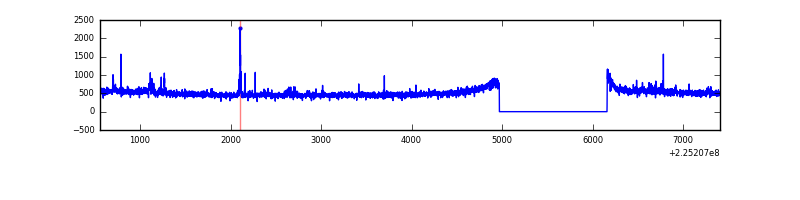 |
| C | 6848 | 5658 | 133 | 133 | 1.94% | 2.35% | 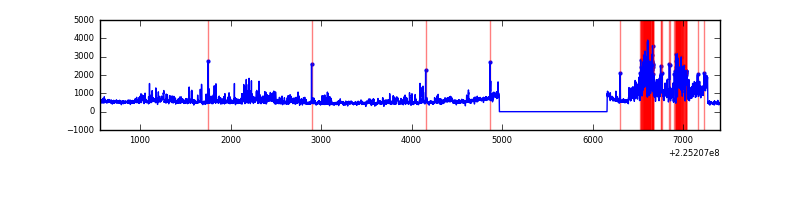 |
| D | 6848 | 5658 | 29 | 29 | 0.42% | 0.51% | 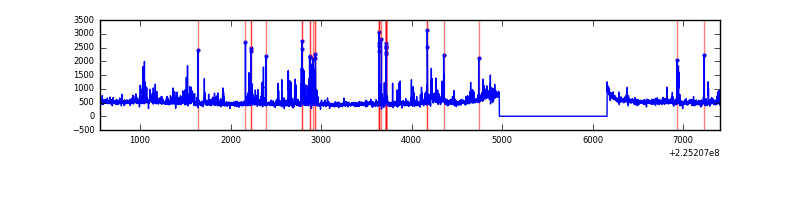 |
Top three noisy pixels from each quadrant. If the there are fewer than three noisy pixels in the level2.evt file, extra rows are filled as -1
| Pixel properties | Quadrant properties | ||||||
|---|---|---|---|---|---|---|---|
| Quadrant | DetID | PixID | Counts | Sigma | Mean | Median | Sigma |
| A | 3 | 1 | 36201 | 235.91 | 733 | 720 | 150.4 |
| A | 1 | 162 | 9345 | 57.35 | 733 | 720 | 150.4 |
| A | 13 | 251 | 6889 | 41.02 | 733 | 720 | 150.4 |
| B | 0 | 214 | 29628 | 206.5 | 731 | 716 | 140.0 |
| B | 0 | 230 | 19940 | 137.3 | 731 | 716 | 140.0 |
| B | 0 | 219 | 18511 | 127.1 | 731 | 716 | 140.0 |
| C | 9 | 68 | 1312846 | 8086.54 | 698 | 703 | 162.3 |
| C | 10 | 22 | 10776 | 62.08 | 698 | 703 | 162.3 |
| C | 13 | 61 | 5346 | 28.61 | 698 | 703 | 162.3 |
| D | 2 | 152 | 186597 | 1049.6 | 712 | 692 | 177.1 |
| D | 2 | 244 | 132873 | 746.28 | 712 | 692 | 177.1 |
| D | 2 | 14 | 80057 | 448.09 | 712 | 692 | 177.1 |
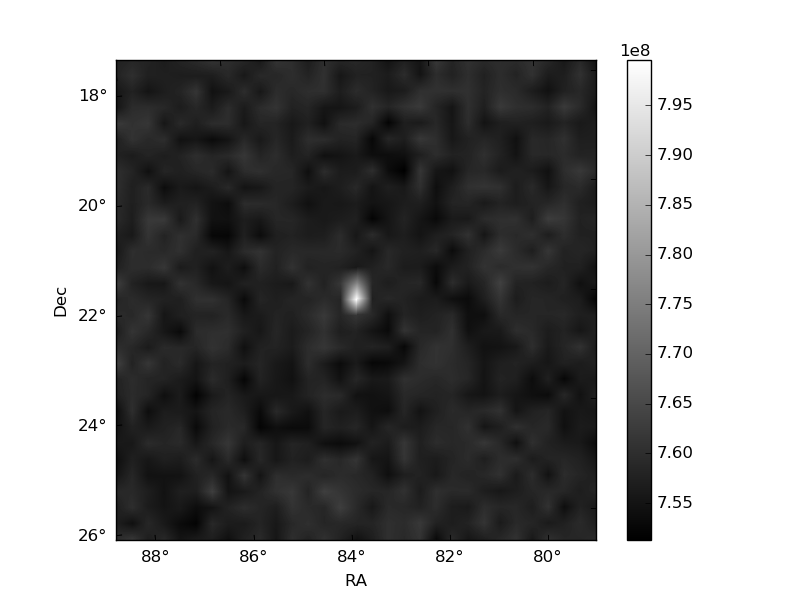
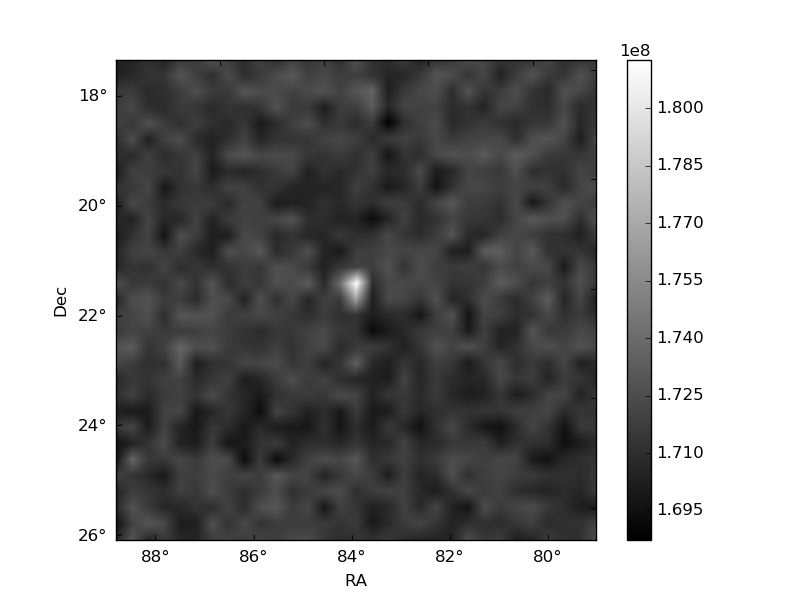
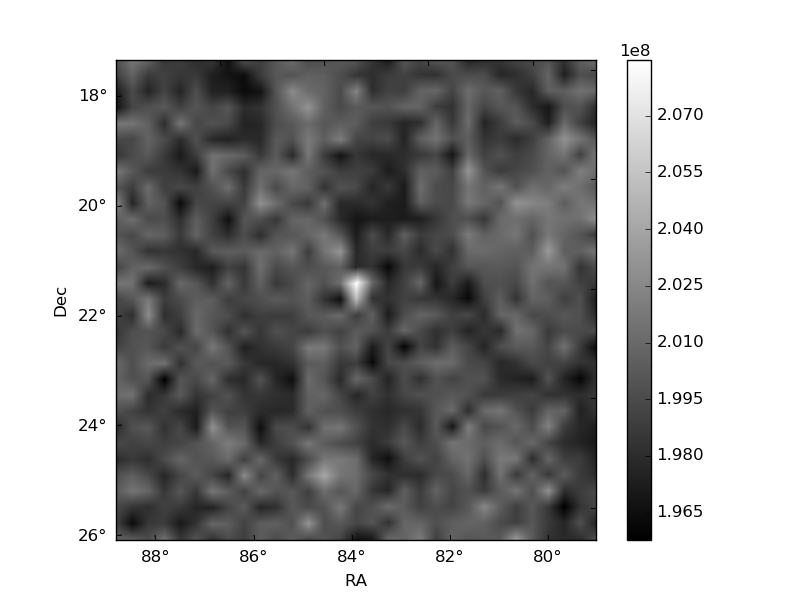
Histogram calculated using DETX and DETY for each event in the final _common_clean file
| Quadrant A | 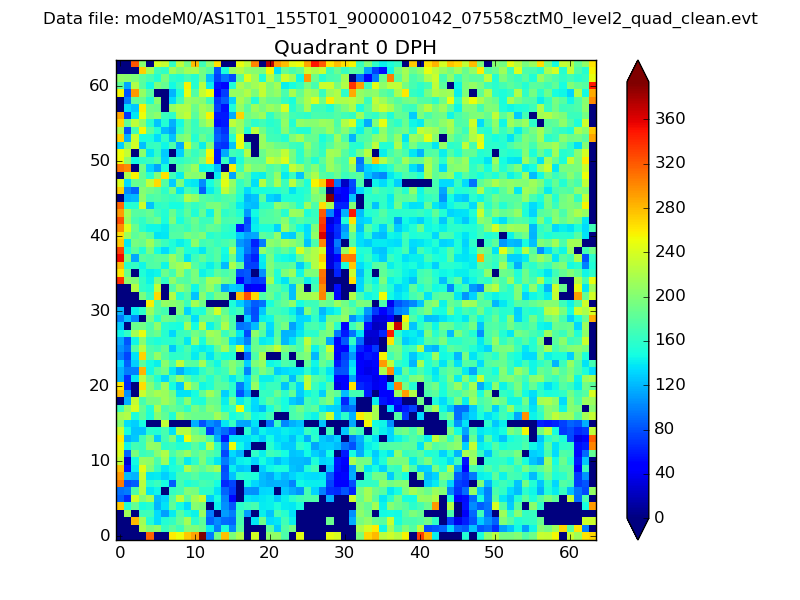 |
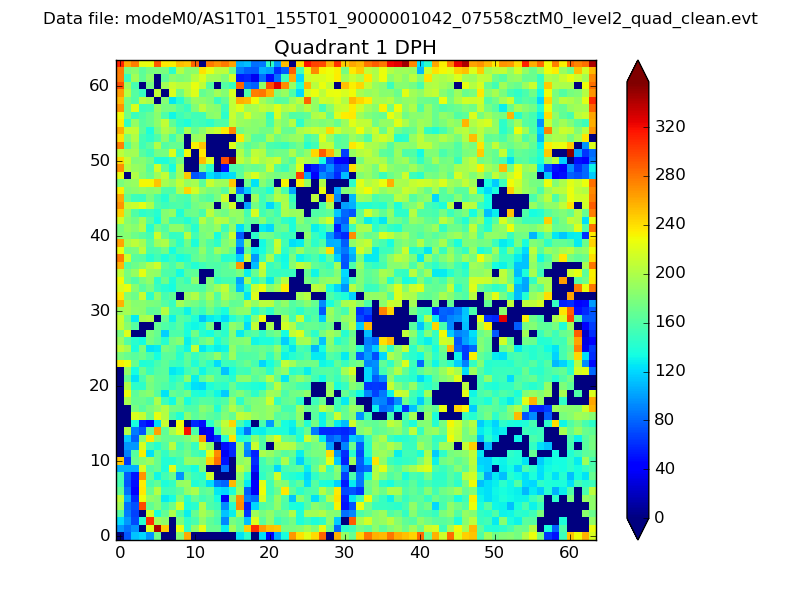 |
Quadrant B |
|---|---|---|---|
| Quadrant D | 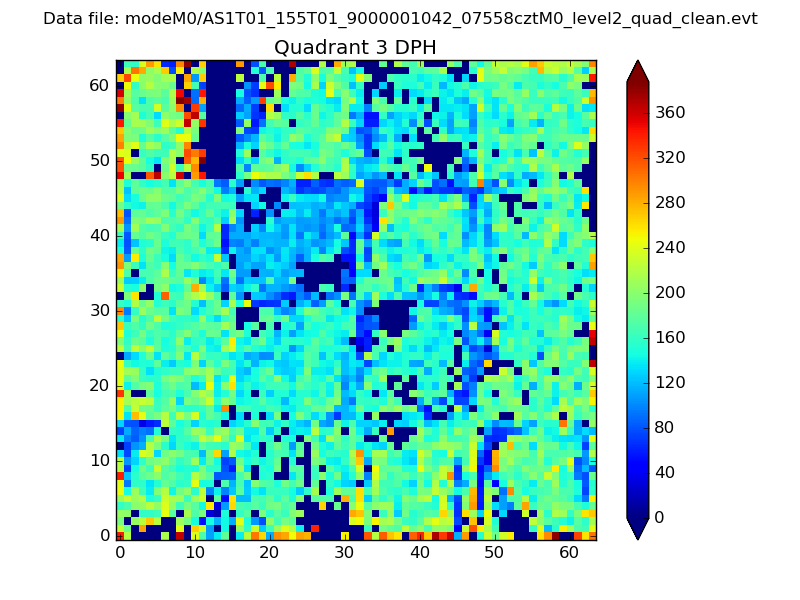 |
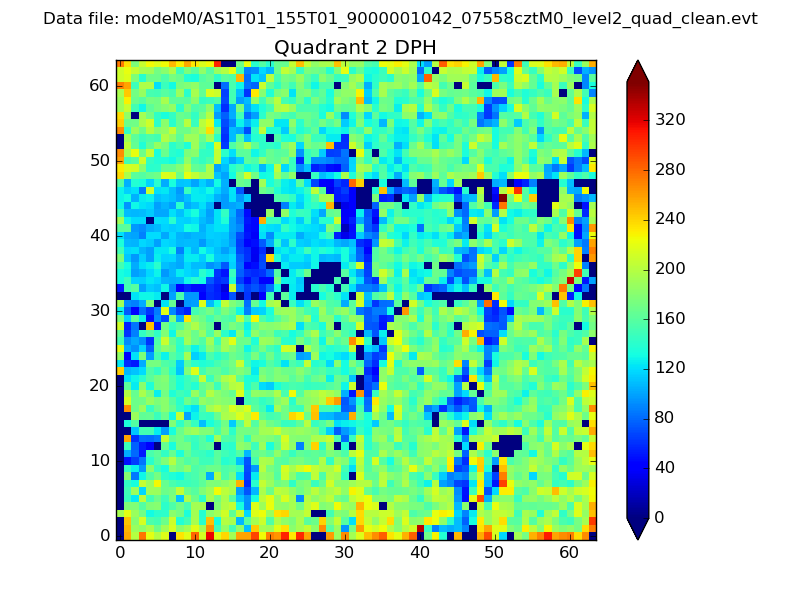 |
Quadrant C |
| Plot type | Count rate plots | Images |
|---|---|---|
| Comparison with Poisson distribution Blue bars denote a histogram of data divided into 1 sec bins. Red curve is a Poisson curve with rate = median count rate of data. |
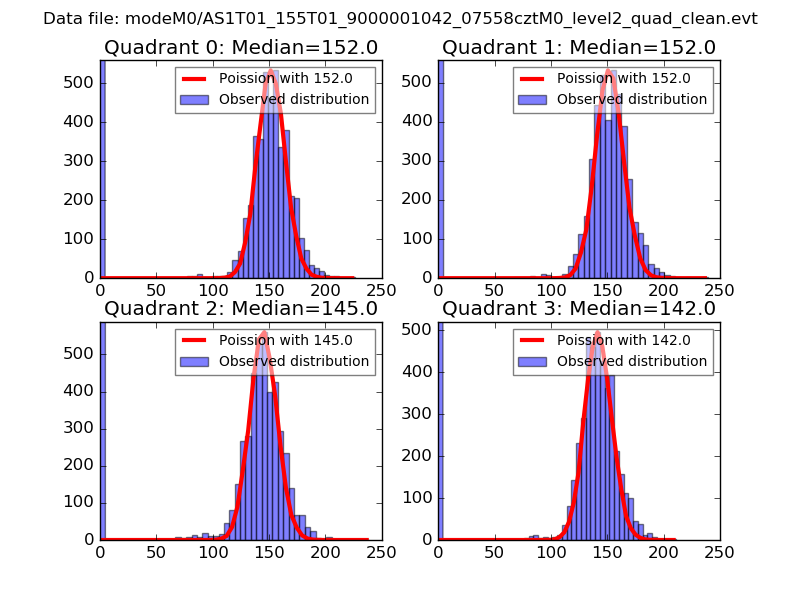 |
 |
| Quadrant-wise count rates Data is divided into 100 sec bins |
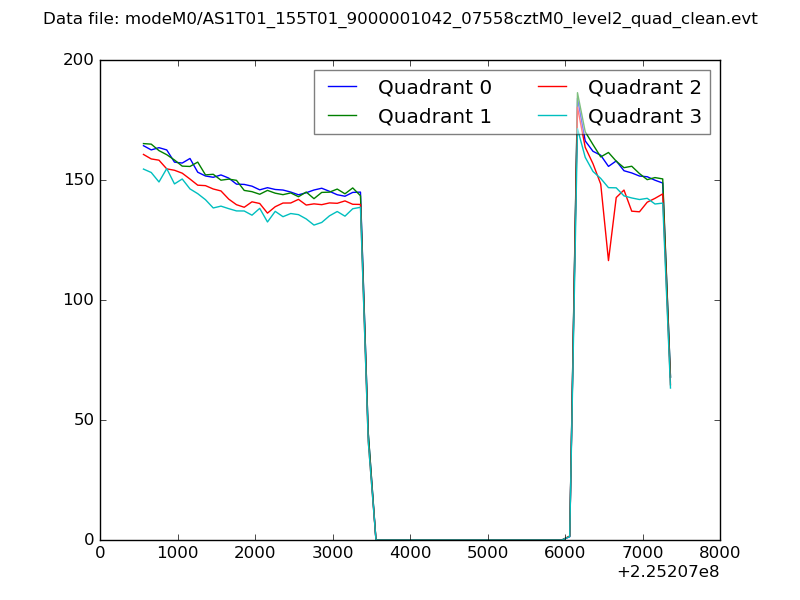 |
|
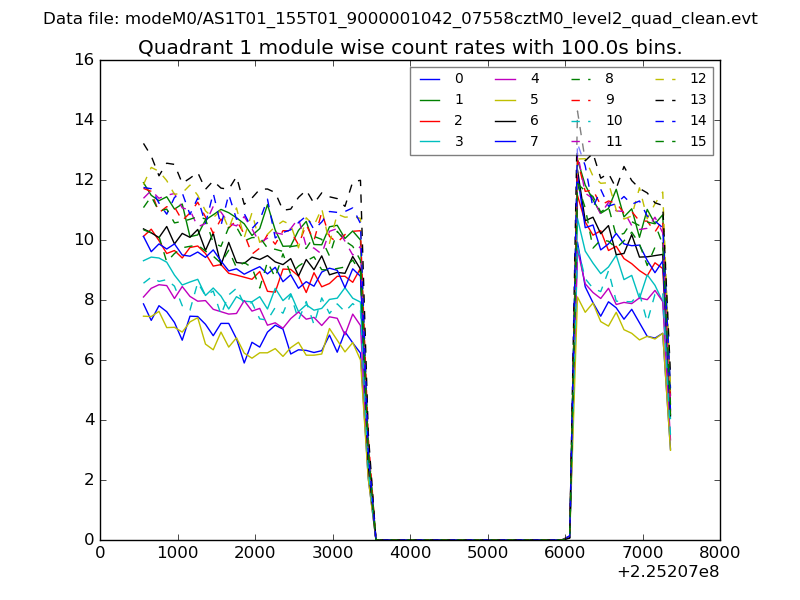
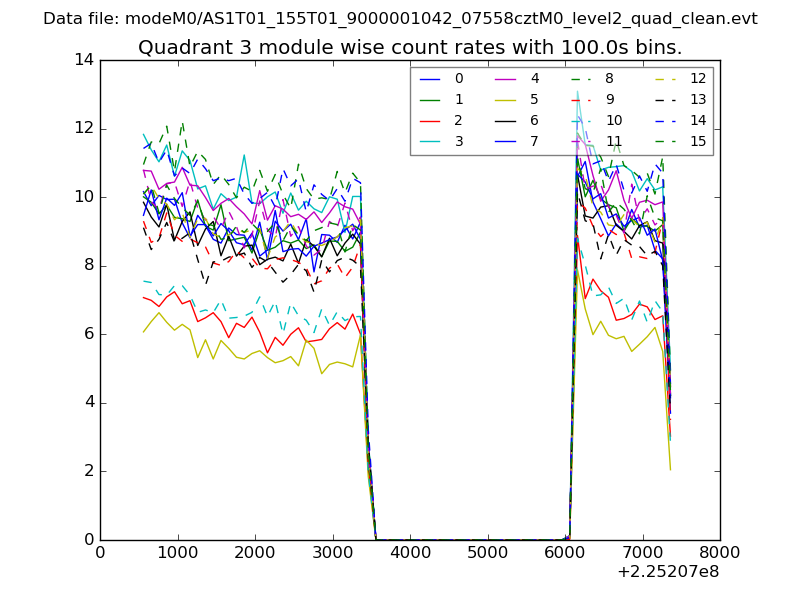
| Module-wise count rates for Quadrant A Data is divided into 100 sec bins |
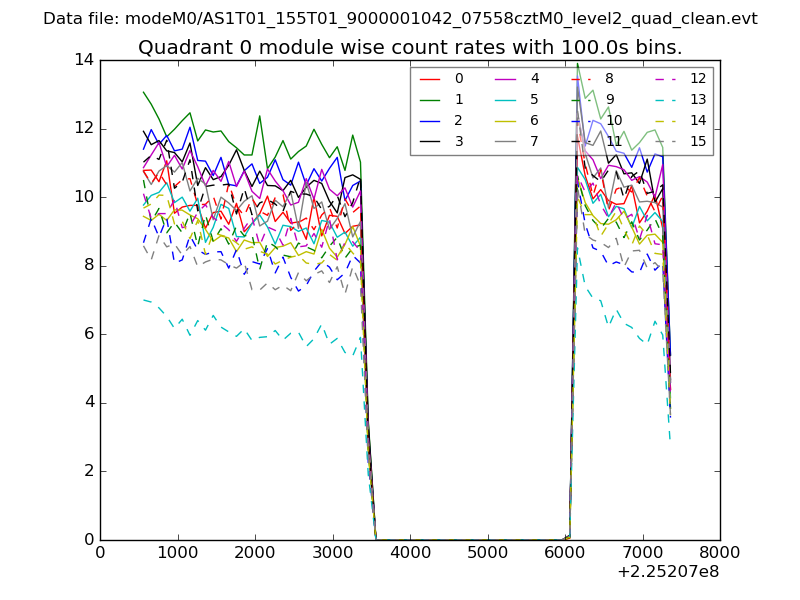 |
 |
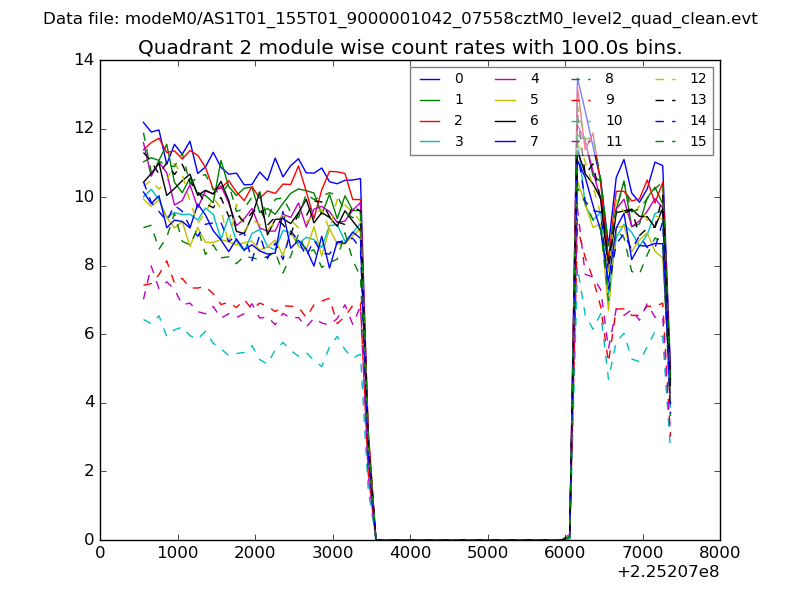
| Module-wise count rates for Quadrant B Data is divided into 100 sec bins |
 |
 |
| Module-wise count rates for Quadrant C Data is divided into 100 sec bins |
 |
 |
| Module-wise count rates for Quadrant D Data is divided into 100 sec bins |
 |
 |
| Parameter | Plot |
|---|---|
| CZT HV Monitor | 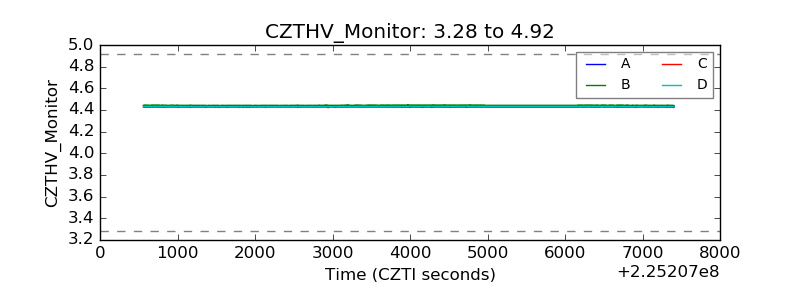 |
| D_VDD | 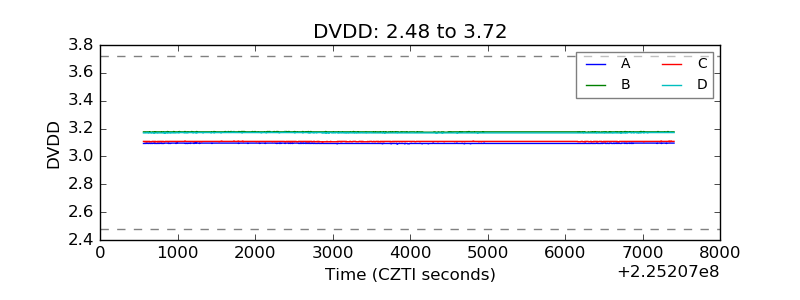 |
| Temperature 1 | 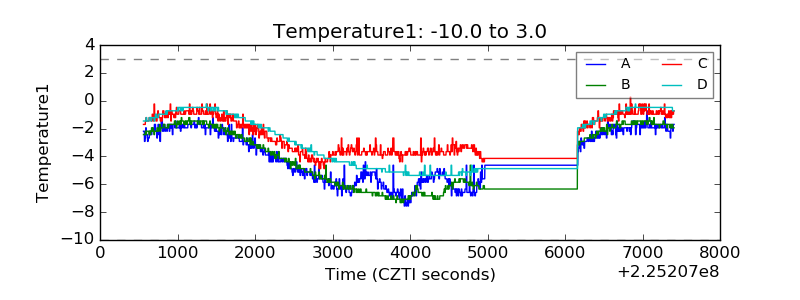 |
| Veto HV Monitor | 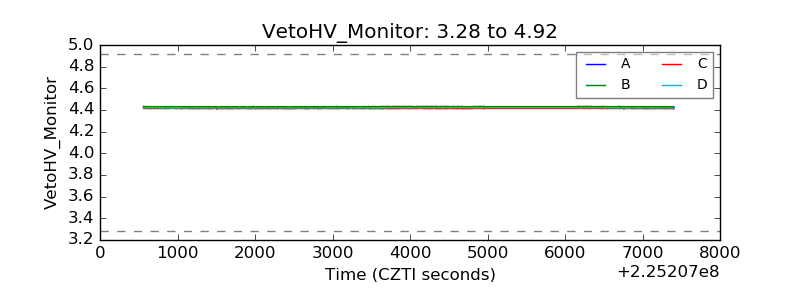 |
| Veto LLD | 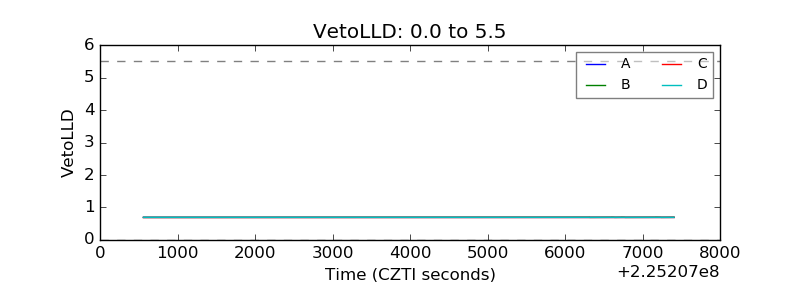 |
| Alpha Counter | 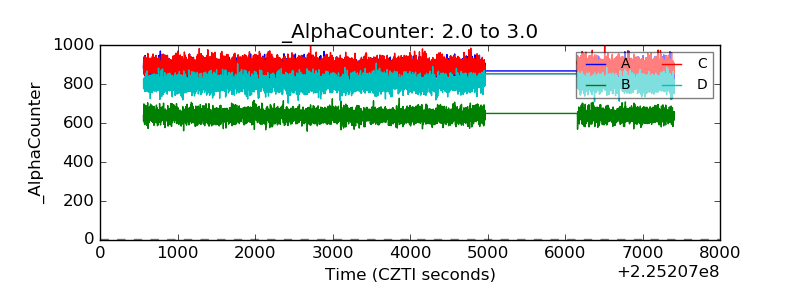 |
| _CPM_Rate | 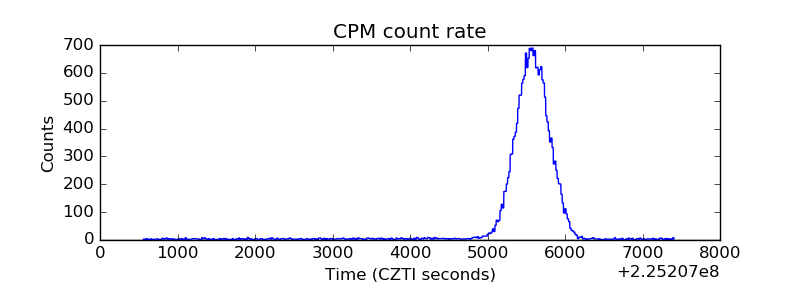 |
| CZT Counter | 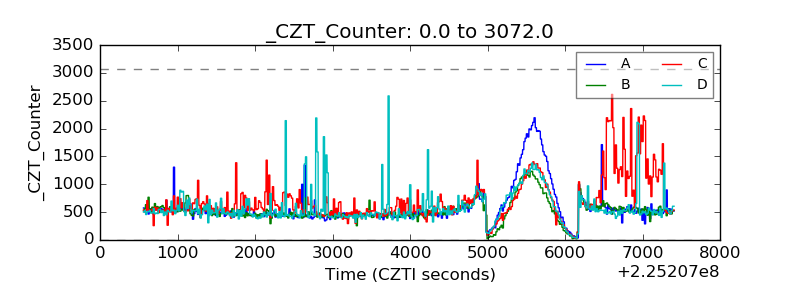 |
| +2.5 Volts monitor |  |
| +5 Volts monitor |  |
| _ROLL_ROT | 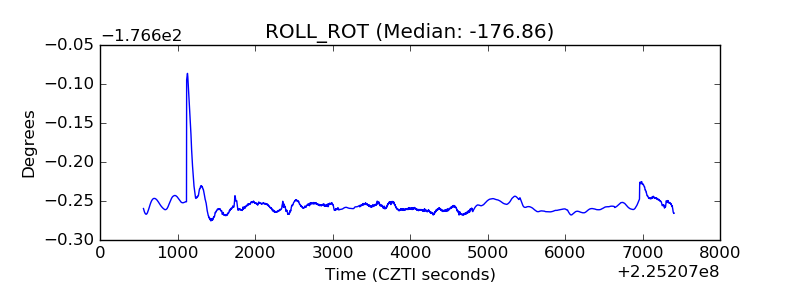 |
| _Roll_DEC | 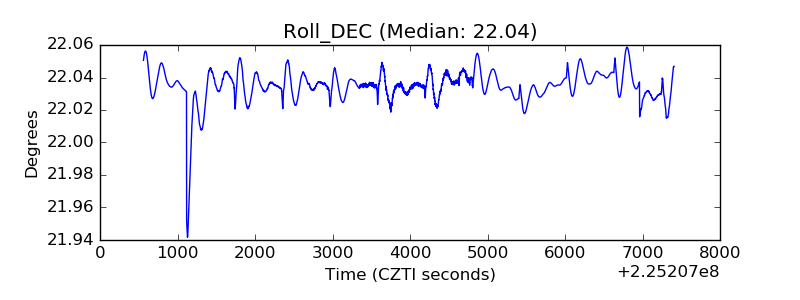 |
| _Roll_RA | 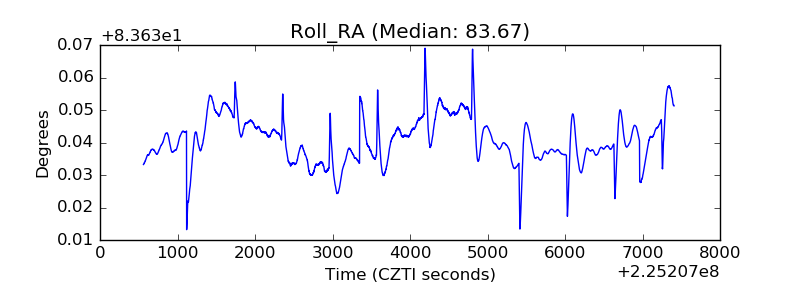 |
| Veto Counter | 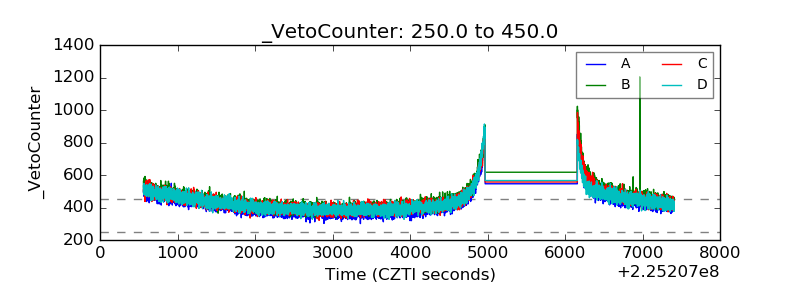 |