| Param | Original file | Final file |
|---|---|---|
| Filename | modeM0/AS1G06_117T01_9000001046cztM0_level2.fits | modeM0/AS1G06_117T01_9000001046cztM0_level2_quad_clean.evt |
| Size (bytes) | 971,118,720 | 938,655,360 |
| Size | 926.1 MB | 895.2 MB |
| Events in quadrant A | 5,982,940 | 5,759,859 |
| Events in quadrant B | 5,760,890 | 5,807,633 |
| Events in quadrant C | 5,450,870 | 4,755,308 |
| Events in quadrant D | 5,021,426 | 4,919,102 |
| Mode SS | |||
|---|---|---|---|
| Quadrant | BADHDUFLAG | Total packets | Discarded packets |
| A | 0 | 2140 | 0 |
| B | 0 | 2140 | 0 |
| C | 0 | 2140 | 0 |
| D | 0 | 2140 | 0 |
| Mode M0 | |||
|---|---|---|---|
| Quadrant | BADHDUFLAG | Total packets | Discarded packets |
| A | 0 | 226719 | 0 |
| B | 0 | 218512 | 0 |
| C | 0 | 391271 | 0 |
| D | 0 | 270111 | 0 |
| Mode M9 | |||
|---|---|---|---|
| Quadrant | BADHDUFLAG | Total packets | Discarded packets |
| A | 0 | 164 | 0 |
| B | 0 | 164 | 0 |
| C | 0 | 164 | 0 |
| D | 0 | 164 | 0 |
| Quadrant | Total seconds | Saturated seconds | Saturation percentage |
|---|---|---|---|
| A | 104830 | 1376 | 1.312601% |
| B | 104831 | 1153 | 1.099865% |
| C | 104832 | 16047 | 15.307349% |
| D | 104831 | 5110 | 4.874512% |
Noise dominated data is calculated using 1-second bins in cleaned event files. If a bin has >2000 counts, and if more than 50% of those come from <1% of pixels, then it is considered to be noise-dominated and hence unusable.
| Quadrant | # 1 sec bins | Bins with >0 counts | Bins with >2000 counts | High rate bins dominated by noise | Noise dominated (total time) | Noise dominated (detector-on time) | Marked lightcurve |
|---|---|---|---|---|---|---|---|
| A | 121349 | 104829 | 0 | 0 | 0.00% | 0.00% |  |
| B | 121349 | 104827 | 0 | 0 | 0.00% | 0.00% |  |
| C | 121349 | 104746 | 0 | 0 | 0.00% | 0.00% |  |
| D | 121349 | 104737 | 0 | 0 | 0.00% | 0.00% |  |
Top three noisy pixels from each quadrant. If the there are fewer than three noisy pixels in the level2.evt file, extra rows are filled as -1
| Pixel properties | Quadrant properties | ||||||
|---|---|---|---|---|---|---|---|
| Quadrant | DetID | PixID | Counts | Sigma | Mean | Median | Sigma |
| A | 0 | 29 | 5826 | 11.17 | 1552 | 1449 | 391.8 |
| A | 7 | 110 | 5142 | 9.43 | 1552 | 1449 | 391.8 |
| A | 0 | 30 | 4473 | 7.72 | 1552 | 1449 | 391.8 |
| B | 2 | 9 | 4955 | 11.62 | 1521 | 1448 | 301.9 |
| B | 12 | 226 | 3915 | 8.17 | 1521 | 1448 | 301.9 |
| B | 3 | 17 | 3858 | 7.98 | 1521 | 1448 | 301.9 |
| C | 1 | 81 | 4014 | 7.03 | 1441 | 1338 | 380.7 |
| C | 1 | 80 | 3991 | 6.97 | 1441 | 1338 | 380.7 |
| C | 12 | 241 | 3913 | 6.76 | 1441 | 1338 | 380.7 |
| D | 3 | 14 | 3744 | 6.33 | 1432 | 1301 | 386.1 |
| D | 7 | 5 | 3630 | 6.03 | 1432 | 1301 | 386.1 |
| D | 3 | 31 | 3586 | 5.92 | 1432 | 1301 | 386.1 |
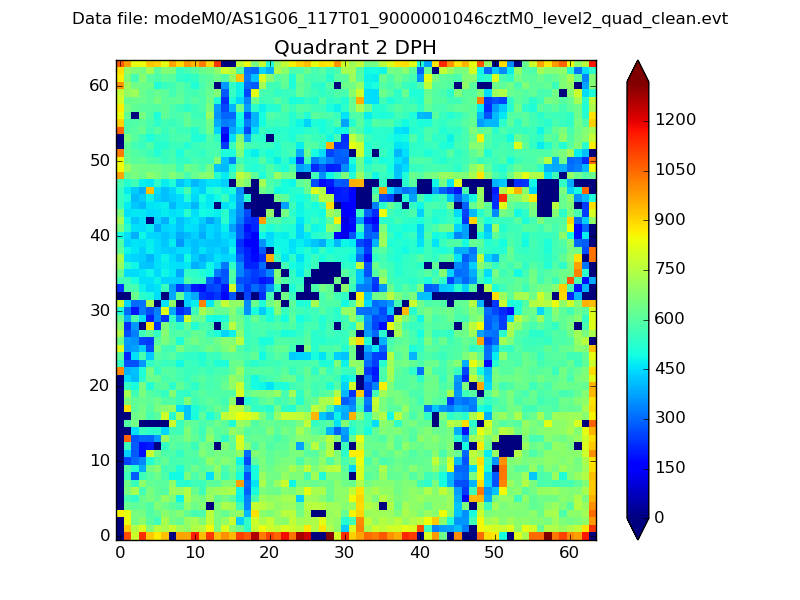
Histogram calculated using DETX and DETY for each event in the final _common_clean file
| Quadrant A |  |
 |
Quadrant B |
|---|---|---|---|
| Quadrant D | 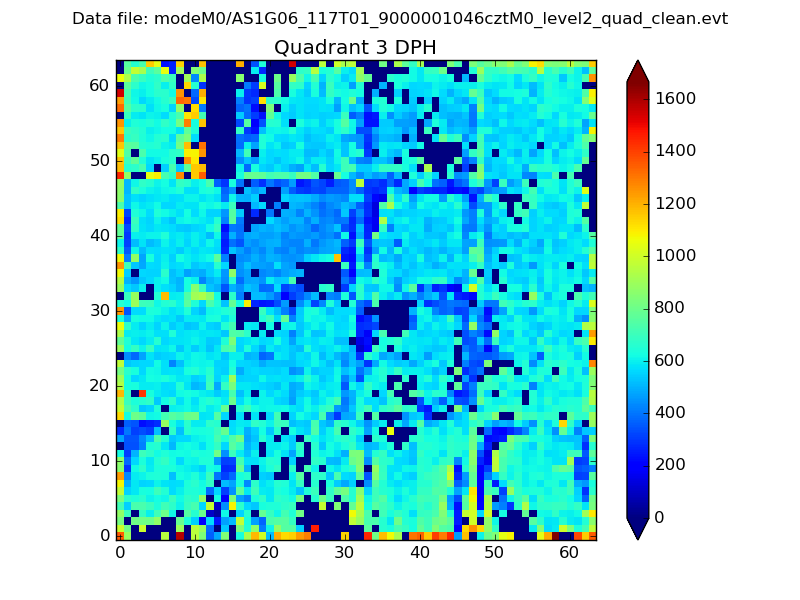 |
 |
Quadrant C |
| Plot type | Count rate plots | Images |
|---|---|---|
| Comparison with Poisson distribution Blue bars denote a histogram of data divided into 1 sec bins. Red curve is a Poisson curve with rate = median count rate of data. |
 |
 |
| Quadrant-wise count rates Data is divided into 100 sec bins |
 |
|
| Module-wise count rates for Quadrant A Data is divided into 100 sec bins |
 |
 |
| Module-wise count rates for Quadrant B Data is divided into 100 sec bins |
 |
 |
| Module-wise count rates for Quadrant C Data is divided into 100 sec bins |
 |
 |
| Module-wise count rates for Quadrant D Data is divided into 100 sec bins |
 |
 |
| Parameter | Plot |
|---|---|
| CZT HV Monitor |  |
| D_VDD |  |
| Temperature 1 |  |
| Veto HV Monitor |  |
| Veto LLD |  |
| Alpha Counter |  |
| _CPM_Rate |  |
| CZT Counter |  |
| +2.5 Volts monitor |  |
| +5 Volts monitor |  |
| _ROLL_ROT |  |
| _Roll_DEC |  |
| _Roll_RA |  |
| Veto Counter |  |