| Param | Original file | Final file |
|---|---|---|
| Filename | modeM0/AS1G06_117T01_9000001046_07592cztM0_level2.evt | modeM0/AS1G06_117T01_9000001046_07592cztM0_level2_quad_clean.evt |
| Size (bytes) | 1,192,576,320 | 135,515,520 |
| Size | 1.1 GB | 129.2 MB |
| Events in quadrant A | 5,625,465 | 868,668 |
| Events in quadrant B | 5,220,403 | 889,460 |
| Events in quadrant C | 16,094,051 | 729,261 |
| Events in quadrant D | 8,398,617 | 816,731 |
| Mode SS | |||
|---|---|---|---|
| Quadrant | BADHDUFLAG | Total packets | Discarded packets |
| A | 0 | 234 | 0 |
| B | 0 | 234 | 0 |
| C | 0 | 234 | 0 |
| D | 0 | 234 | 0 |
| Mode M0 | |||
|---|---|---|---|
| Quadrant | BADHDUFLAG | Total packets | Discarded packets |
| A | 0 | 24070 | 10 |
| B | 0 | 23595 | 4 |
| C | 0 | 56125 | 9 |
| D | 0 | 33281 | 2 |
| Mode M9 | |||
|---|---|---|---|
| Quadrant | BADHDUFLAG | Total packets | Discarded packets |
| A | 0 | 13 | 0 |
| B | 0 | 13 | 0 |
| C | 0 | 13 | 0 |
| D | 0 | 13 | 0 |
| Quadrant | Total seconds | Saturated seconds | Saturation percentage |
|---|---|---|---|
| A | 11541 | 77 | 0.667187% |
| B | 11543 | 95 | 0.823010% |
| C | 11543 | 4016 | 34.791649% |
| D | 11544 | 869 | 7.527720% |
Noise dominated data is calculated using 1-second bins in cleaned event files. If a bin has >2000 counts, and if more than 50% of those come from <1% of pixels, then it is considered to be noise-dominated and hence unusable.
| Quadrant | # 1 sec bins | Bins with >0 counts | Bins with >2000 counts | High rate bins dominated by noise | Noise dominated (total time) | Noise dominated (detector-on time) | Marked lightcurve |
|---|---|---|---|---|---|---|---|
| A | 12794 | 11546 | 1 | 1 | 0.01% | 0.01% | 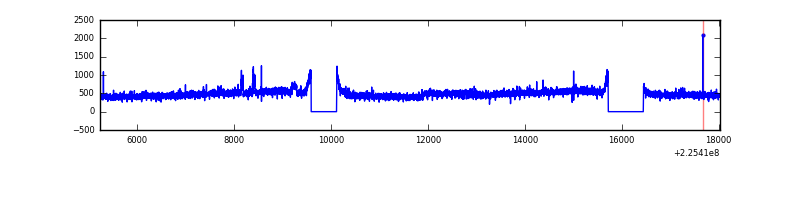 |
| B | 12794 | 11546 | 0 | 0 | 0.00% | 0.00% | 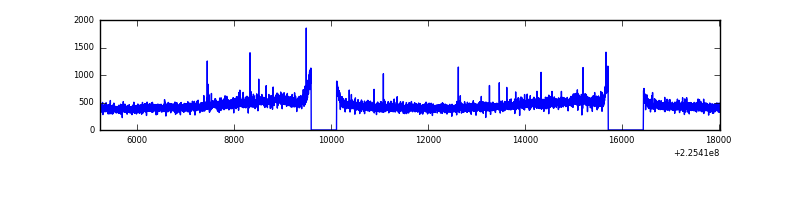 |
| C | 12794 | 11545 | 3526 | 3526 | 27.56% | 30.54% | 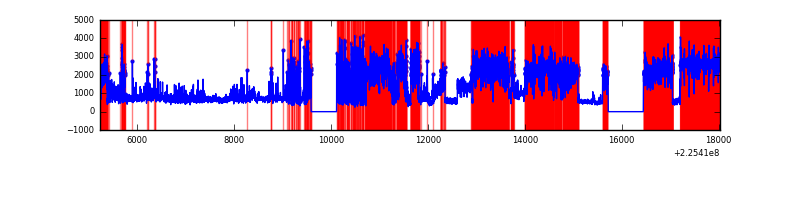 |
| D | 12794 | 11546 | 549 | 549 | 4.29% | 4.75% | 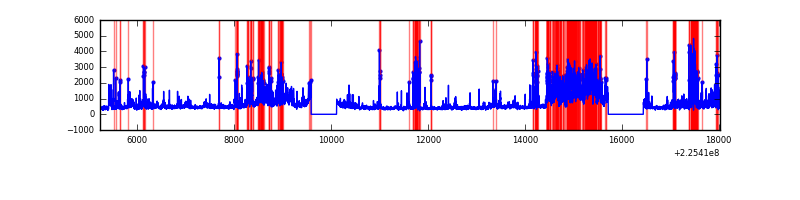 |
Top three noisy pixels from each quadrant. If the there are fewer than three noisy pixels in the level2.evt file, extra rows are filled as -1
| Pixel properties | Quadrant properties | ||||||
|---|---|---|---|---|---|---|---|
| Quadrant | DetID | PixID | Counts | Sigma | Mean | Median | Sigma |
| A | 15 | 239 | 522955 | 1931.91 | 1321 | 1292 | 270.0 |
| A | 0 | 226 | 12544 | 41.67 | 1321 | 1292 | 270.0 |
| A | 12 | 194 | 11589 | 38.13 | 1321 | 1292 | 270.0 |
| B | 12 | 111 | 27415 | 101.84 | 1332 | 1297 | 256.5 |
| B | 0 | 214 | 24350 | 89.89 | 1332 | 1297 | 256.5 |
| B | 11 | 111 | 22051 | 80.93 | 1332 | 1297 | 256.5 |
| C | 9 | 68 | 11633621 | 44401.0 | 1130 | 1135 | 262.0 |
| C | 1 | 16 | 29106 | 106.76 | 1130 | 1135 | 262.0 |
| C | 8 | 128 | 13473 | 47.09 | 1130 | 1135 | 262.0 |
| D | 5 | 233 | 1656084 | 5338.86 | 1254 | 1215 | 310.0 |
| D | 2 | 152 | 1461199 | 4710.13 | 1254 | 1215 | 310.0 |
| D | 2 | 14 | 303420 | 974.96 | 1254 | 1215 | 310.0 |
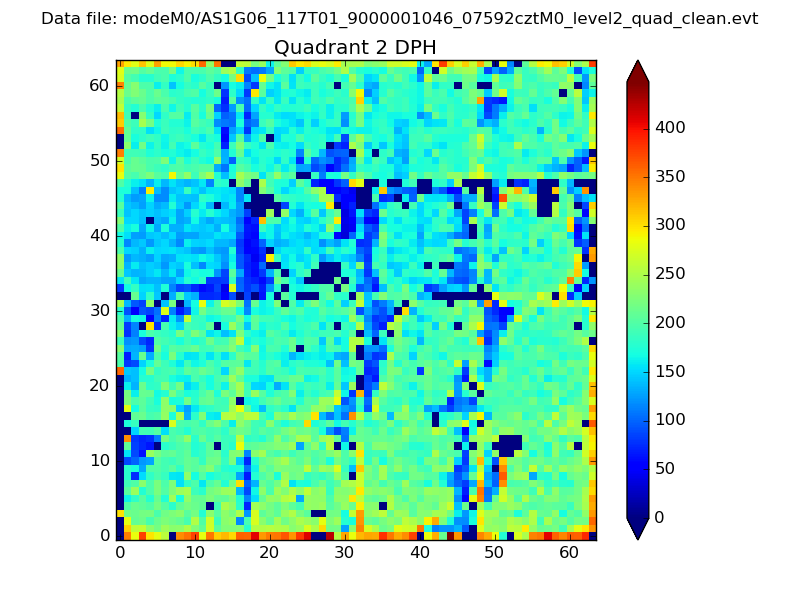
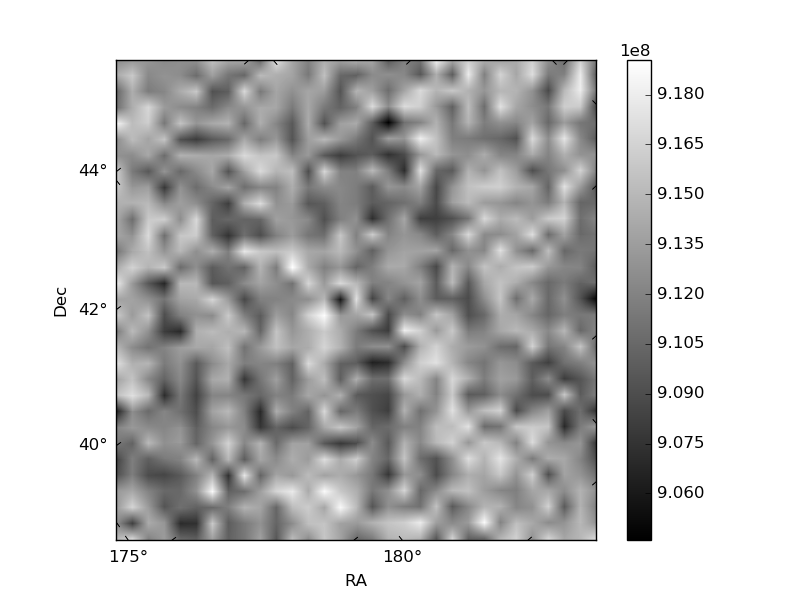
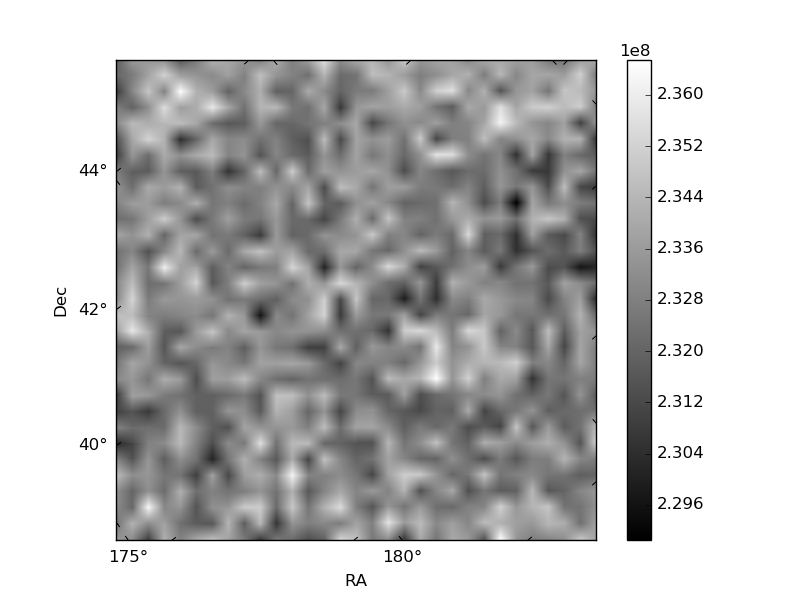
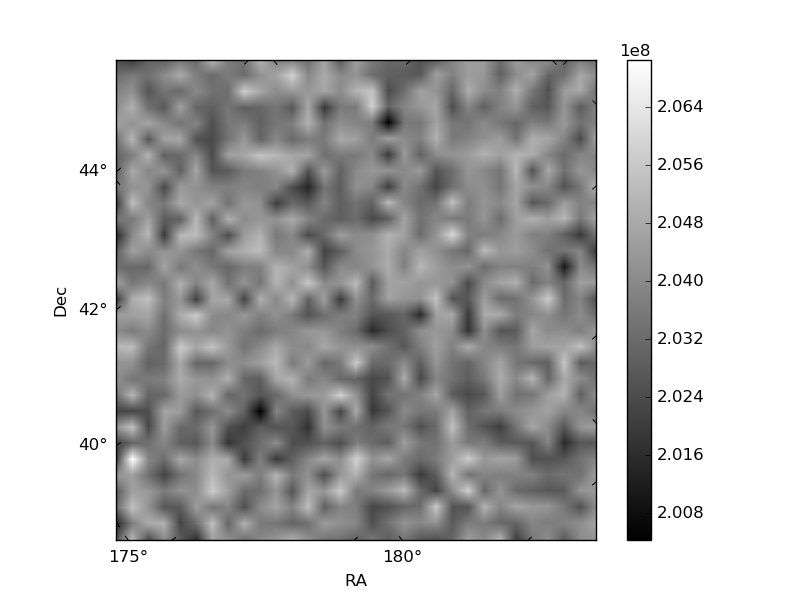
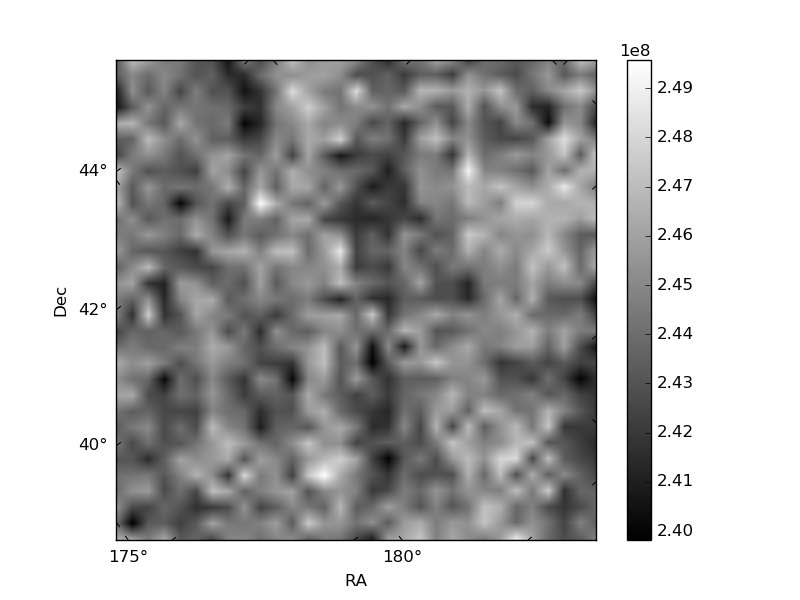
Histogram calculated using DETX and DETY for each event in the final _common_clean file
| Quadrant A | 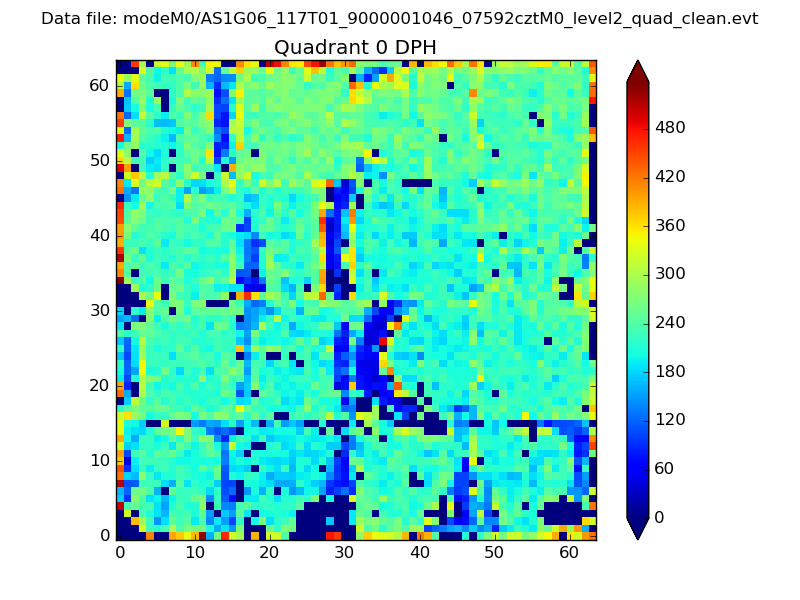 |
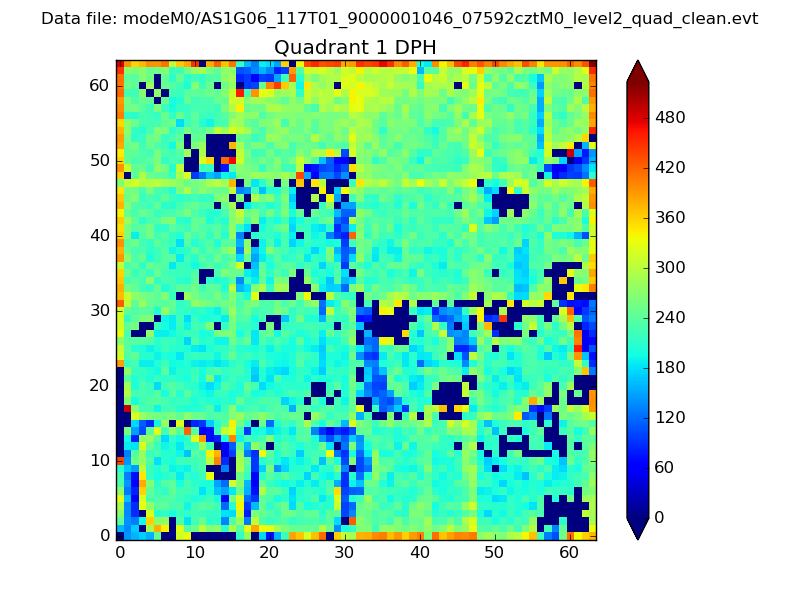 |
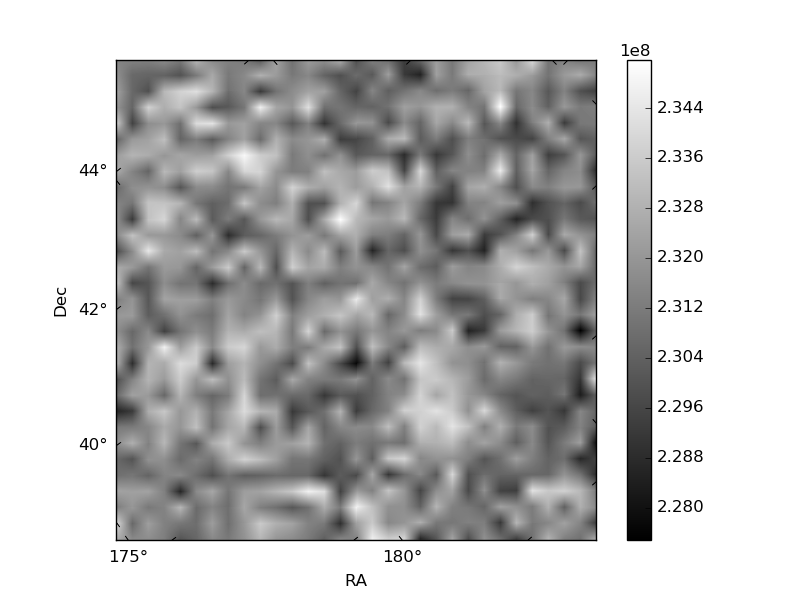
Quadrant B |
|---|---|---|---|
| Quadrant D | 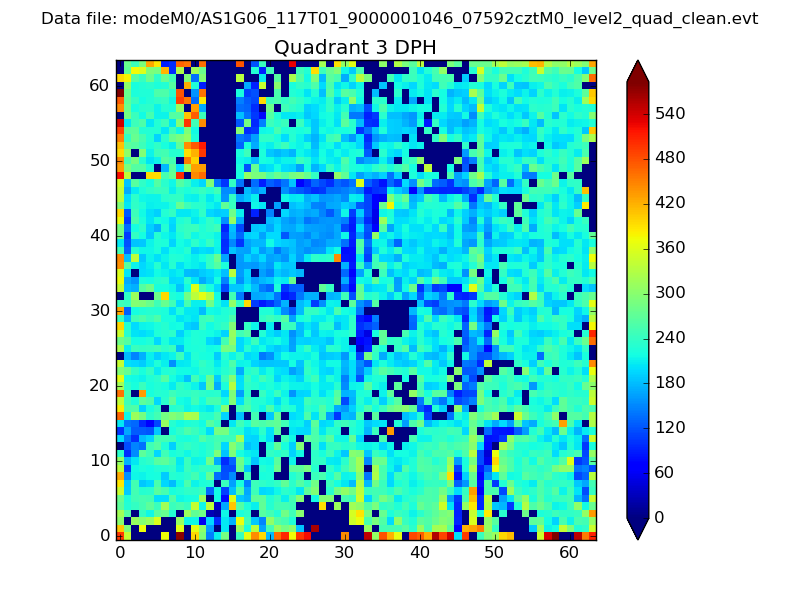 |
 |
Quadrant C |
| Plot type | Count rate plots | Images |
|---|---|---|
| Comparison with Poisson distribution Blue bars denote a histogram of data divided into 1 sec bins. Red curve is a Poisson curve with rate = median count rate of data. |
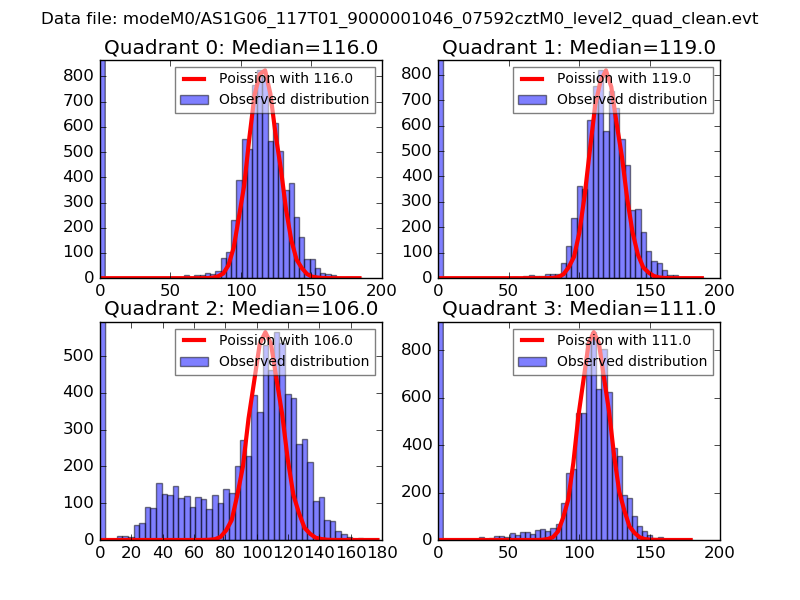 |
 |
| Quadrant-wise count rates Data is divided into 100 sec bins |
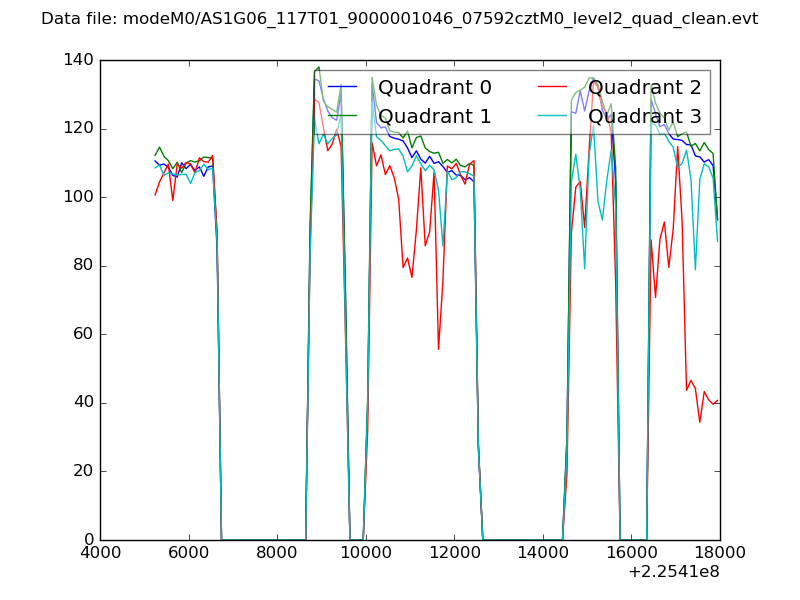 |
|
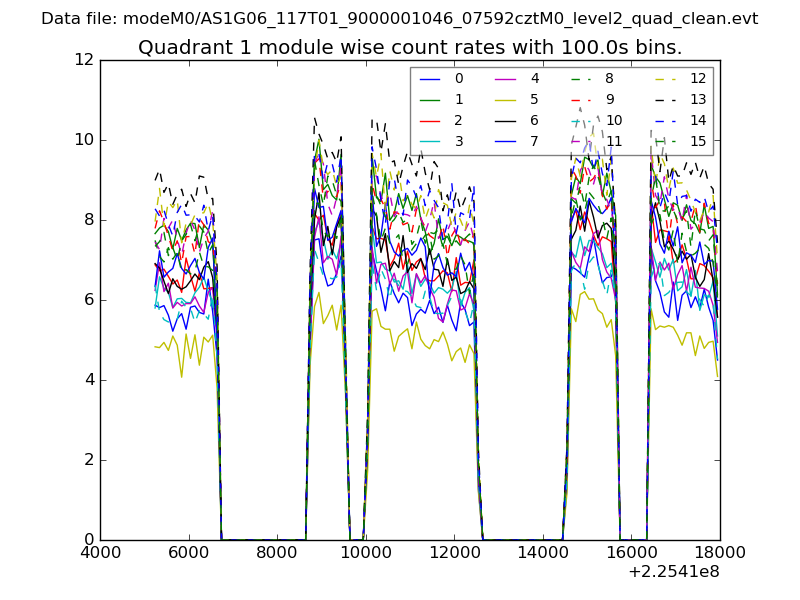
| Module-wise count rates for Quadrant A Data is divided into 100 sec bins |
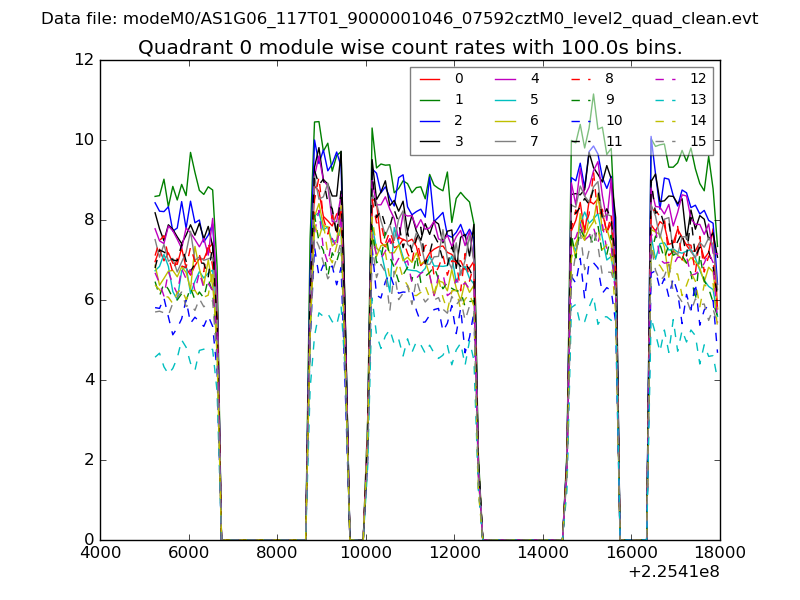 |
 |
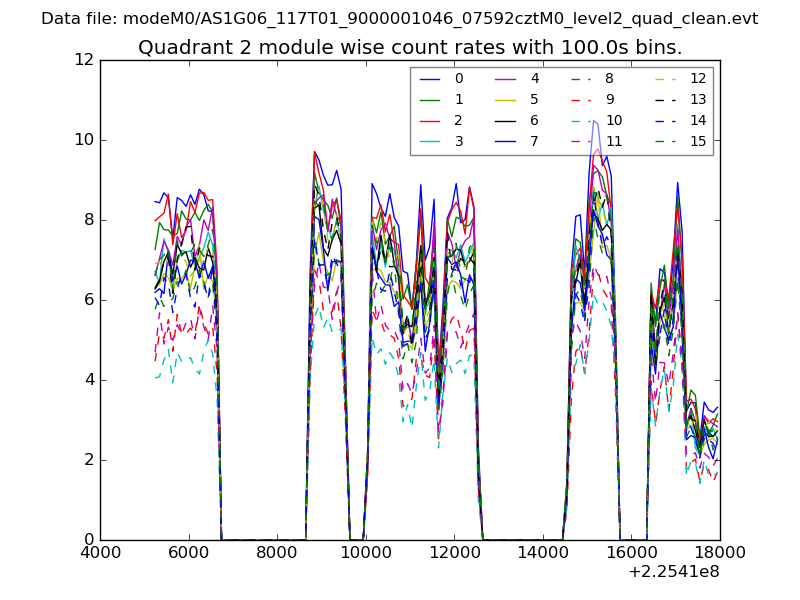
| Module-wise count rates for Quadrant B Data is divided into 100 sec bins |
 |
 |
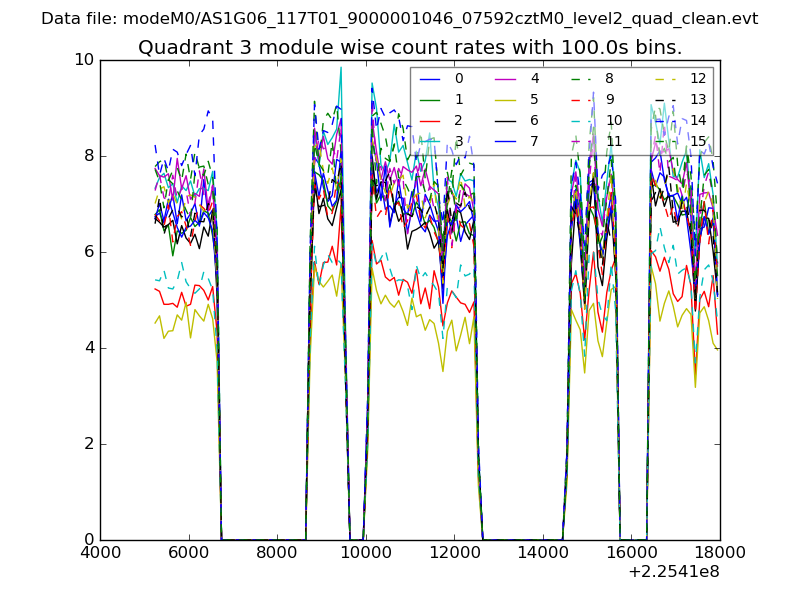
| Module-wise count rates for Quadrant C Data is divided into 100 sec bins |
 |
 |
| Module-wise count rates for Quadrant D Data is divided into 100 sec bins |
 |
 |
| Parameter | Plot |
|---|---|
| CZT HV Monitor | 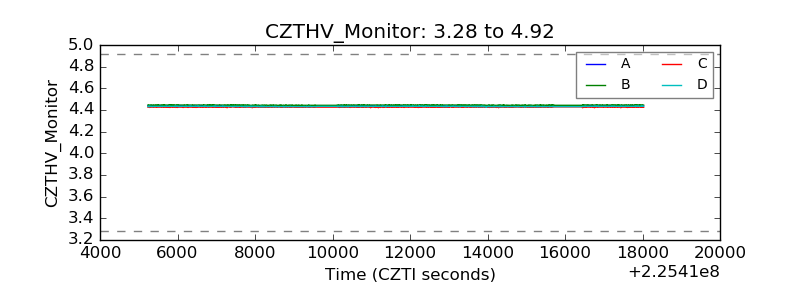 |
| D_VDD |  |
| Temperature 1 | 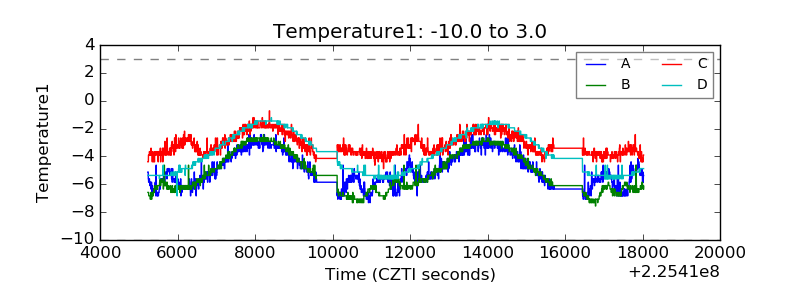 |
| Veto HV Monitor | 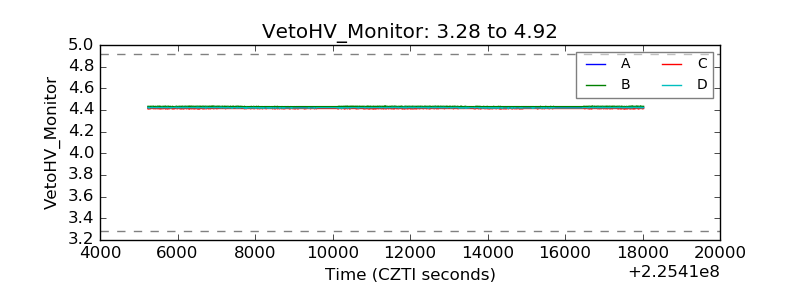 |
| Veto LLD | 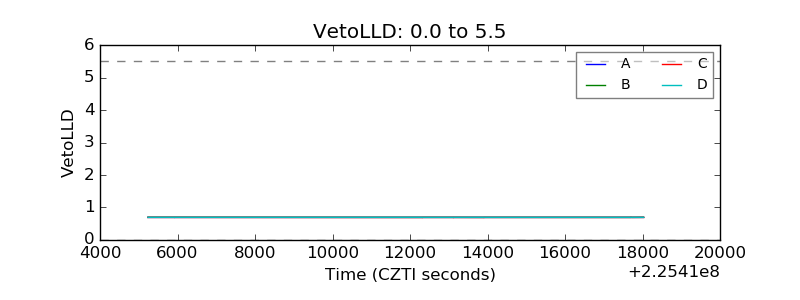 |
| Alpha Counter | 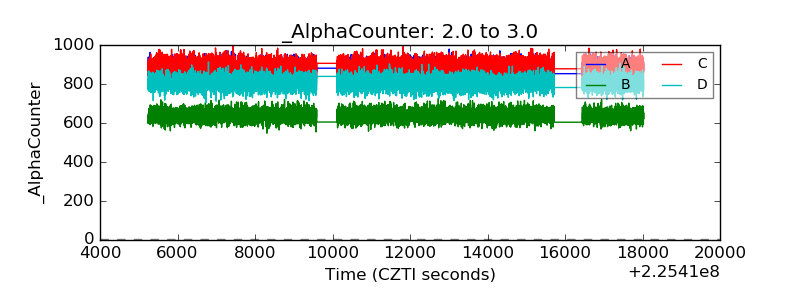 |
| _CPM_Rate | 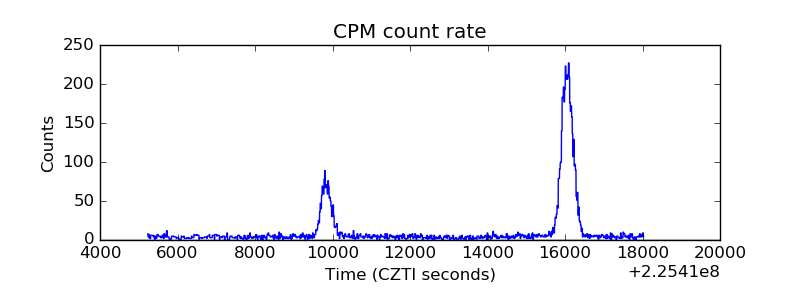 |
| CZT Counter | 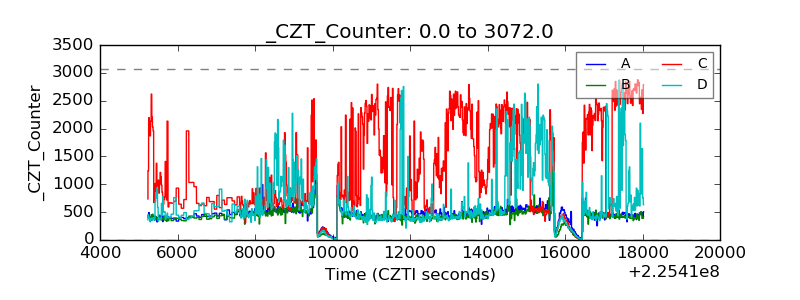 |
| +2.5 Volts monitor |  |
| +5 Volts monitor |  |
| _ROLL_ROT | 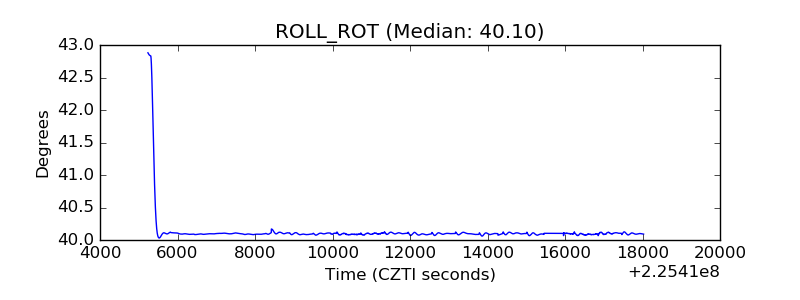 |
| _Roll_DEC |  |
| _Roll_RA | 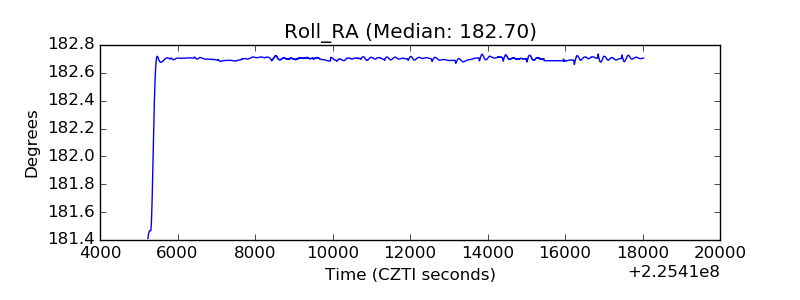 |
| Veto Counter | 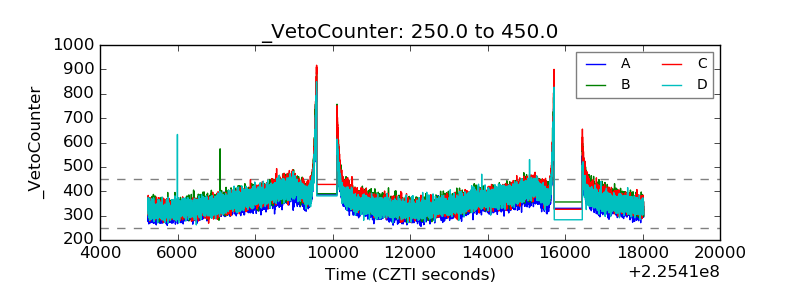 |