| Param | Original file | Final file |
|---|---|---|
| Filename | modeM0/AS1G06_117T01_9000001046_07594cztM0_level2.evt | modeM0/AS1G06_117T01_9000001046_07594cztM0_level2_quad_clean.evt |
| Size (bytes) | 700,845,120 | 74,862,720 |
| Size | 668.4 MB | 71.4 MB |
| Events in quadrant A | 3,625,915 | 471,829 |
| Events in quadrant B | 2,868,365 | 486,296 |
| Events in quadrant C | 10,057,498 | 419,278 |
| Events in quadrant D | 4,253,564 | 454,273 |
| Mode SS | |||
|---|---|---|---|
| Quadrant | BADHDUFLAG | Total packets | Discarded packets |
| A | 0 | 128 | 0 |
| B | 0 | 128 | 0 |
| C | 0 | 128 | 0 |
| D | 0 | 128 | 0 |
| Mode M0 | |||
|---|---|---|---|
| Quadrant | BADHDUFLAG | Total packets | Discarded packets |
| A | 0 | 14497 | 2 |
| B | 0 | 12662 | 1 |
| C | 0 | 34241 | 1 |
| D | 0 | 16886 | 1 |
| Mode M9 | |||
|---|---|---|---|
| Quadrant | BADHDUFLAG | Total packets | Discarded packets |
| A | 0 | 10 | 0 |
| B | 0 | 10 | 0 |
| C | 0 | 10 | 0 |
| D | 0 | 10 | 0 |
| Quadrant | Total seconds | Saturated seconds | Saturation percentage |
|---|---|---|---|
| A | 6220 | 156 | 2.508039% |
| B | 6220 | 58 | 0.932476% |
| C | 6220 | 1373 | 22.073955% |
| D | 6220 | 277 | 4.453376% |
Noise dominated data is calculated using 1-second bins in cleaned event files. If a bin has >2000 counts, and if more than 50% of those come from <1% of pixels, then it is considered to be noise-dominated and hence unusable.
| Quadrant | # 1 sec bins | Bins with >0 counts | Bins with >2000 counts | High rate bins dominated by noise | Noise dominated (total time) | Noise dominated (detector-on time) | Marked lightcurve |
|---|---|---|---|---|---|---|---|
| A | 7245 | 6220 | 86 | 86 | 1.19% | 1.38% | 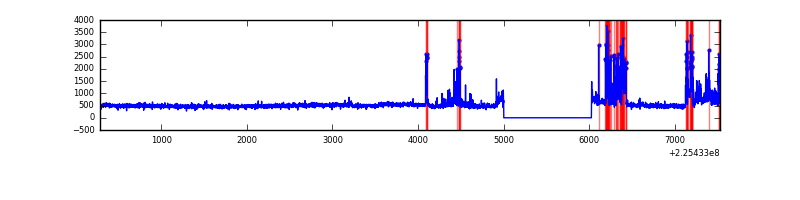 |
| B | 7245 | 6221 | 2 | 2 | 0.03% | 0.03% | 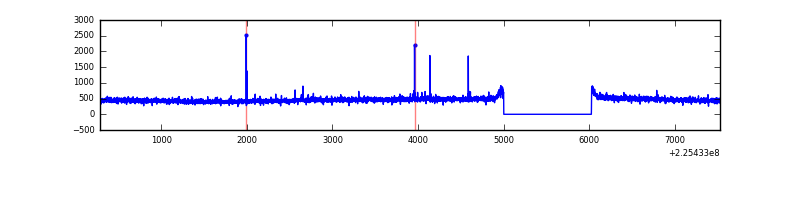 |
| C | 7245 | 6221 | 1384 | 1384 | 19.10% | 22.25% | 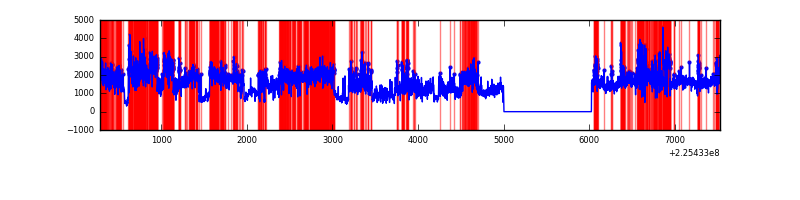 |
| D | 7245 | 6220 | 194 | 194 | 2.68% | 3.12% | 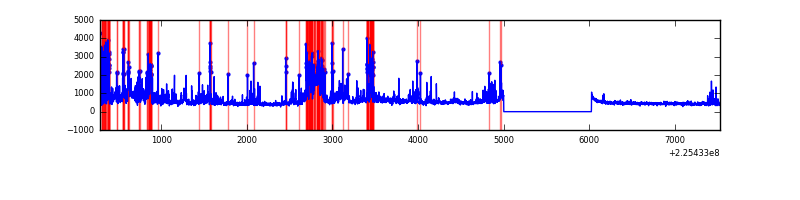 |
Top three noisy pixels from each quadrant. If the there are fewer than three noisy pixels in the level2.evt file, extra rows are filled as -1
| Pixel properties | Quadrant properties | ||||||
|---|---|---|---|---|---|---|---|
| Quadrant | DetID | PixID | Counts | Sigma | Mean | Median | Sigma |
| A | 15 | 239 | 817603 | 5463.54 | 729 | 713 | 149.5 |
| A | 0 | 226 | 6984 | 41.94 | 729 | 713 | 149.5 |
| A | 12 | 194 | 6506 | 38.74 | 729 | 713 | 149.5 |
| B | 12 | 111 | 15386 | 103.17 | 734 | 715 | 142.2 |
| B | 11 | 111 | 12025 | 79.54 | 734 | 715 | 142.2 |
| B | 0 | 213 | 8832 | 57.08 | 734 | 715 | 142.2 |
| C | 9 | 68 | 7069067 | 46129.65 | 662 | 665 | 153.2 |
| C | 8 | 229 | 397956 | 2592.79 | 662 | 665 | 153.2 |
| C | 13 | 61 | 4985 | 28.19 | 662 | 665 | 153.2 |
| D | 5 | 233 | 1204189 | 6928.1 | 700 | 678 | 173.7 |
| D | 2 | 152 | 242481 | 1391.96 | 700 | 678 | 173.7 |
| D | 2 | 14 | 118658 | 679.16 | 700 | 678 | 173.7 |
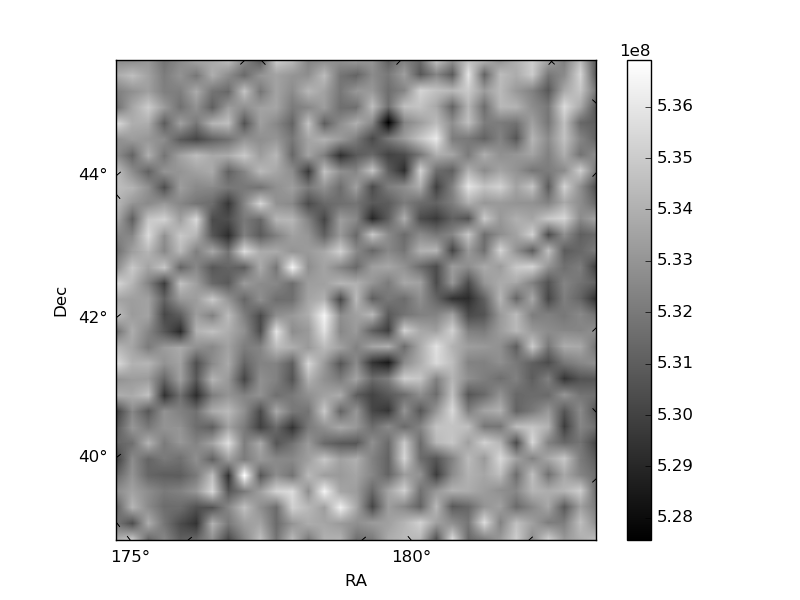
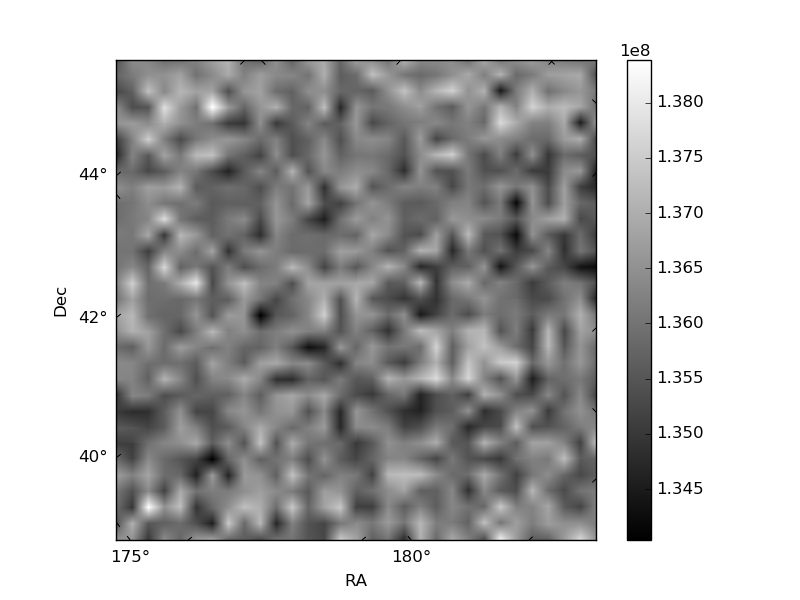
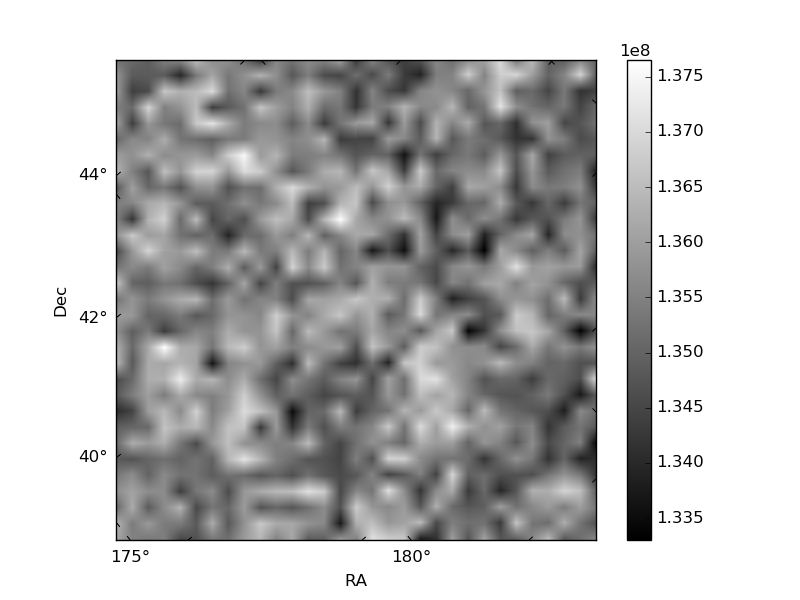
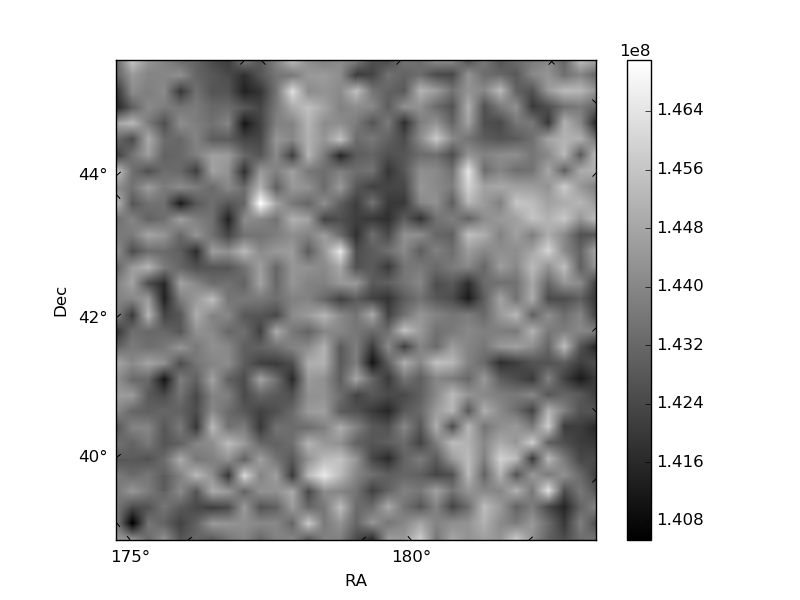
Histogram calculated using DETX and DETY for each event in the final _common_clean file
| Quadrant A | 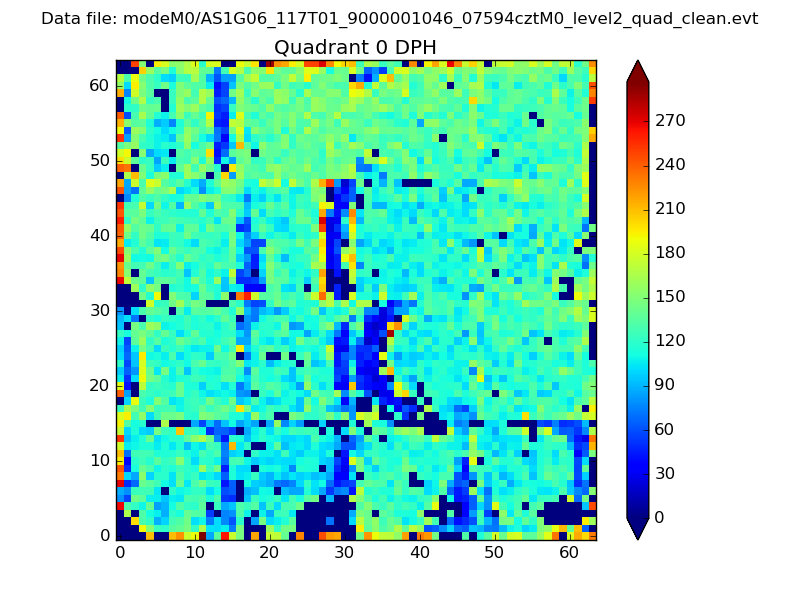 |
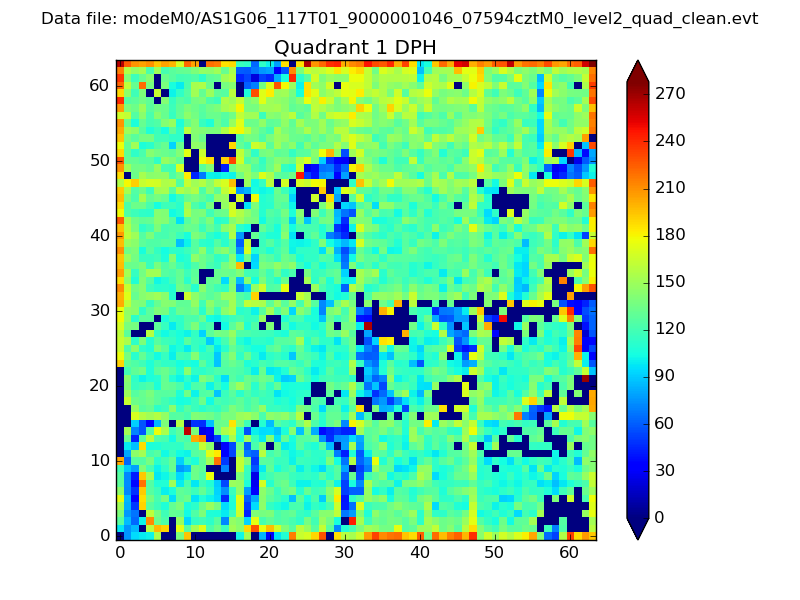 |
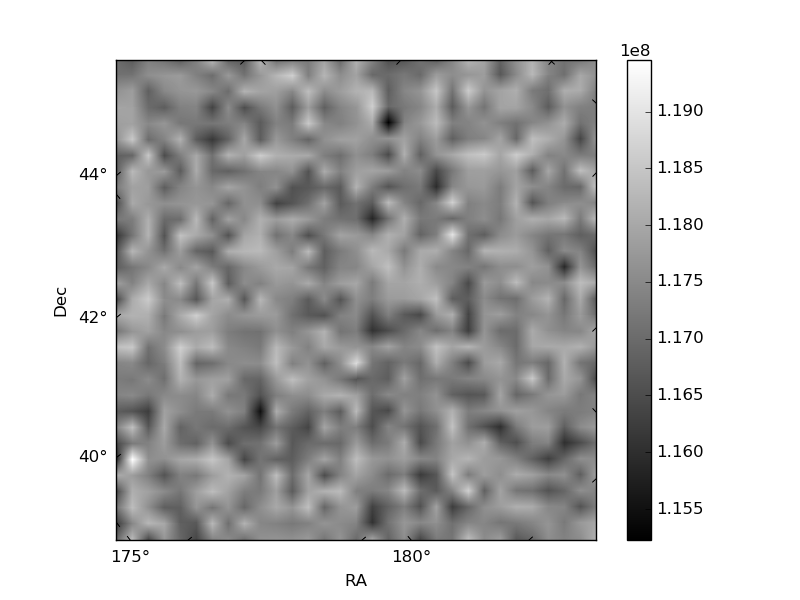
Quadrant B |
|---|---|---|---|
| Quadrant D | 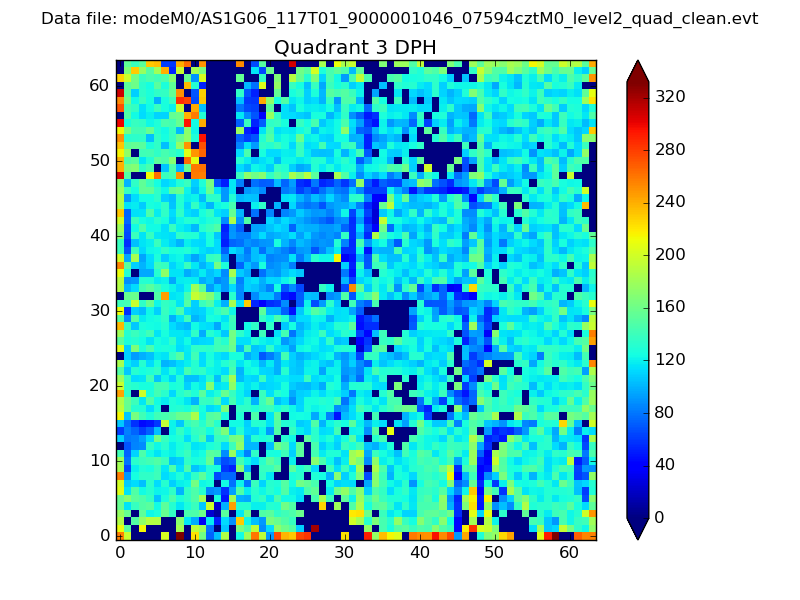 |
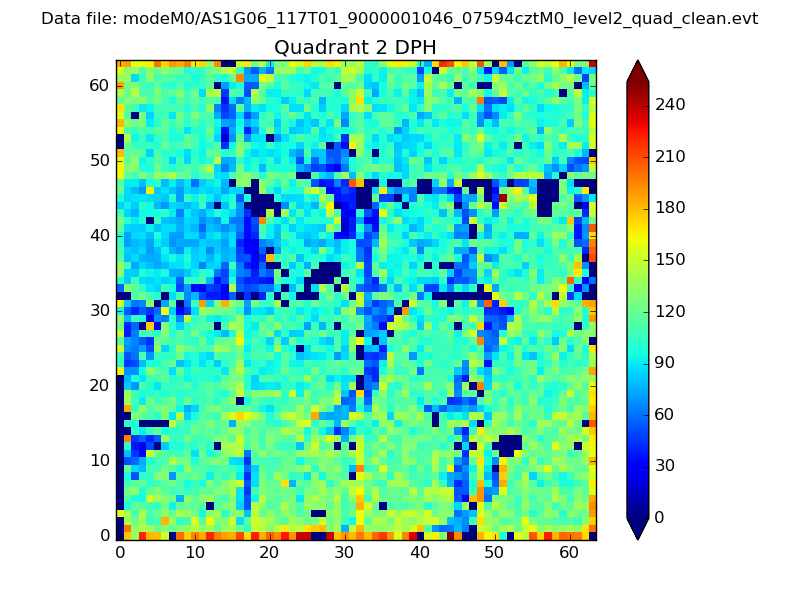 |
Quadrant C |
| Plot type | Count rate plots | Images |
|---|---|---|
| Comparison with Poisson distribution Blue bars denote a histogram of data divided into 1 sec bins. Red curve is a Poisson curve with rate = median count rate of data. |
 |
 |
| Quadrant-wise count rates Data is divided into 100 sec bins |
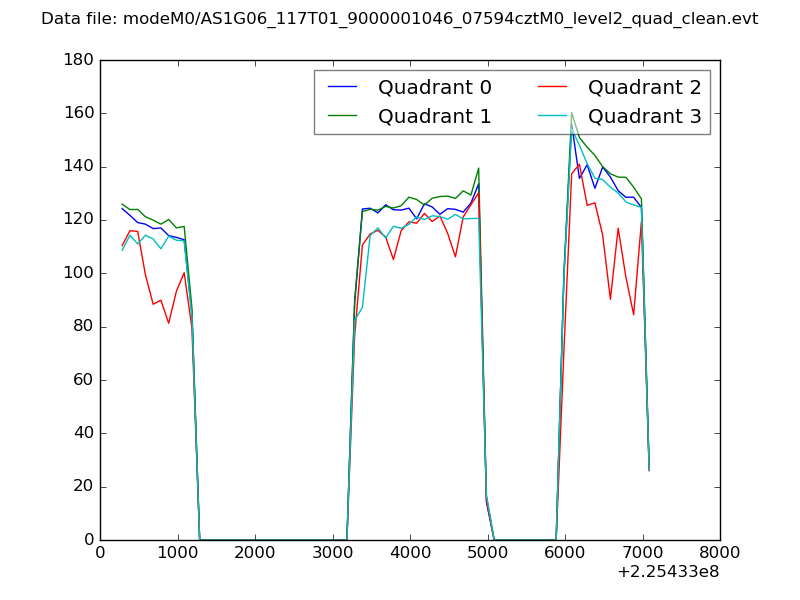 |
|
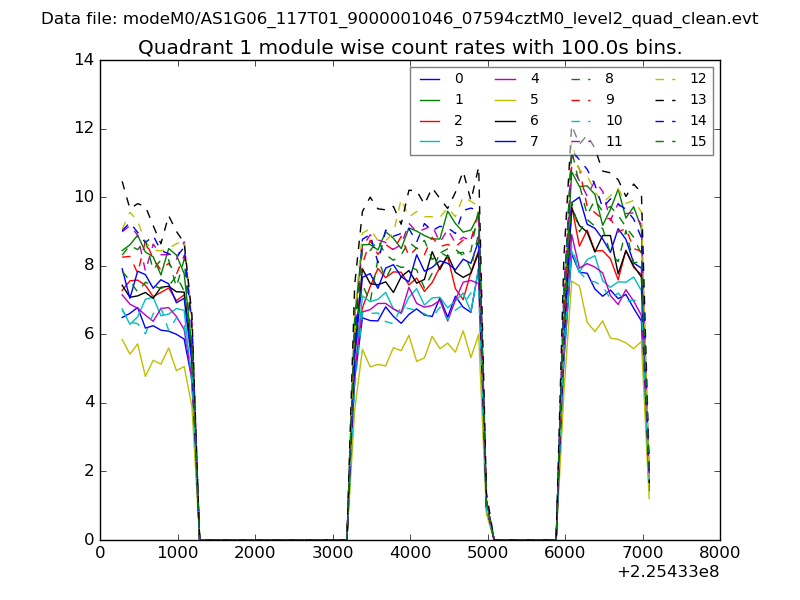
| Module-wise count rates for Quadrant A Data is divided into 100 sec bins |
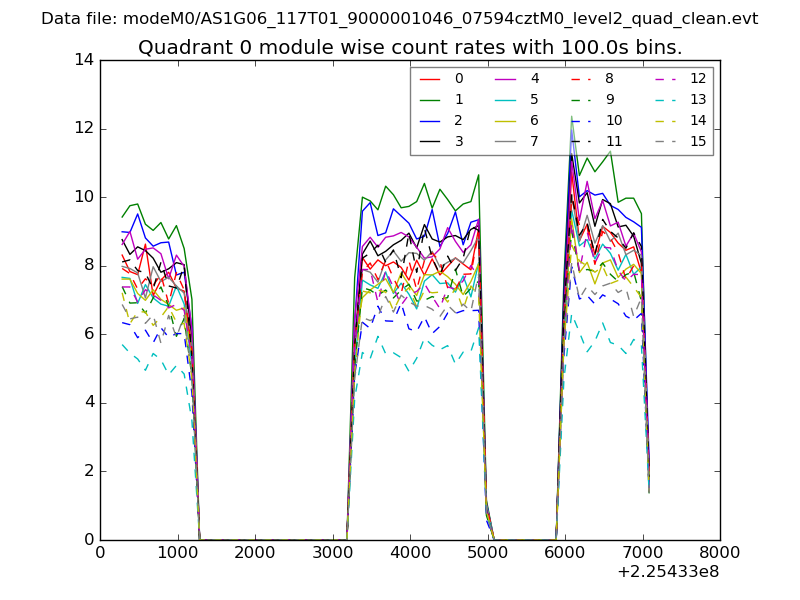 |
 |
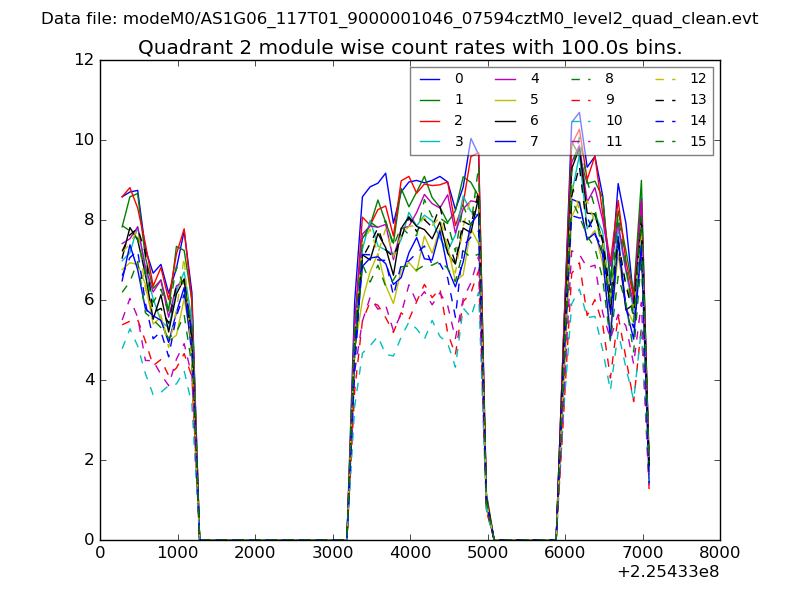
| Module-wise count rates for Quadrant B Data is divided into 100 sec bins |
 |
 |
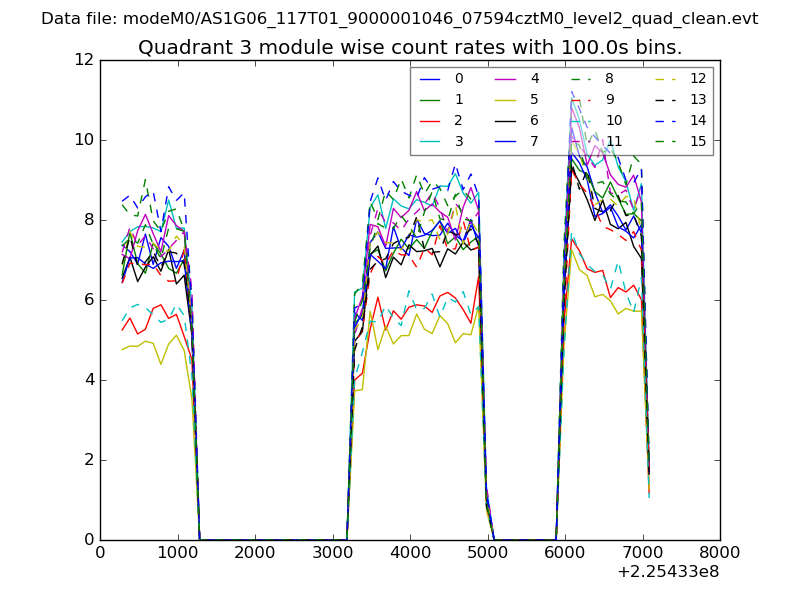
| Module-wise count rates for Quadrant C Data is divided into 100 sec bins |
 |
 |
| Module-wise count rates for Quadrant D Data is divided into 100 sec bins |
 |
 |
| Parameter | Plot |
|---|---|
| CZT HV Monitor | 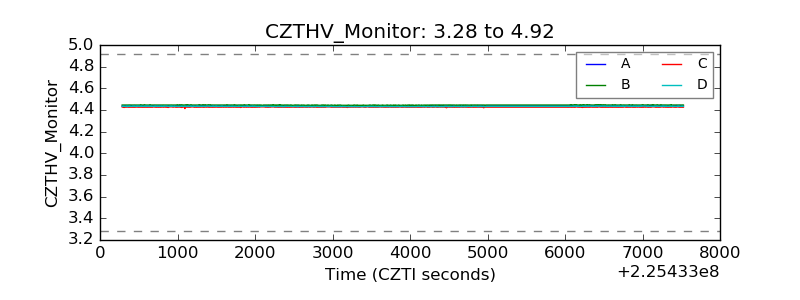 |
| D_VDD | 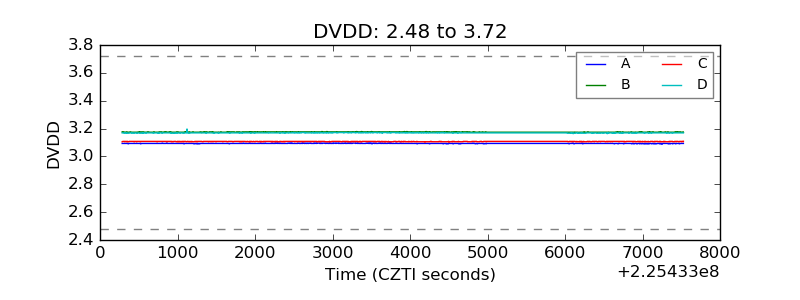 |
| Temperature 1 | 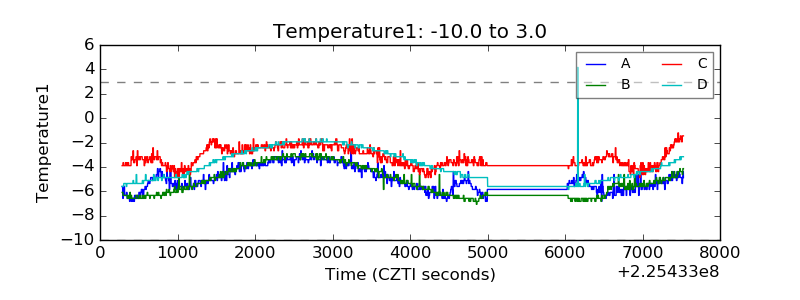 |
| Veto HV Monitor | 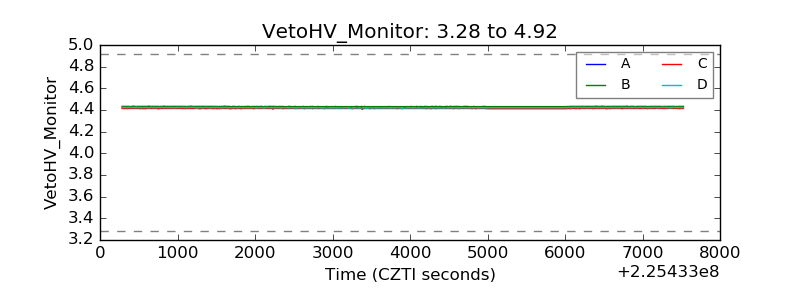 |
| Veto LLD |  |
| Alpha Counter | 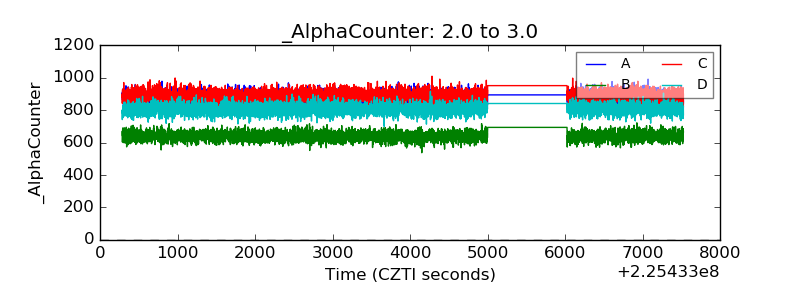 |
| _CPM_Rate | 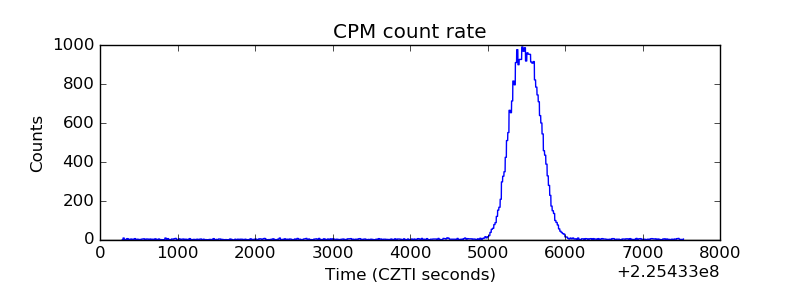 |
| CZT Counter | 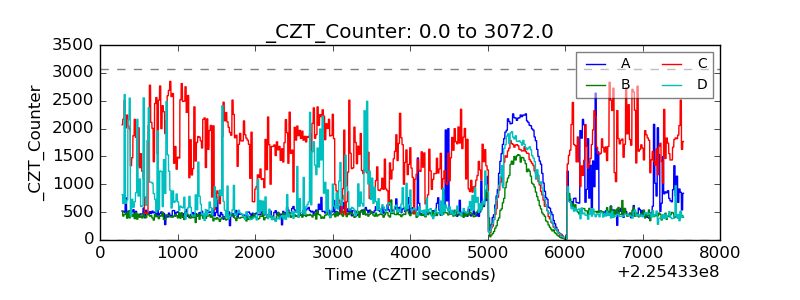 |
| +2.5 Volts monitor |  |
| +5 Volts monitor | 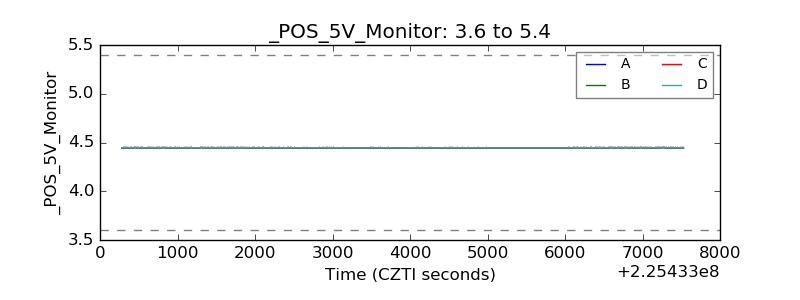 |
| _ROLL_ROT | 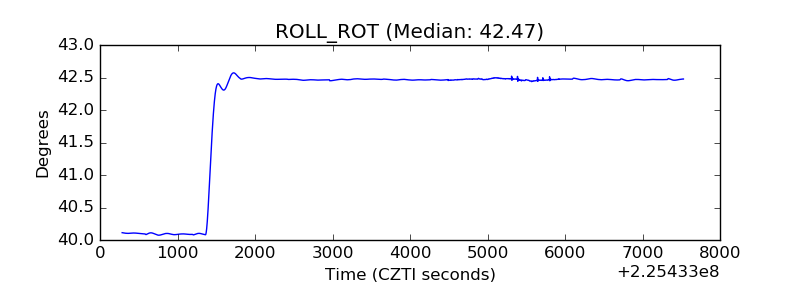 |
| _Roll_DEC |  |
| _Roll_RA | 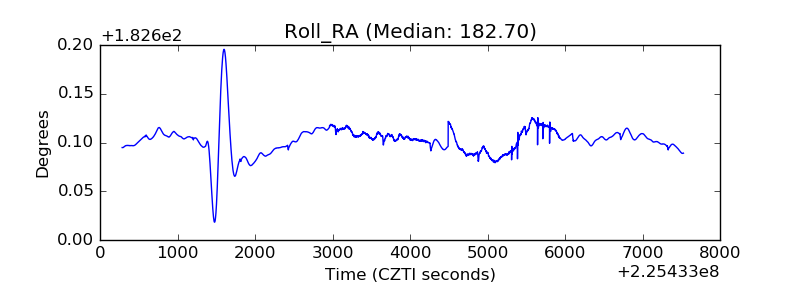 |
| Veto Counter | 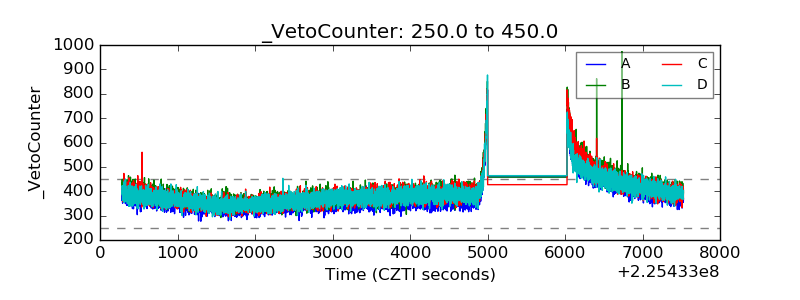 |