| Param | Original file | Final file |
|---|---|---|
| Filename | modeM0/AS1G06_117T01_9000001046_07596cztM0_level2.evt | modeM0/AS1G06_117T01_9000001046_07596cztM0_level2_quad_clean.evt |
| Size (bytes) | 750,072,960 | 72,901,440 |
| Size | 715.3 MB | 69.5 MB |
| Events in quadrant A | 4,506,155 | 462,839 |
| Events in quadrant B | 3,058,979 | 476,818 |
| Events in quadrant C | 11,284,815 | 368,503 |
| Events in quadrant D | 3,431,582 | 449,617 |
| Mode SS | |||
|---|---|---|---|
| Quadrant | BADHDUFLAG | Total packets | Discarded packets |
| A | 0 | 130 | 0 |
| B | 0 | 130 | 0 |
| C | 0 | 130 | 0 |
| D | 0 | 130 | 0 |
| Mode M0 | |||
|---|---|---|---|
| Quadrant | BADHDUFLAG | Total packets | Discarded packets |
| A | 0 | 17611 | 2 |
| B | 0 | 13123 | 1 |
| C | 0 | 37976 | 1 |
| D | 0 | 14574 | 1 |
| Mode M9 | |||
|---|---|---|---|
| Quadrant | BADHDUFLAG | Total packets | Discarded packets |
| A | 0 | 12 | 0 |
| B | 0 | 12 | 0 |
| C | 0 | 12 | 0 |
| D | 0 | 12 | 0 |
| Quadrant | Total seconds | Saturated seconds | Saturation percentage |
|---|---|---|---|
| A | 6435 | 182 | 2.828283% |
| B | 6435 | 14 | 0.217560% |
| C | 6435 | 2736 | 42.517483% |
| D | 6435 | 68 | 1.056721% |
Noise dominated data is calculated using 1-second bins in cleaned event files. If a bin has >2000 counts, and if more than 50% of those come from <1% of pixels, then it is considered to be noise-dominated and hence unusable.
| Quadrant | # 1 sec bins | Bins with >0 counts | Bins with >2000 counts | High rate bins dominated by noise | Noise dominated (total time) | Noise dominated (detector-on time) | Marked lightcurve |
|---|---|---|---|---|---|---|---|
| A | 7655 | 6436 | 137 | 137 | 1.79% | 2.13% | 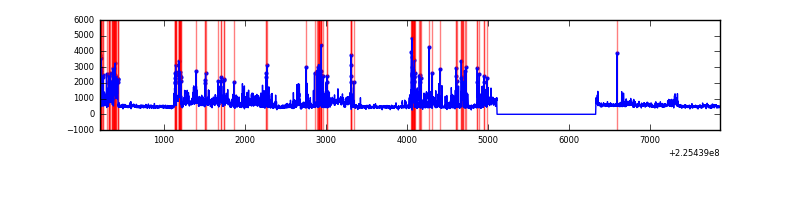 |
| B | 7655 | 6436 | 0 | 0 | 0.00% | 0.00% | 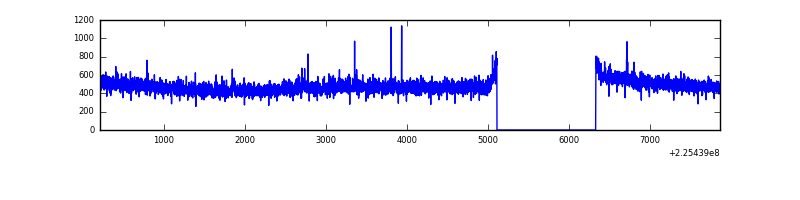 |
| C | 7655 | 6435 | 2290 | 2290 | 29.92% | 35.59% | 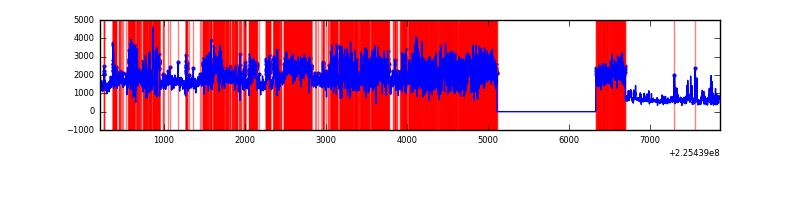 |
| D | 7655 | 6436 | 49 | 49 | 0.64% | 0.76% | 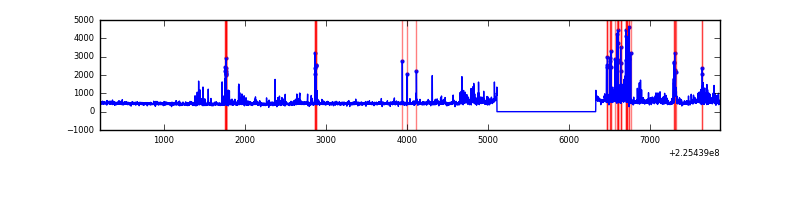 |
Top three noisy pixels from each quadrant. If the there are fewer than three noisy pixels in the level2.evt file, extra rows are filled as -1
| Pixel properties | Quadrant properties | ||||||
|---|---|---|---|---|---|---|---|
| Quadrant | DetID | PixID | Counts | Sigma | Mean | Median | Sigma |
| A | 15 | 239 | 1509365 | 9580.97 | 778 | 765 | 157.5 |
| A | 0 | 226 | 7564 | 43.18 | 778 | 765 | 157.5 |
| A | 12 | 194 | 6755 | 38.04 | 778 | 765 | 157.5 |
| B | 12 | 111 | 15769 | 100.25 | 784 | 766 | 149.7 |
| B | 11 | 111 | 12716 | 79.85 | 784 | 766 | 149.7 |
| B | 0 | 214 | 12689 | 79.67 | 784 | 766 | 149.7 |
| C | 9 | 68 | 8393918 | 55701.91 | 658 | 661 | 150.7 |
| C | 8 | 229 | 290619 | 1924.31 | 658 | 661 | 150.7 |
| C | 1 | 16 | 24485 | 158.11 | 658 | 661 | 150.7 |
| D | 2 | 152 | 338715 | 1845.83 | 754 | 730 | 183.1 |
| D | 5 | 233 | 118808 | 644.86 | 754 | 730 | 183.1 |
| D | 2 | 14 | 73327 | 396.47 | 754 | 730 | 183.1 |
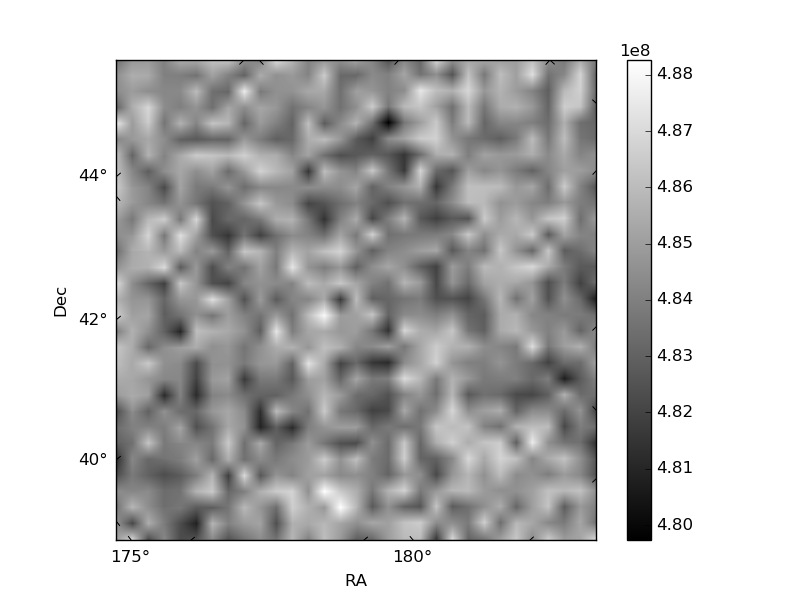
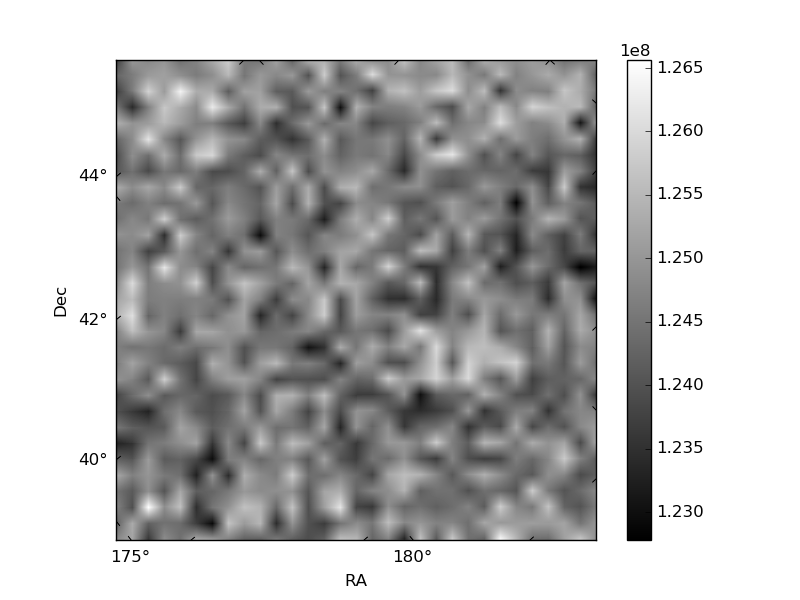
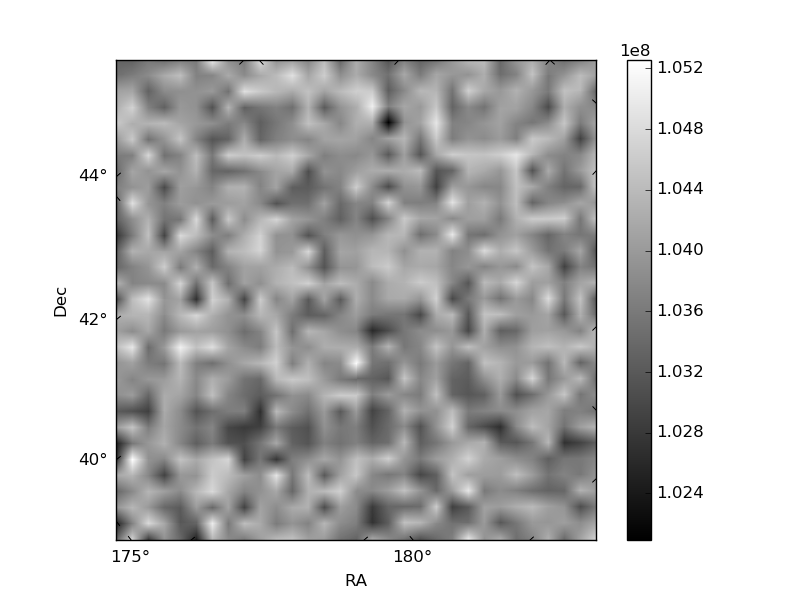
Histogram calculated using DETX and DETY for each event in the final _common_clean file
| Quadrant A | 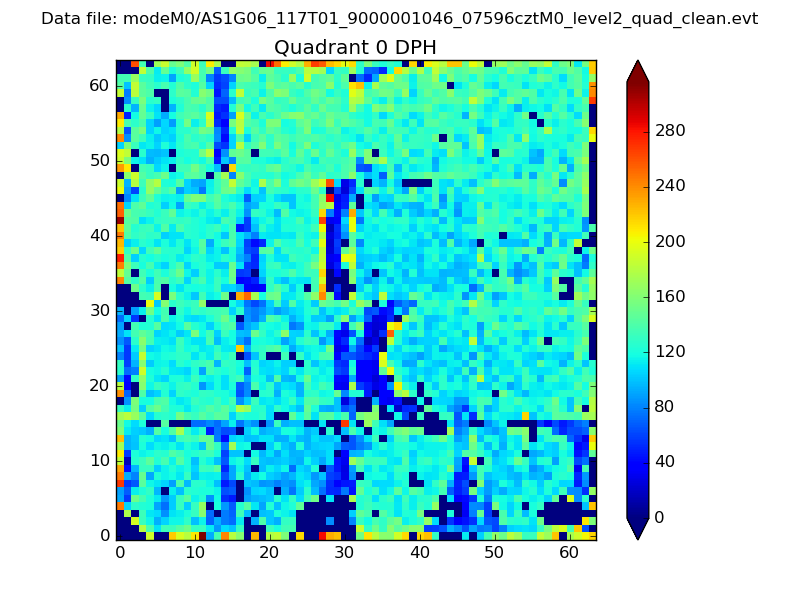 |
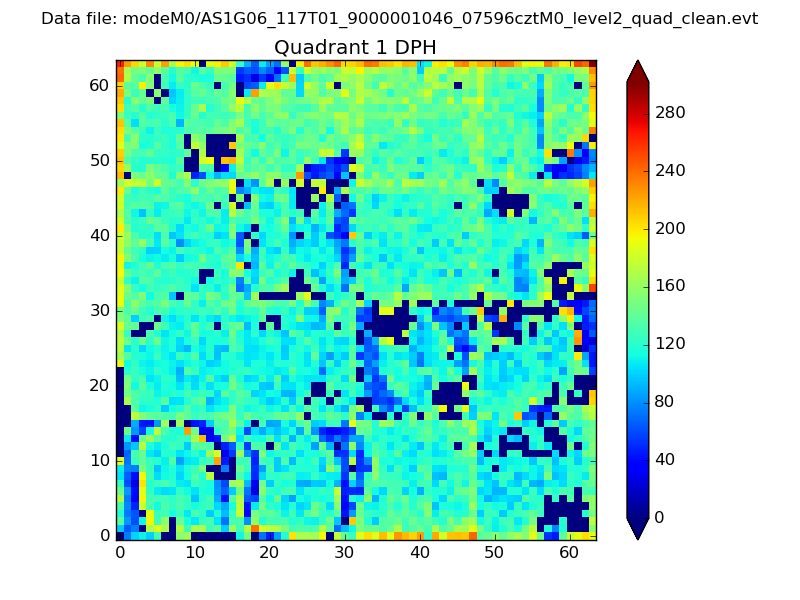 |
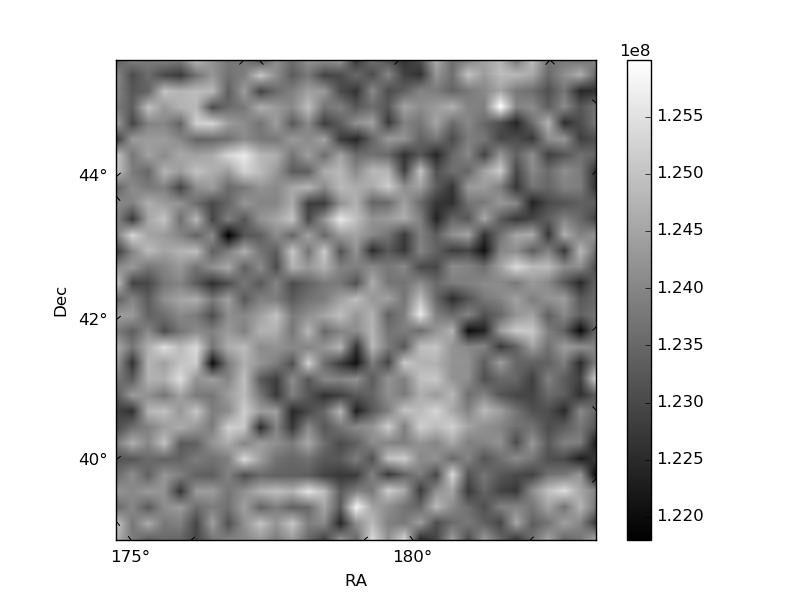
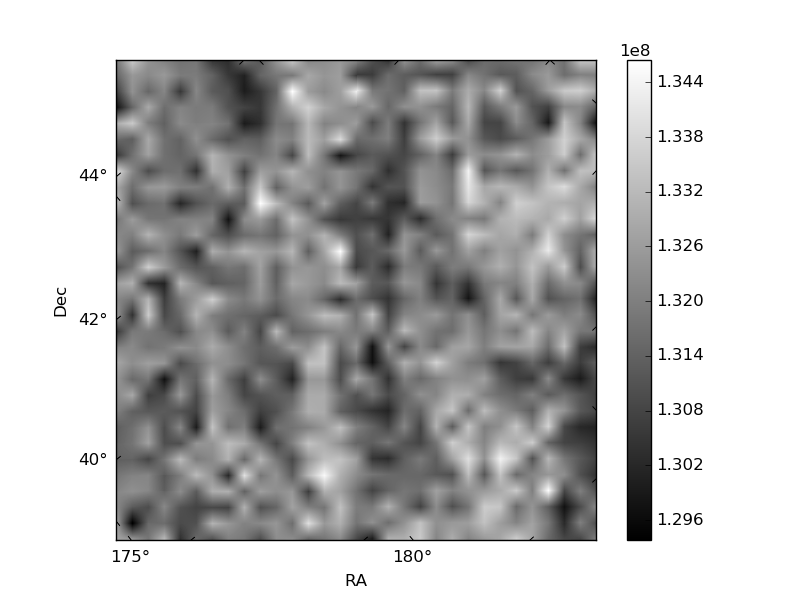
Quadrant B |
|---|---|---|---|
| Quadrant D | 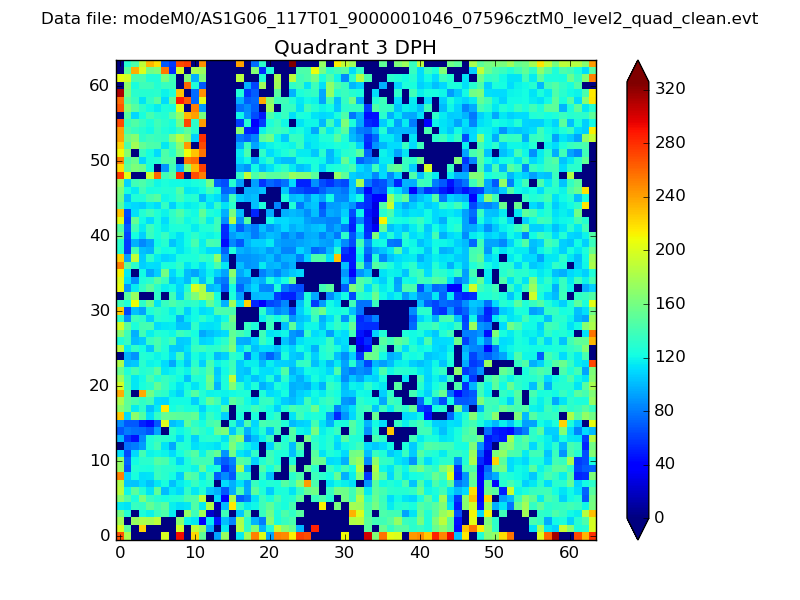 |
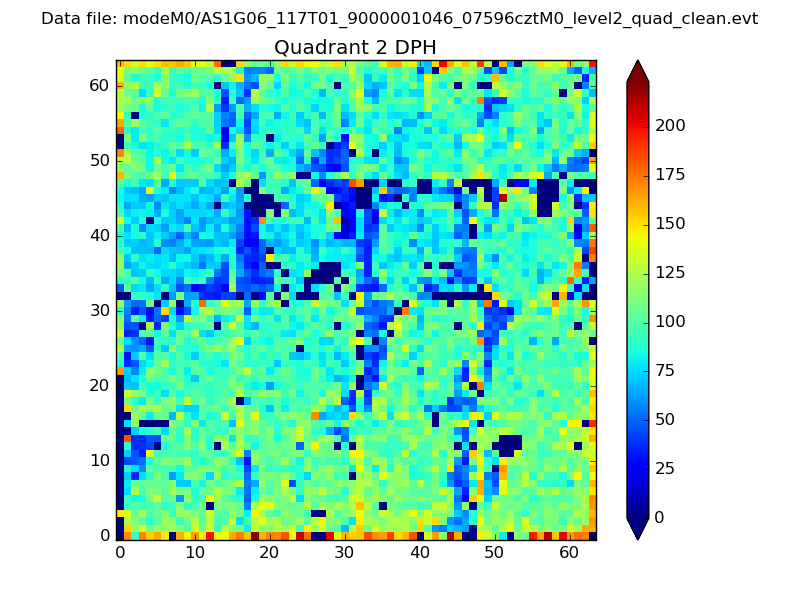 |
Quadrant C |
| Plot type | Count rate plots | Images |
|---|---|---|
| Comparison with Poisson distribution Blue bars denote a histogram of data divided into 1 sec bins. Red curve is a Poisson curve with rate = median count rate of data. |
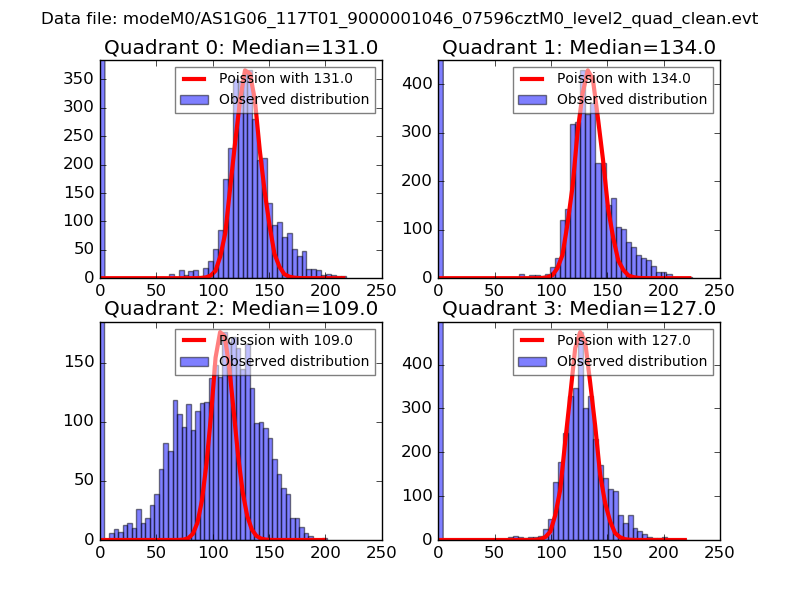 |
 |
| Quadrant-wise count rates Data is divided into 100 sec bins |
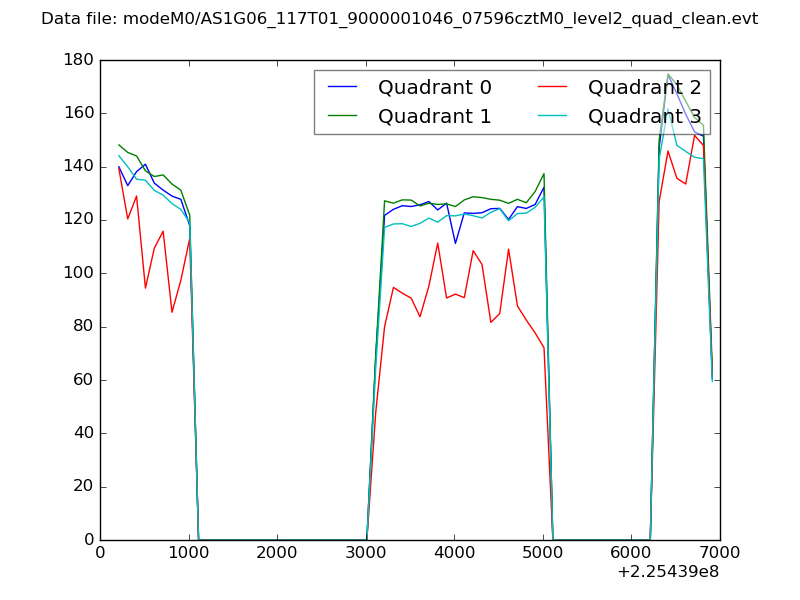 |
|
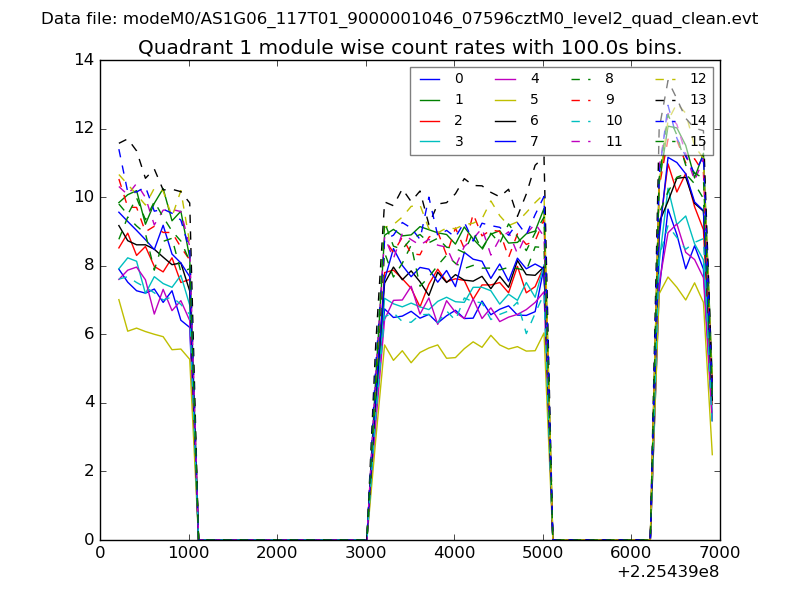
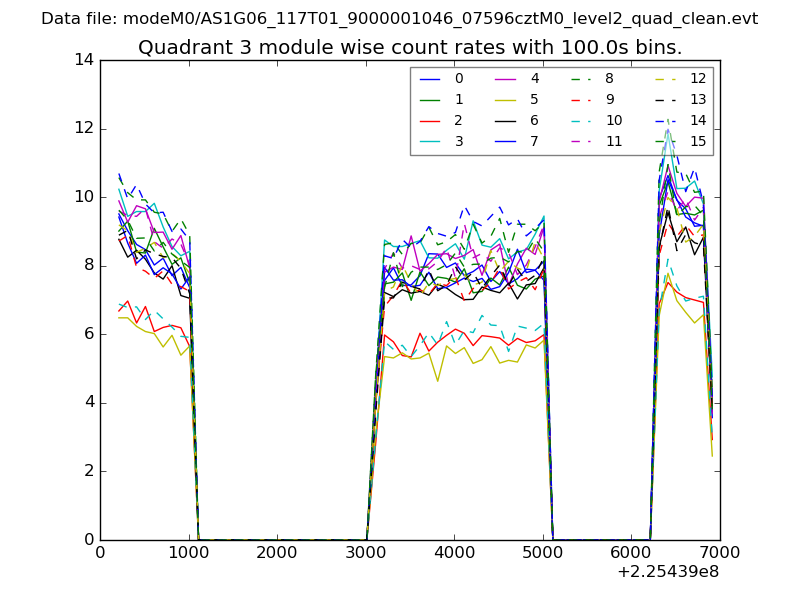
| Module-wise count rates for Quadrant A Data is divided into 100 sec bins |
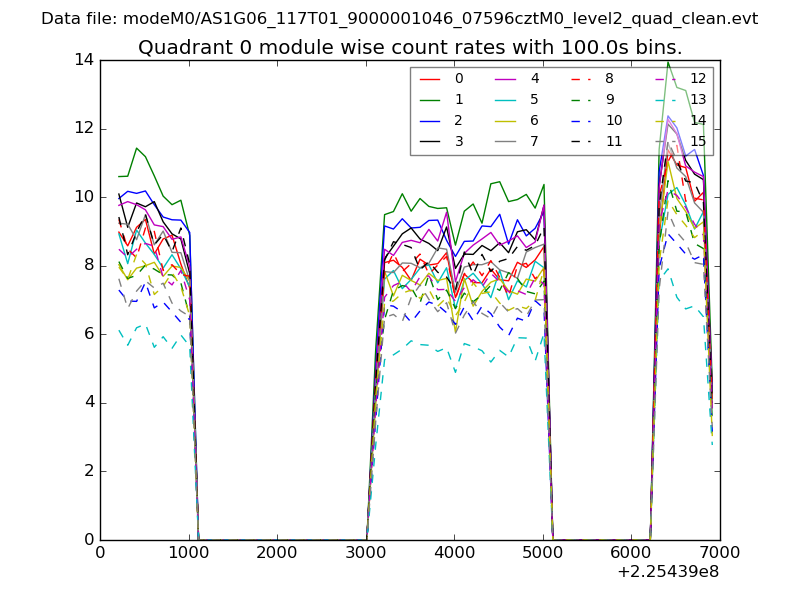 |
 |
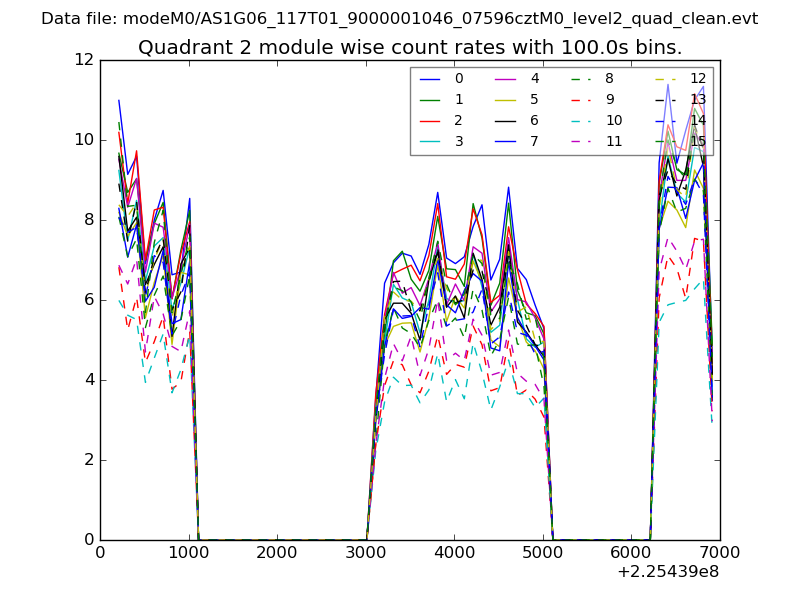
| Module-wise count rates for Quadrant B Data is divided into 100 sec bins |
 |
 |
| Module-wise count rates for Quadrant C Data is divided into 100 sec bins |
 |
 |
| Module-wise count rates for Quadrant D Data is divided into 100 sec bins |
 |
 |
| Parameter | Plot |
|---|---|
| CZT HV Monitor | 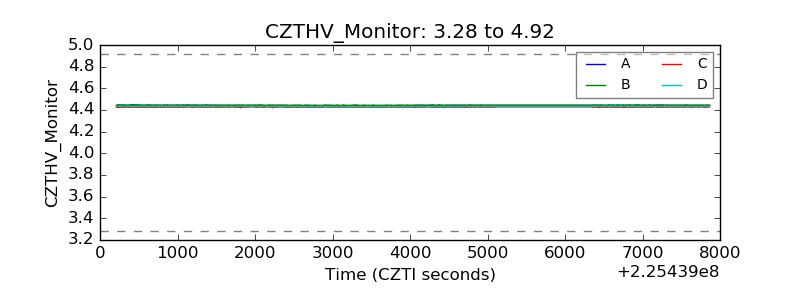 |
| D_VDD | 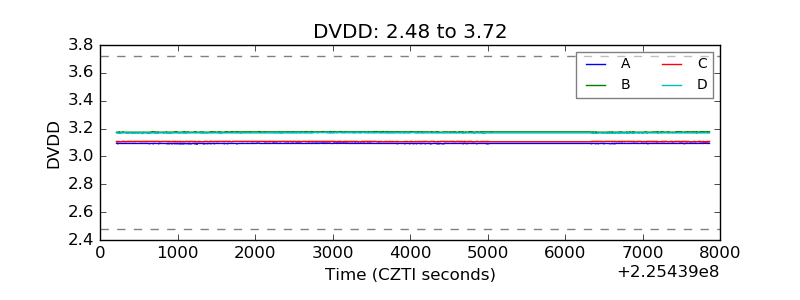 |
| Temperature 1 | 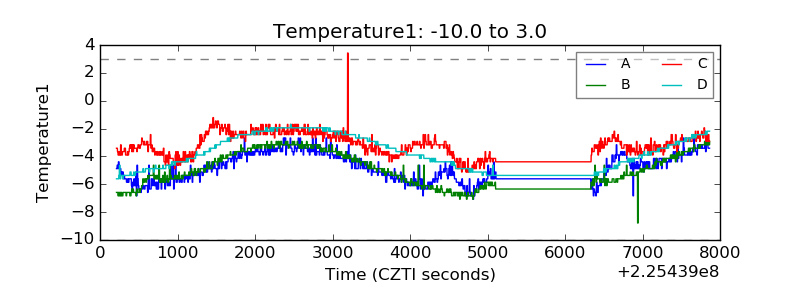 |
| Veto HV Monitor | 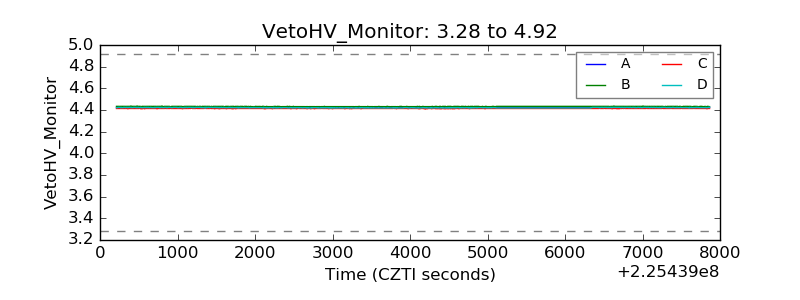 |
| Veto LLD | 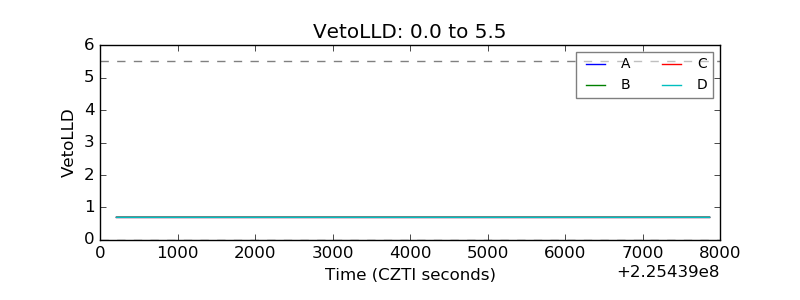 |
| Alpha Counter | 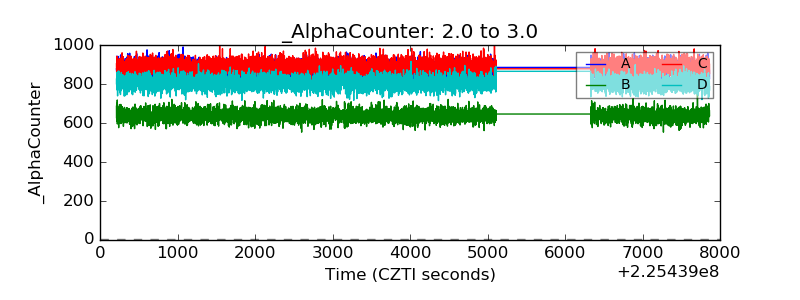 |
| _CPM_Rate | 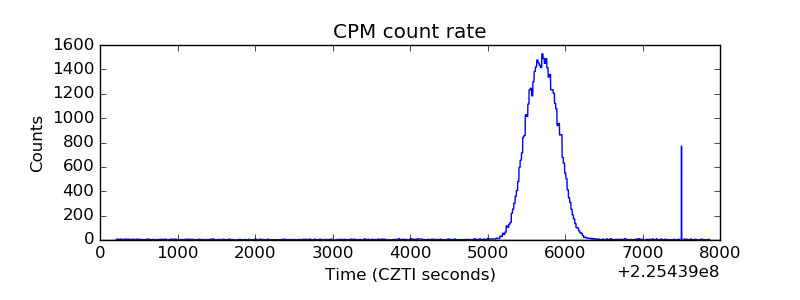 |
| CZT Counter | 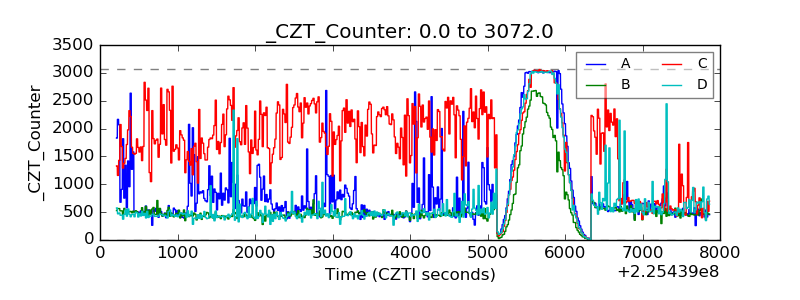 |
| +2.5 Volts monitor | 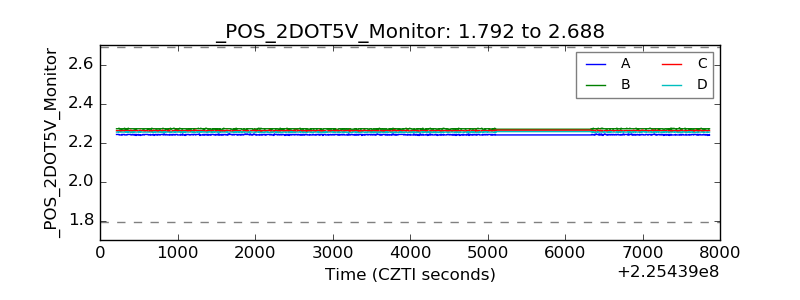 |
| +5 Volts monitor | 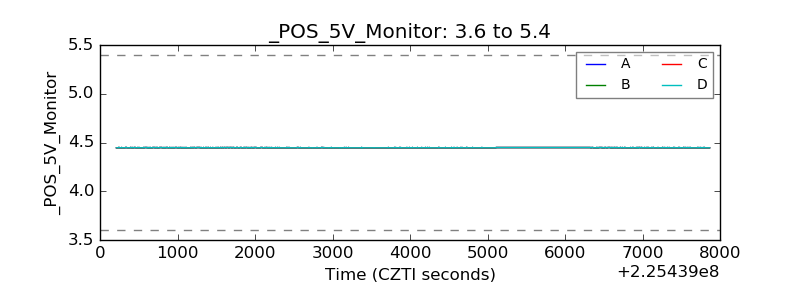 |
| _ROLL_ROT | 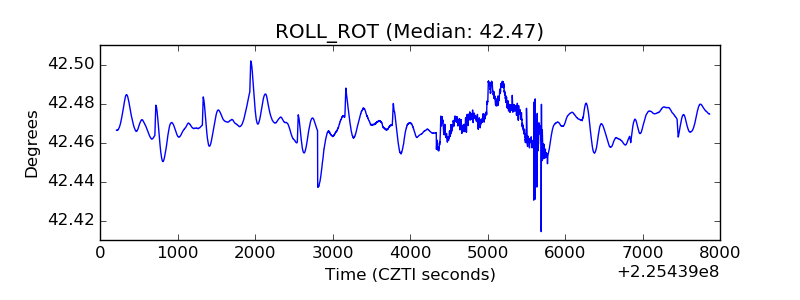 |
| _Roll_DEC | 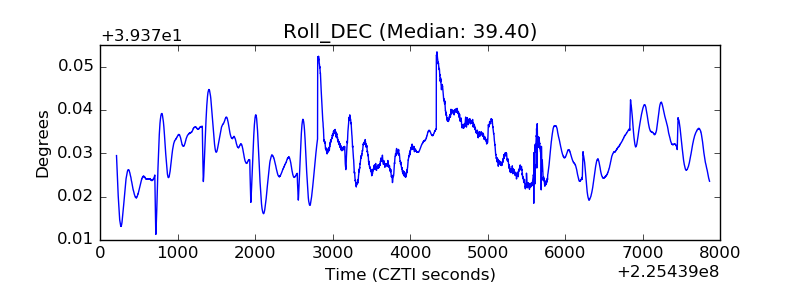 |
| _Roll_RA | 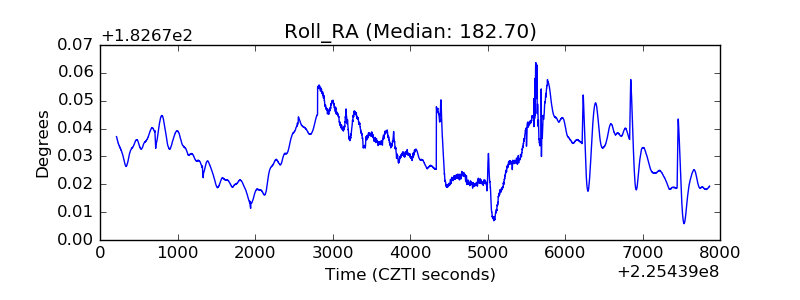 |
| Veto Counter | 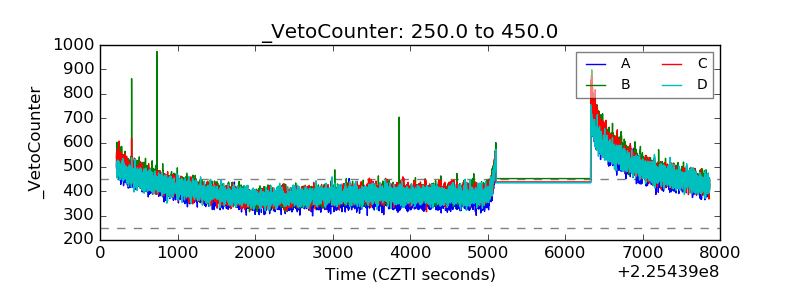 |