| Param | Original file | Final file |
|---|---|---|
| Filename | modeM0/AS1G06_117T01_9000001046_07597cztM0_level2.evt | modeM0/AS1G06_117T01_9000001046_07597cztM0_level2_quad_clean.evt |
| Size (bytes) | 496,422,720 | 65,136,960 |
| Size | 473.4 MB | 62.1 MB |
| Events in quadrant A | 3,752,964 | 386,741 |
| Events in quadrant B | 3,192,329 | 398,330 |
| Events in quadrant C | 4,112,369 | 383,620 |
| Events in quadrant D | 3,558,429 | 372,816 |
| Mode SS | |||
|---|---|---|---|
| Quadrant | BADHDUFLAG | Total packets | Discarded packets |
| A | 0 | 126 | 0 |
| B | 0 | 126 | 0 |
| C | 0 | 126 | 0 |
| D | 0 | 126 | 0 |
| Mode M0 | |||
|---|---|---|---|
| Quadrant | BADHDUFLAG | Total packets | Discarded packets |
| A | 0 | 15048 | 2 |
| B | 0 | 13211 | 1 |
| C | 0 | 16272 | 1 |
| D | 0 | 14575 | 1 |
| Mode M9 | |||
|---|---|---|---|
| Quadrant | BADHDUFLAG | Total packets | Discarded packets |
| A | 0 | 12 | 0 |
| B | 0 | 12 | 0 |
| C | 0 | 12 | 0 |
| D | 0 | 12 | 0 |
| Quadrant | Total seconds | Saturated seconds | Saturation percentage |
|---|---|---|---|
| A | 6166 | 80 | 1.297438% |
| B | 6166 | 112 | 1.816413% |
| C | 6166 | 105 | 1.702887% |
| D | 6166 | 124 | 2.011028% |
Noise dominated data is calculated using 1-second bins in cleaned event files. If a bin has >2000 counts, and if more than 50% of those come from <1% of pixels, then it is considered to be noise-dominated and hence unusable.
| Quadrant | # 1 sec bins | Bins with >0 counts | Bins with >2000 counts | High rate bins dominated by noise | Noise dominated (total time) | Noise dominated (detector-on time) | Marked lightcurve |
|---|---|---|---|---|---|---|---|
| A | 7406 | 6167 | 1 | 1 | 0.01% | 0.02% | 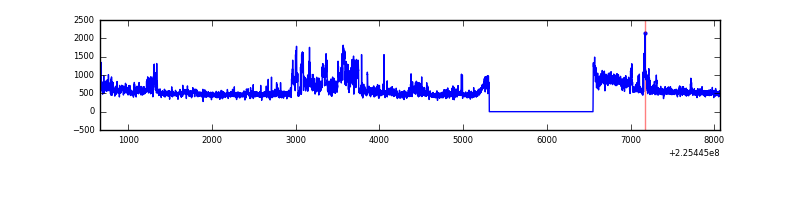 |
| B | 7406 | 6166 | 22 | 22 | 0.30% | 0.36% | 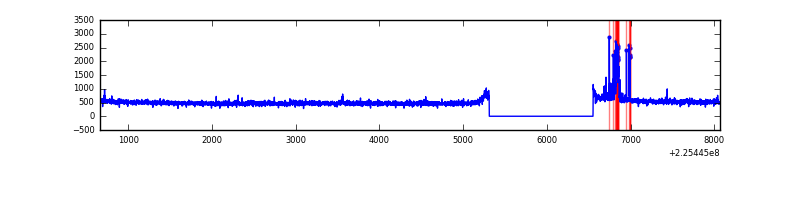 |
| C | 7406 | 6166 | 29 | 29 | 0.39% | 0.47% | 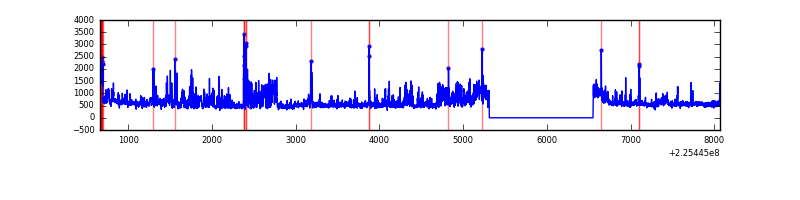 |
| D | 7406 | 6167 | 61 | 61 | 0.82% | 0.99% | 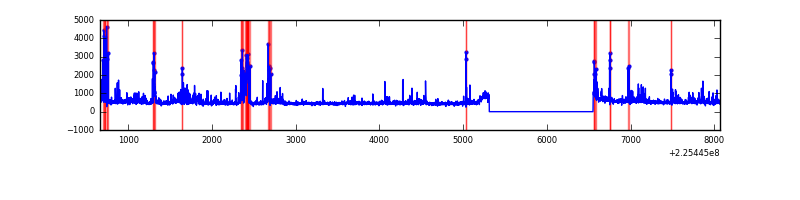 |
Top three noisy pixels from each quadrant. If the there are fewer than three noisy pixels in the level2.evt file, extra rows are filled as -1
| Pixel properties | Quadrant properties | ||||||
|---|---|---|---|---|---|---|---|
| Quadrant | DetID | PixID | Counts | Sigma | Mean | Median | Sigma |
| A | 15 | 239 | 711843 | 4493.28 | 791 | 778 | 158.3 |
| A | 0 | 226 | 7709 | 43.8 | 791 | 778 | 158.3 |
| A | 12 | 194 | 6779 | 37.92 | 791 | 778 | 158.3 |
| B | 4 | 81 | 129999 | 870.26 | 787 | 769 | 148.5 |
| B | 12 | 111 | 15399 | 98.52 | 787 | 769 | 148.5 |
| B | 11 | 111 | 12358 | 78.04 | 787 | 769 | 148.5 |
| C | 9 | 68 | 1102424 | 6362.84 | 753 | 758 | 173.1 |
| C | 1 | 16 | 38421 | 217.53 | 753 | 758 | 173.1 |
| C | 8 | 229 | 24646 | 137.97 | 753 | 758 | 173.1 |
| D | 2 | 152 | 289615 | 1550.27 | 761 | 738 | 186.3 |
| D | 5 | 233 | 288906 | 1546.47 | 761 | 738 | 186.3 |
| D | 13 | 104 | 61861 | 328.02 | 761 | 738 | 186.3 |
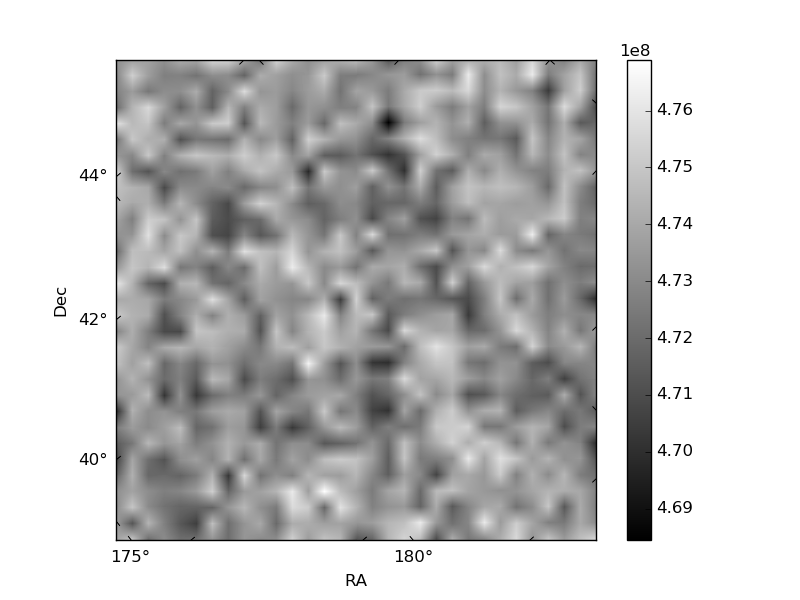
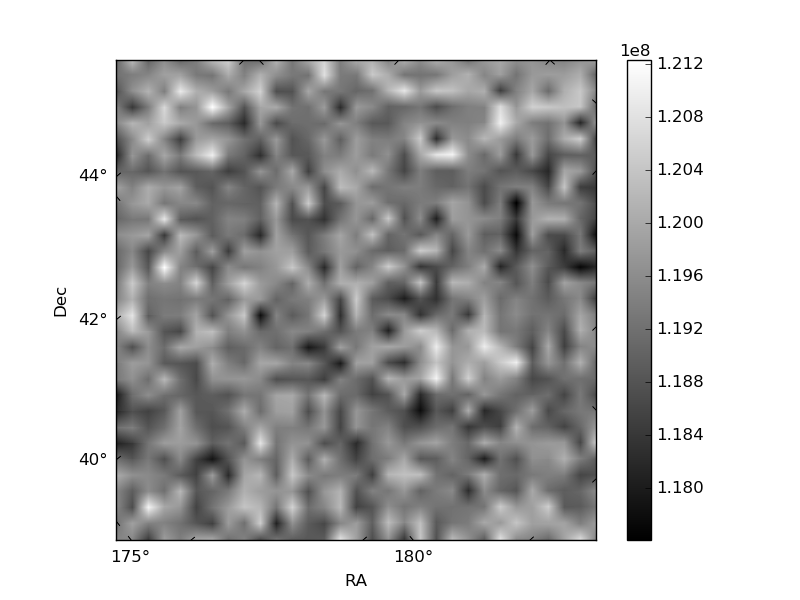
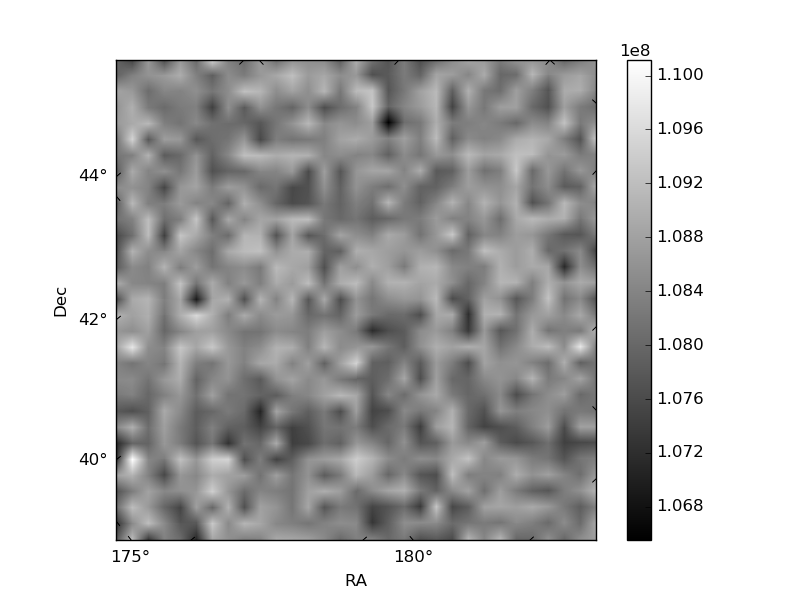
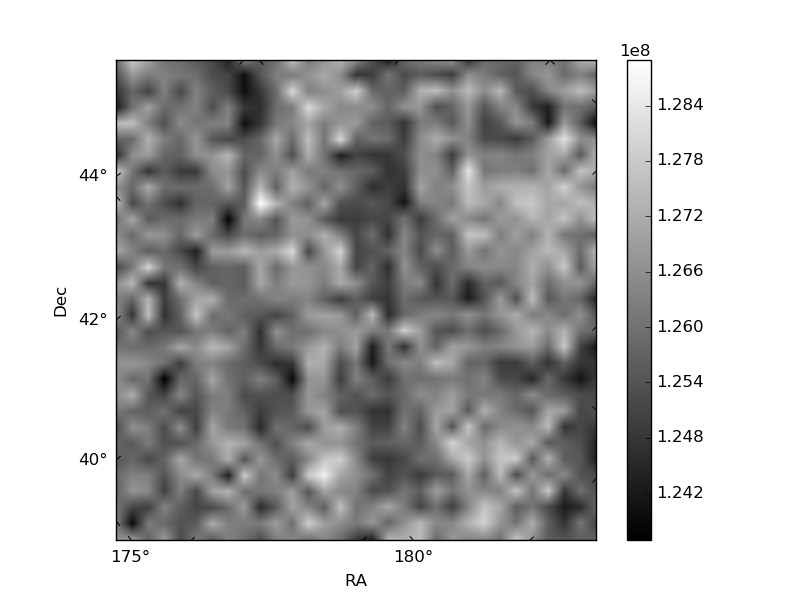
Histogram calculated using DETX and DETY for each event in the final _common_clean file
| Quadrant A | 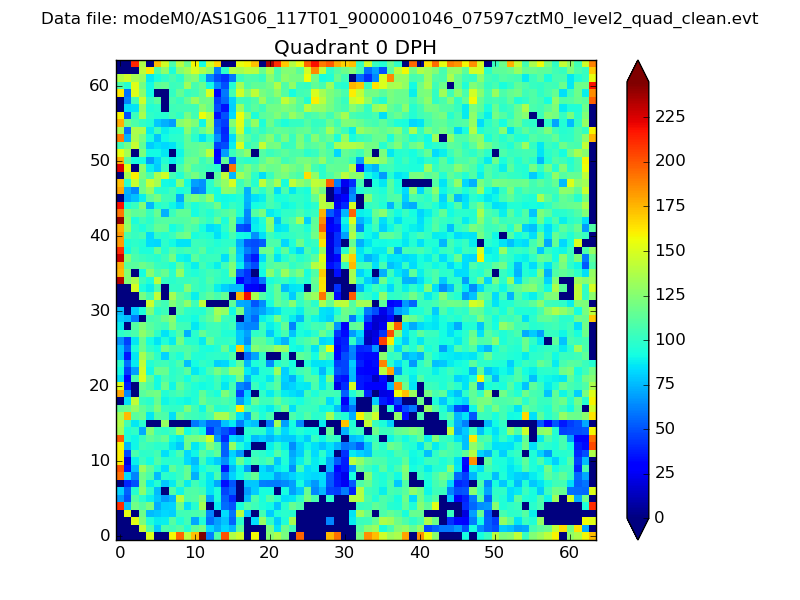 |
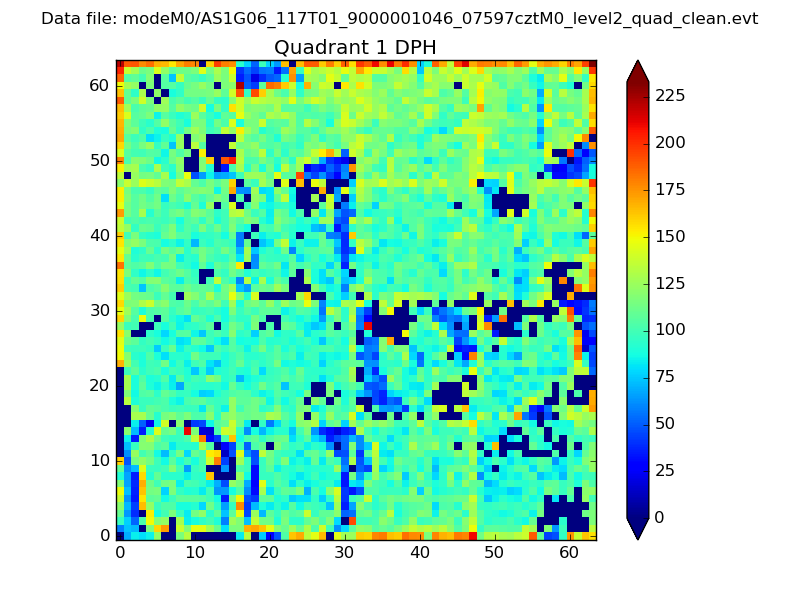 |
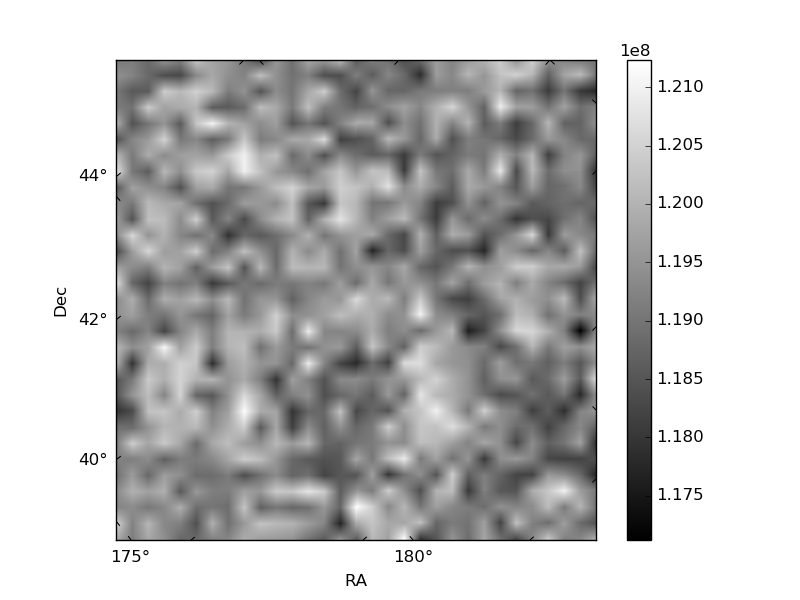
Quadrant B |
|---|---|---|---|
| Quadrant D | 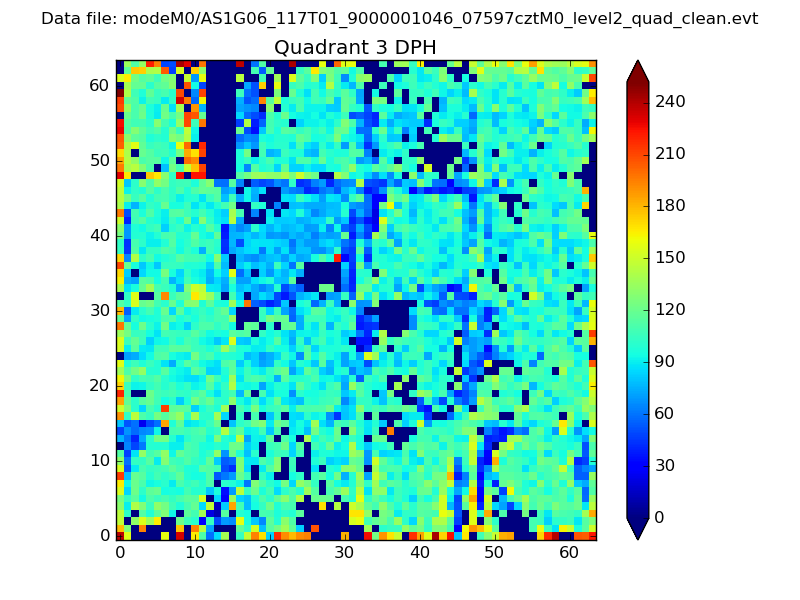 |
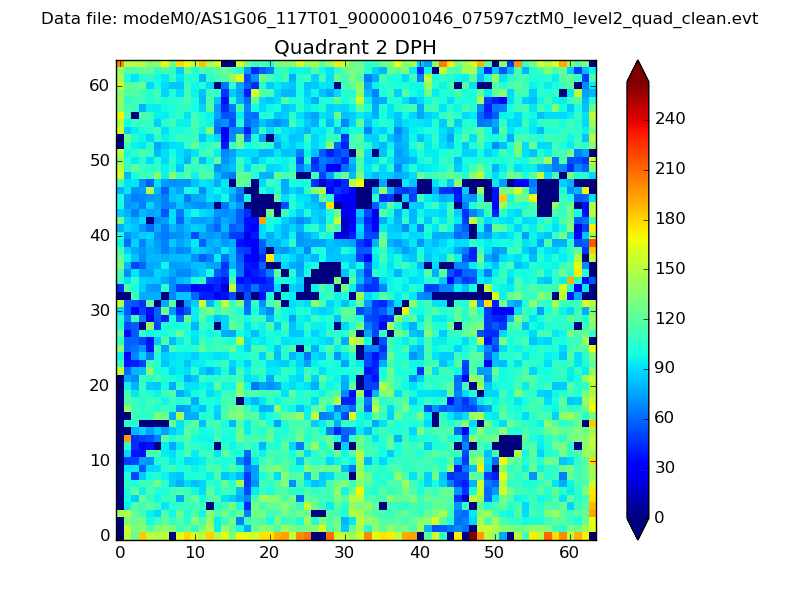 |
Quadrant C |
| Plot type | Count rate plots | Images |
|---|---|---|
| Comparison with Poisson distribution Blue bars denote a histogram of data divided into 1 sec bins. Red curve is a Poisson curve with rate = median count rate of data. |
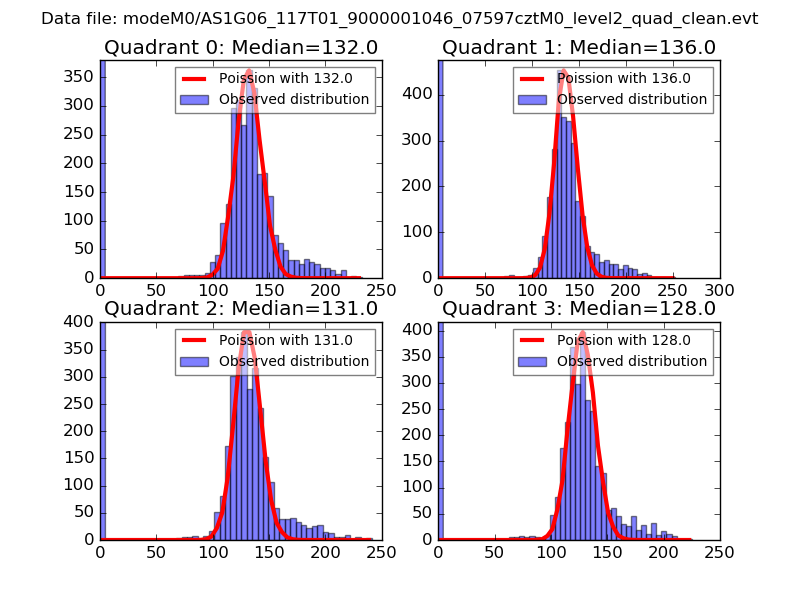 |
 |
| Quadrant-wise count rates Data is divided into 100 sec bins |
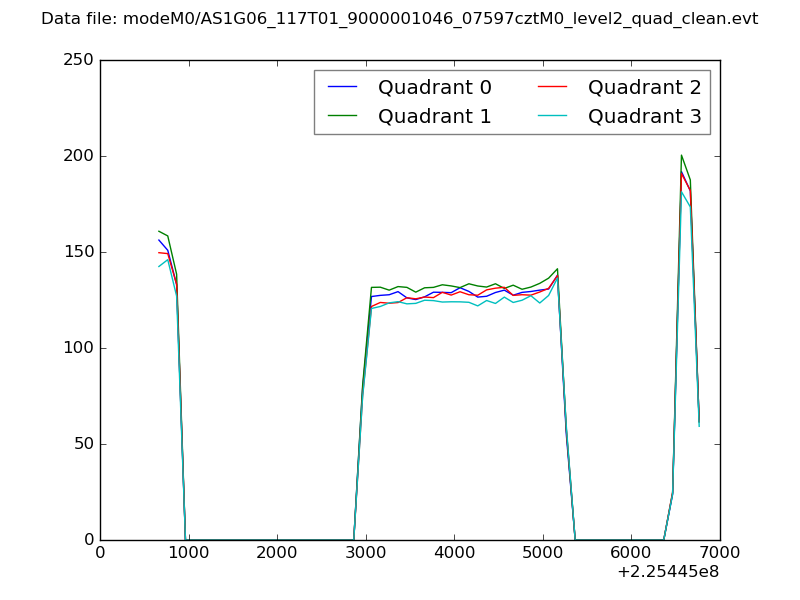 |
|
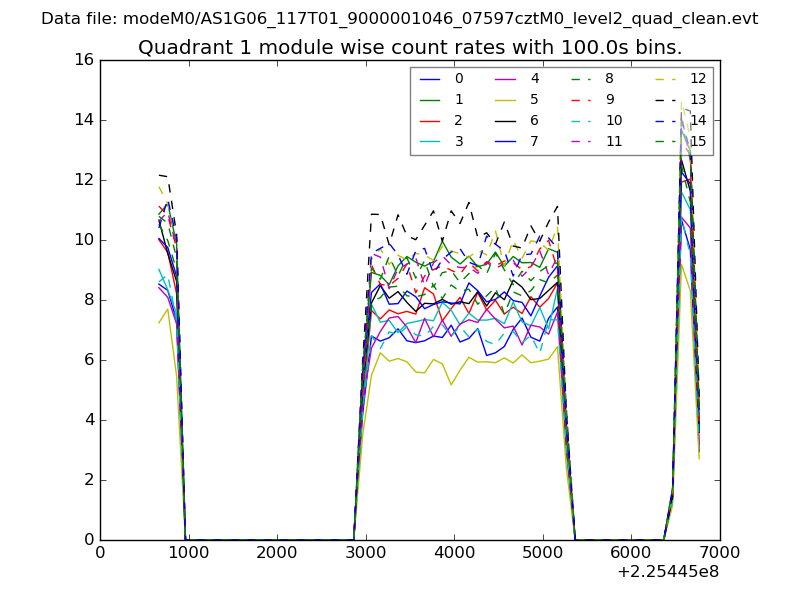
| Module-wise count rates for Quadrant A Data is divided into 100 sec bins |
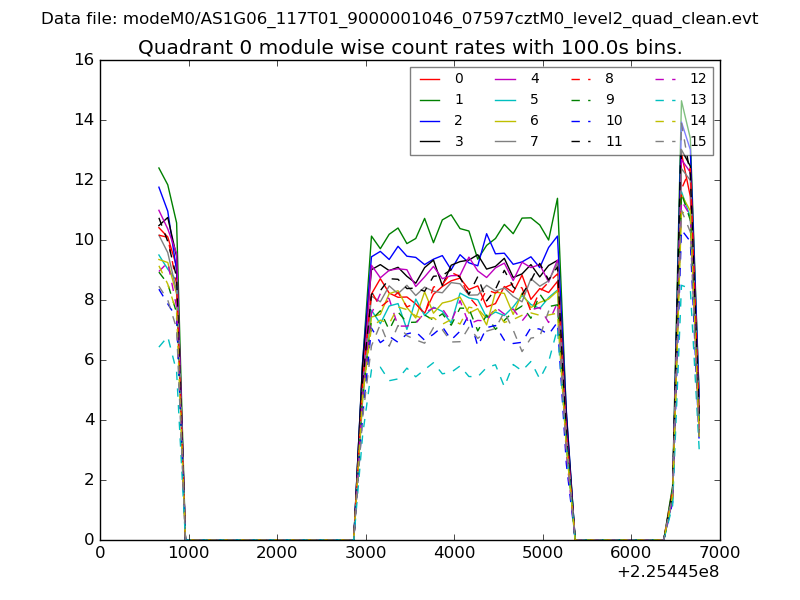 |
 |
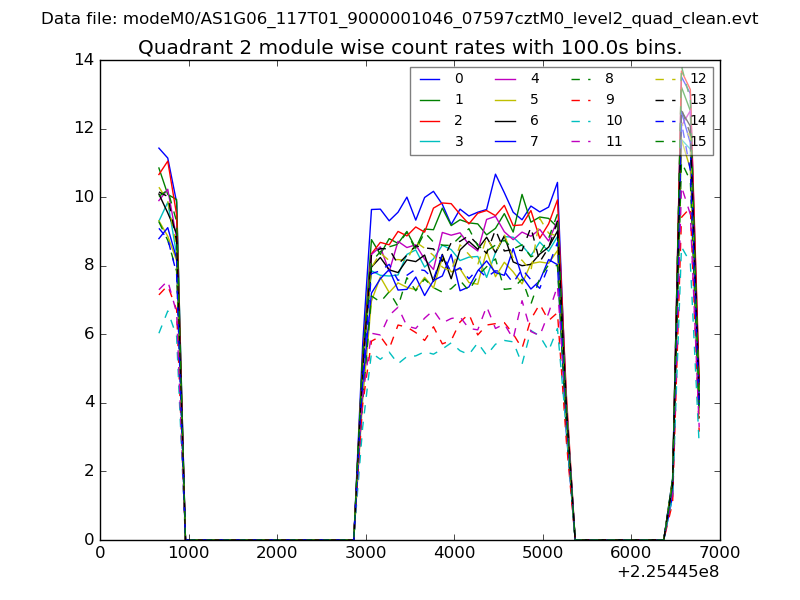
| Module-wise count rates for Quadrant B Data is divided into 100 sec bins |
 |
 |
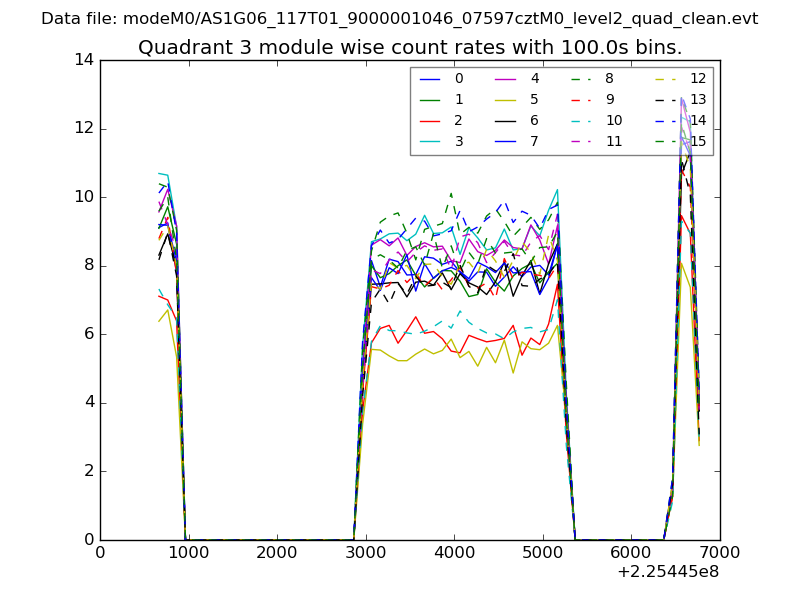
| Module-wise count rates for Quadrant C Data is divided into 100 sec bins |
 |
 |
| Module-wise count rates for Quadrant D Data is divided into 100 sec bins |
 |
 |
| Parameter | Plot |
|---|---|
| CZT HV Monitor | 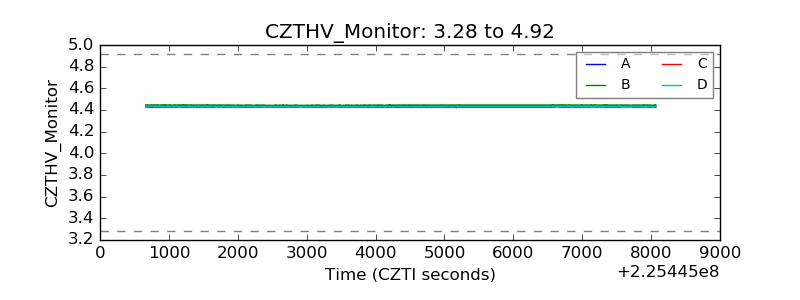 |
| D_VDD | 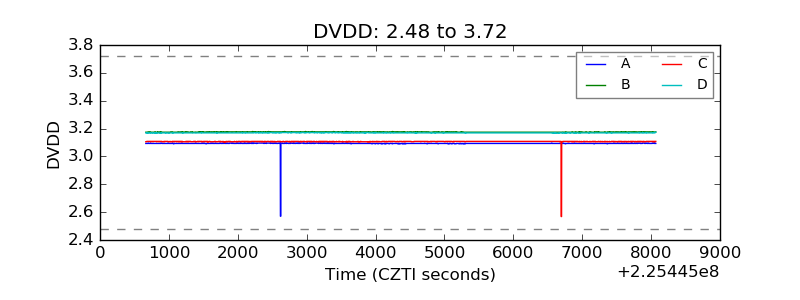 |
| Temperature 1 | 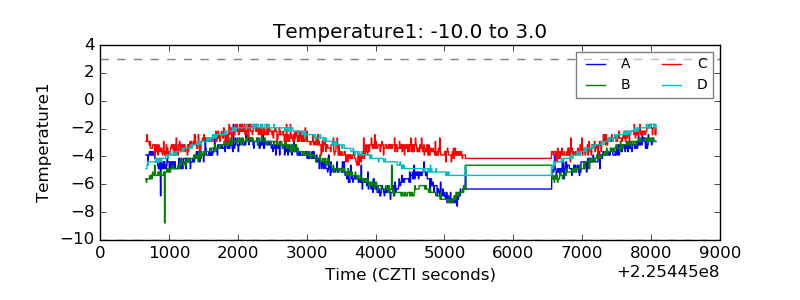 |
| Veto HV Monitor | 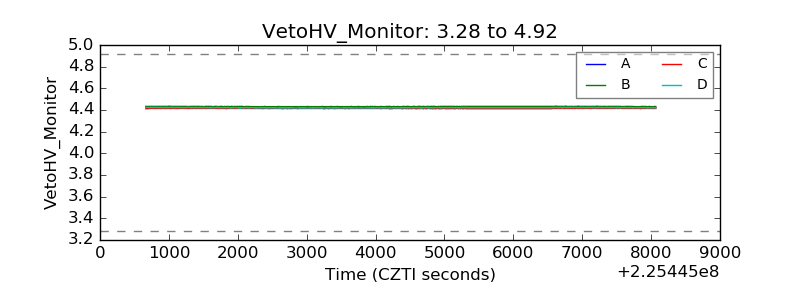 |
| Veto LLD | 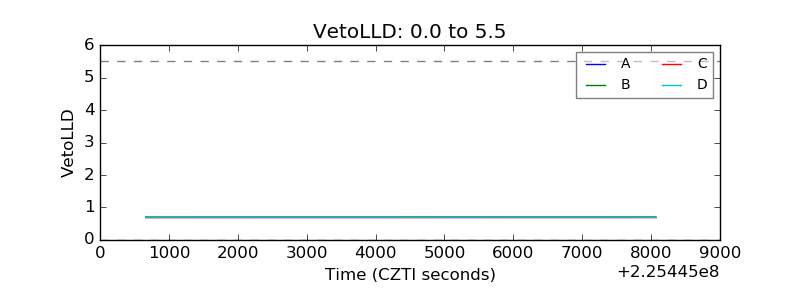 |
| Alpha Counter | 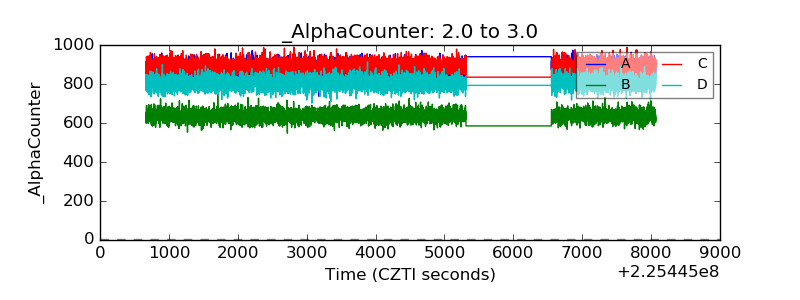 |
| _CPM_Rate | 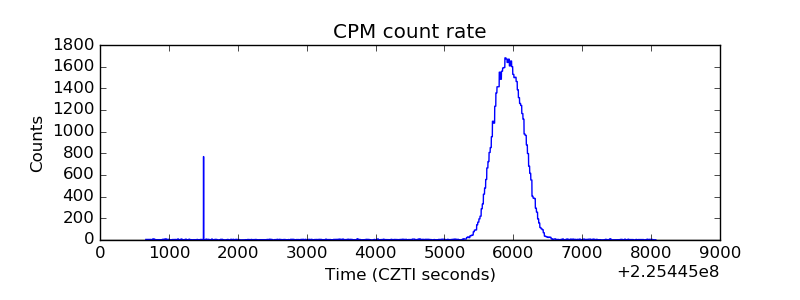 |
| CZT Counter | 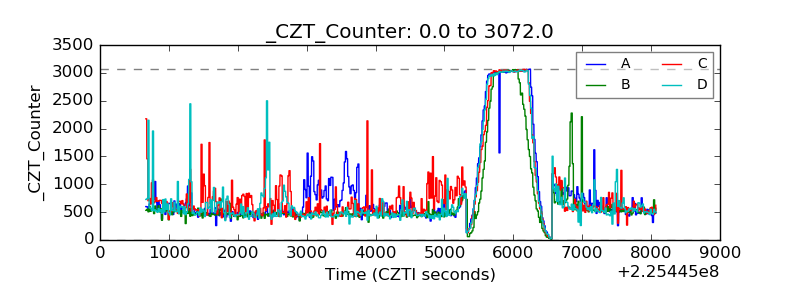 |
| +2.5 Volts monitor | 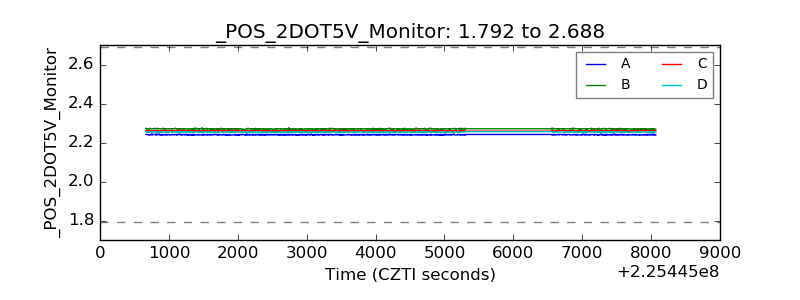 |
| +5 Volts monitor | 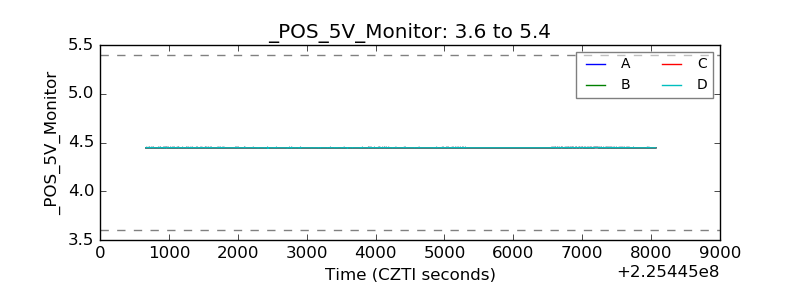 |
| _ROLL_ROT | 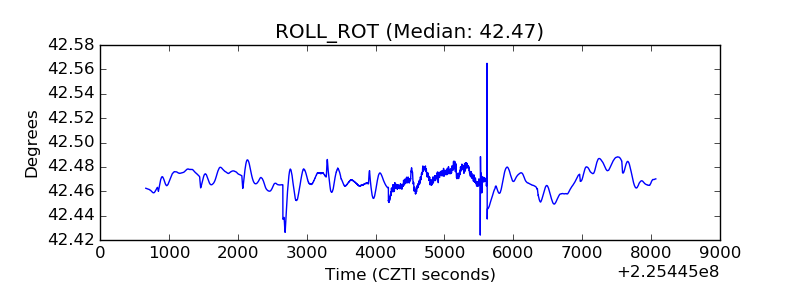 |
| _Roll_DEC | 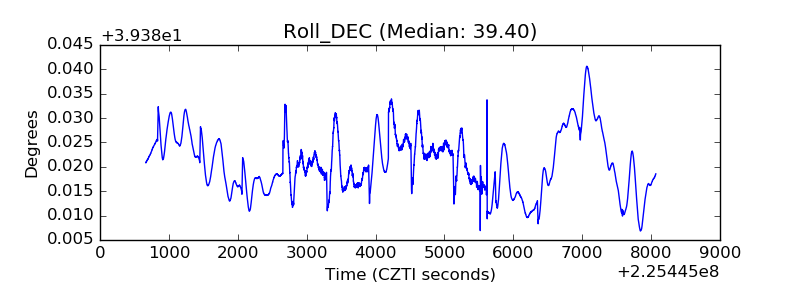 |
| _Roll_RA | 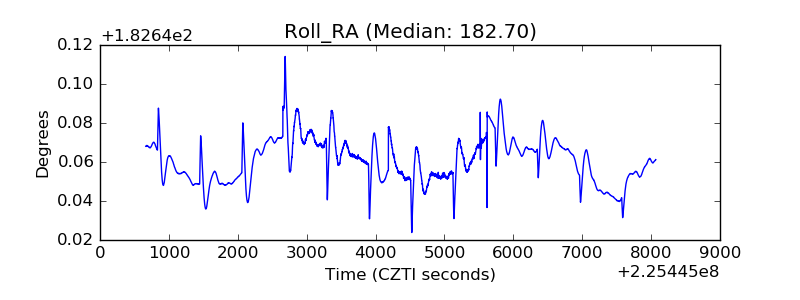 |
| Veto Counter | 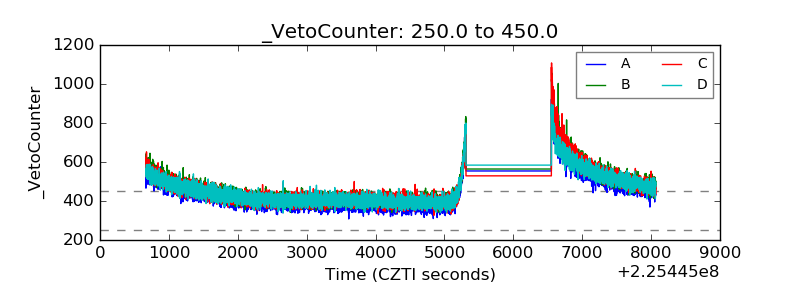 |