| Param | Original file | Final file |
|---|---|---|
| Filename | modeM0/AS1G06_117T01_9000001046_07598cztM0_level2.evt | modeM0/AS1G06_117T01_9000001046_07598cztM0_level2_quad_clean.evt |
| Size (bytes) | 567,198,720 | 65,940,480 |
| Size | 540.9 MB | 62.9 MB |
| Events in quadrant A | 3,589,057 | 400,511 |
| Events in quadrant B | 3,494,913 | 406,533 |
| Events in quadrant C | 5,783,483 | 362,802 |
| Events in quadrant D | 3,874,477 | 377,581 |
| Mode SS | |||
|---|---|---|---|
| Quadrant | BADHDUFLAG | Total packets | Discarded packets |
| A | 0 | 132 | 0 |
| B | 0 | 132 | 0 |
| C | 0 | 132 | 0 |
| D | 0 | 132 | 0 |
| Mode M0 | |||
|---|---|---|---|
| Quadrant | BADHDUFLAG | Total packets | Discarded packets |
| A | 0 | 14593 | 3 |
| B | 0 | 14260 | 2 |
| C | 0 | 21608 | 2 |
| D | 0 | 15651 | 2 |
| Mode M9 | |||
|---|---|---|---|
| Quadrant | BADHDUFLAG | Total packets | Discarded packets |
| A | 0 | 15 | 0 |
| B | 0 | 15 | 0 |
| C | 0 | 15 | 0 |
| D | 0 | 16 | 0 |
| Quadrant | Total seconds | Saturated seconds | Saturation percentage |
|---|---|---|---|
| A | 6428 | 106 | 1.649035% |
| B | 6428 | 143 | 2.224642% |
| C | 6428 | 596 | 9.271935% |
| D | 6428 | 169 | 2.629123% |
Noise dominated data is calculated using 1-second bins in cleaned event files. If a bin has >2000 counts, and if more than 50% of those come from <1% of pixels, then it is considered to be noise-dominated and hence unusable.
| Quadrant | # 1 sec bins | Bins with >0 counts | Bins with >2000 counts | High rate bins dominated by noise | Noise dominated (total time) | Noise dominated (detector-on time) | Marked lightcurve |
|---|---|---|---|---|---|---|---|
| A | 7743 | 6429 | 1 | 1 | 0.01% | 0.02% | 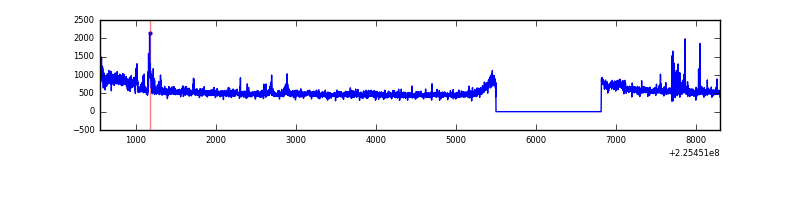 |
| B | 7743 | 6429 | 23 | 23 | 0.30% | 0.36% | 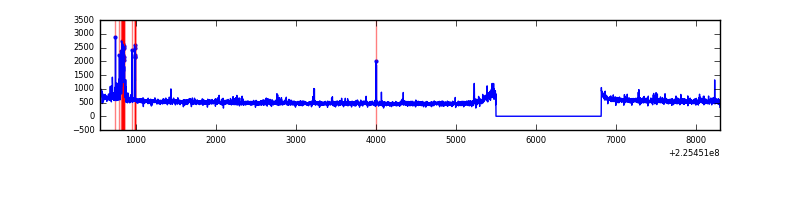 |
| C | 7743 | 6428 | 364 | 364 | 4.70% | 5.66% | 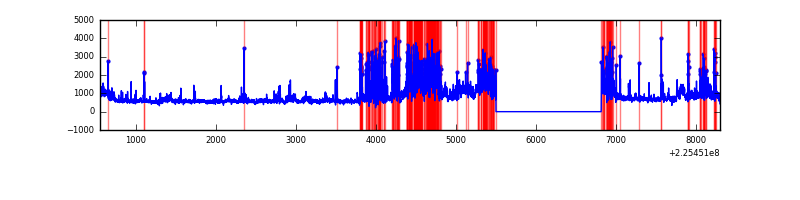 |
| D | 7743 | 6429 | 79 | 79 | 1.02% | 1.23% | 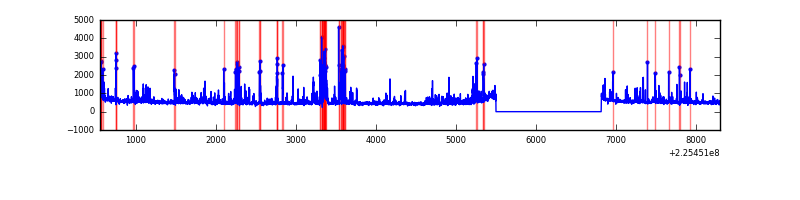 |
Top three noisy pixels from each quadrant. If the there are fewer than three noisy pixels in the level2.evt file, extra rows are filled as -1
| Pixel properties | Quadrant properties | ||||||
|---|---|---|---|---|---|---|---|
| Quadrant | DetID | PixID | Counts | Sigma | Mean | Median | Sigma |
| A | 15 | 239 | 289434 | 1688.5 | 857 | 841 | 170.9 |
| A | 0 | 226 | 8022 | 42.01 | 857 | 841 | 170.9 |
| A | 12 | 194 | 7590 | 39.49 | 857 | 841 | 170.9 |
| B | 4 | 81 | 150426 | 935.19 | 851 | 833 | 160.0 |
| B | 0 | 214 | 30130 | 183.15 | 851 | 833 | 160.0 |
| B | 12 | 111 | 16239 | 96.31 | 851 | 833 | 160.0 |
| C | 9 | 68 | 1502507 | 8318.71 | 791 | 795 | 180.5 |
| C | 4 | 254 | 1034473 | 5726.05 | 791 | 795 | 180.5 |
| C | 8 | 229 | 112542 | 619.02 | 791 | 795 | 180.5 |
| D | 2 | 14 | 295537 | 1461.28 | 825 | 802 | 201.7 |
| D | 5 | 233 | 239325 | 1182.58 | 825 | 802 | 201.7 |
| D | 2 | 152 | 112174 | 552.18 | 825 | 802 | 201.7 |
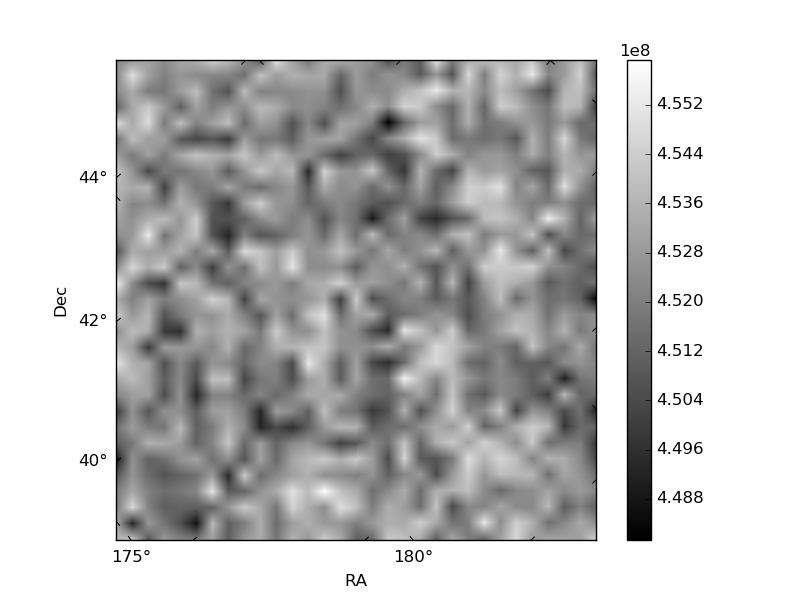
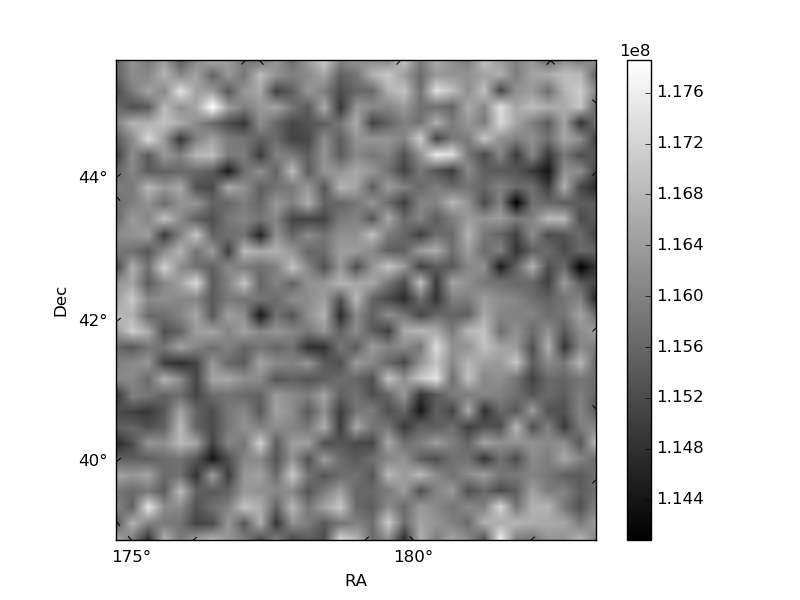
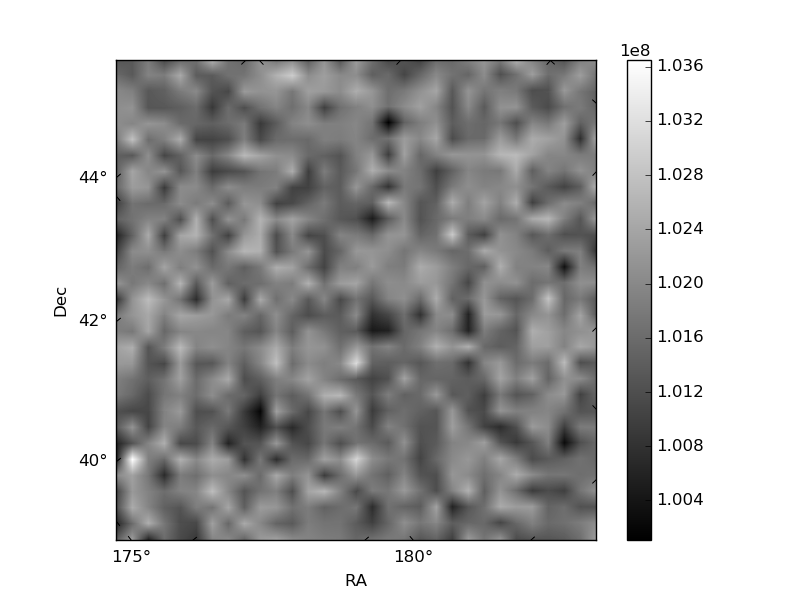
Histogram calculated using DETX and DETY for each event in the final _common_clean file
| Quadrant A | 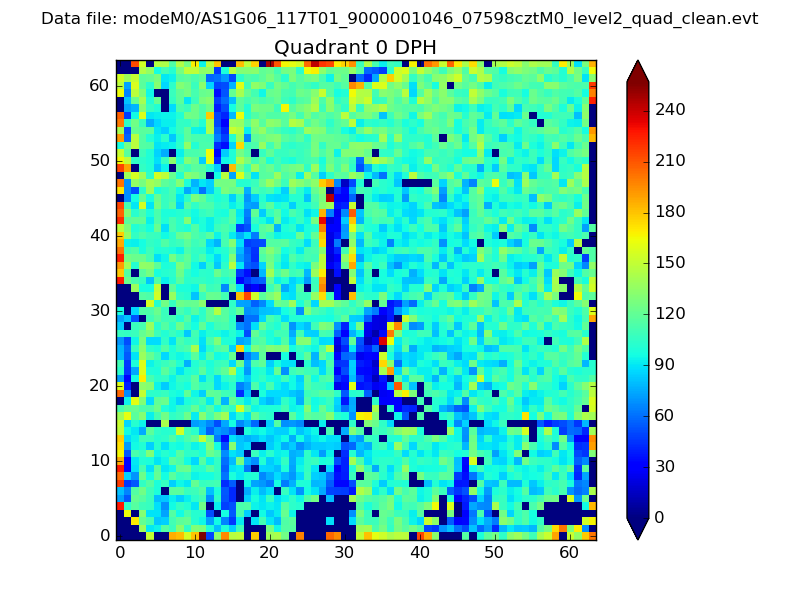 |
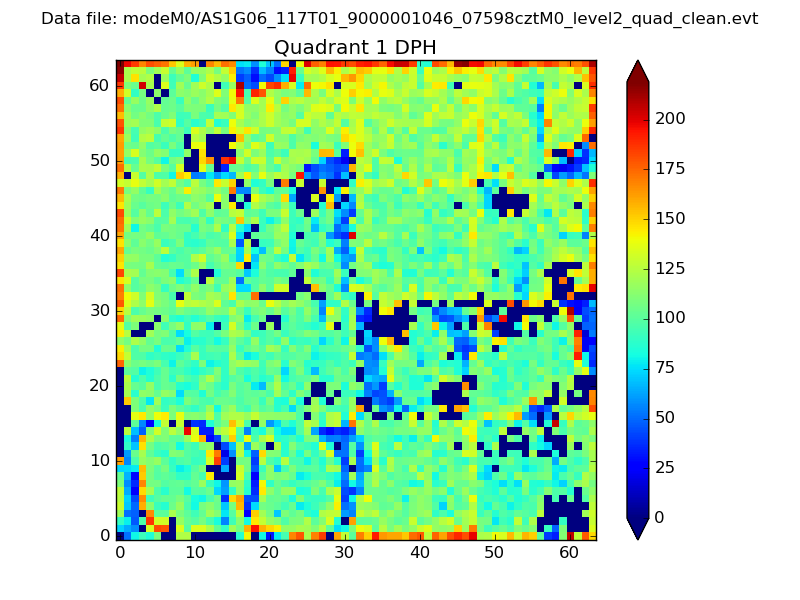 |
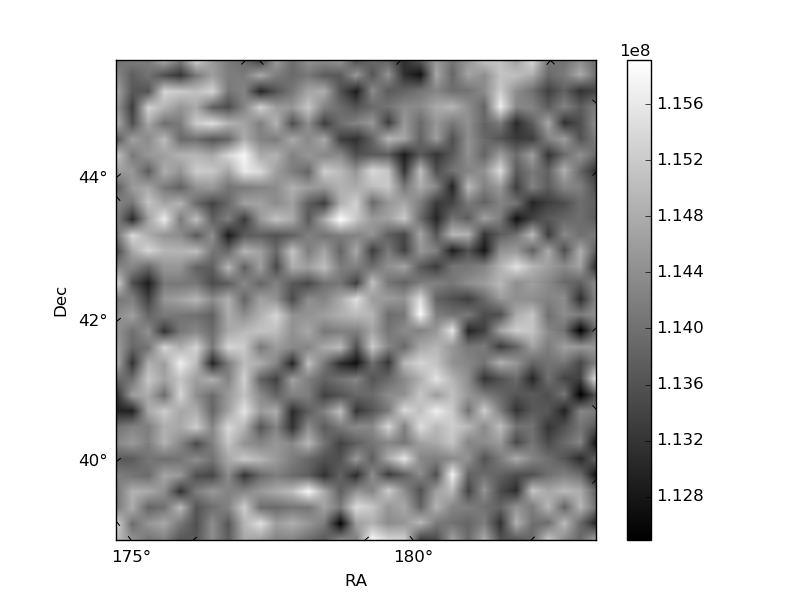
Quadrant B |
|---|---|---|---|
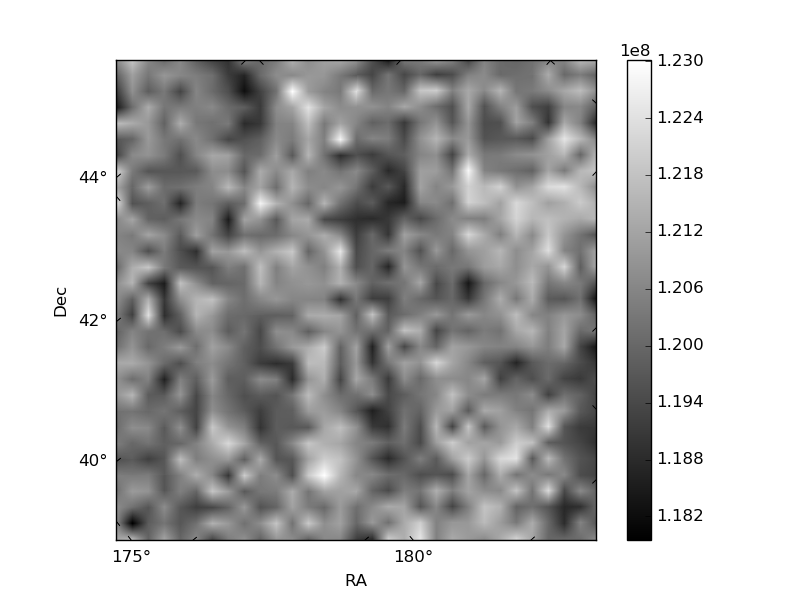
| Quadrant D | 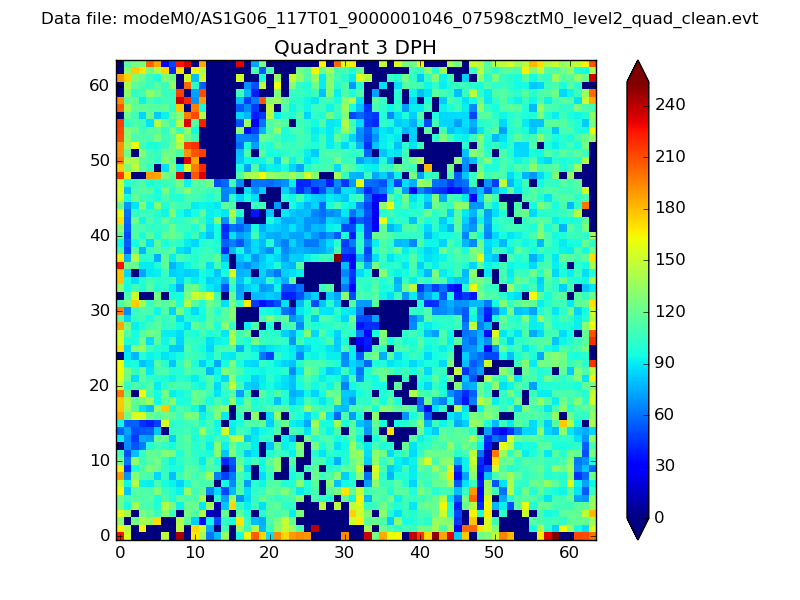 |
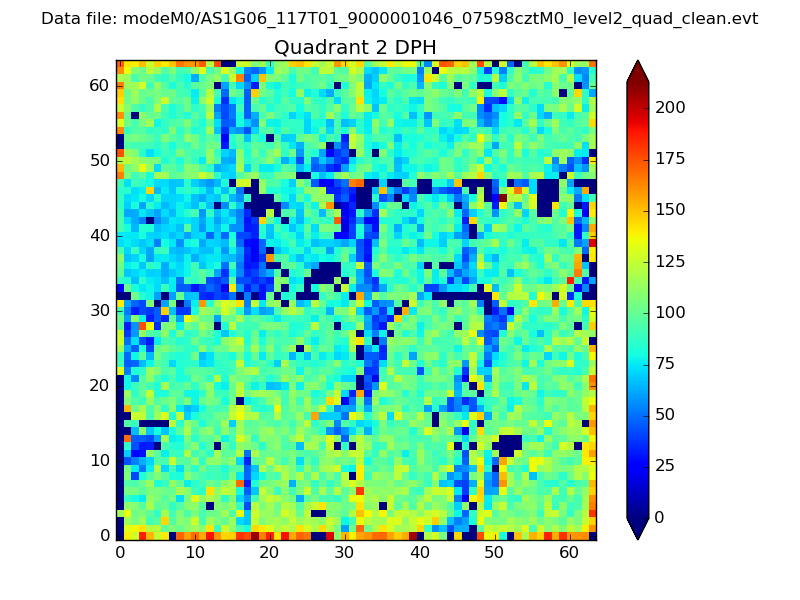 |
Quadrant C |
| Plot type | Count rate plots | Images |
|---|---|---|
| Comparison with Poisson distribution Blue bars denote a histogram of data divided into 1 sec bins. Red curve is a Poisson curve with rate = median count rate of data. |
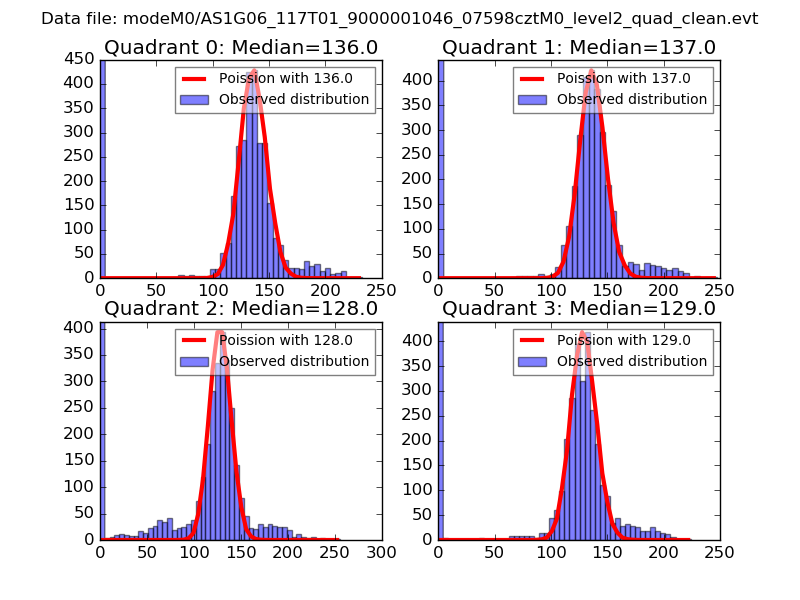 |
 |
| Quadrant-wise count rates Data is divided into 100 sec bins |
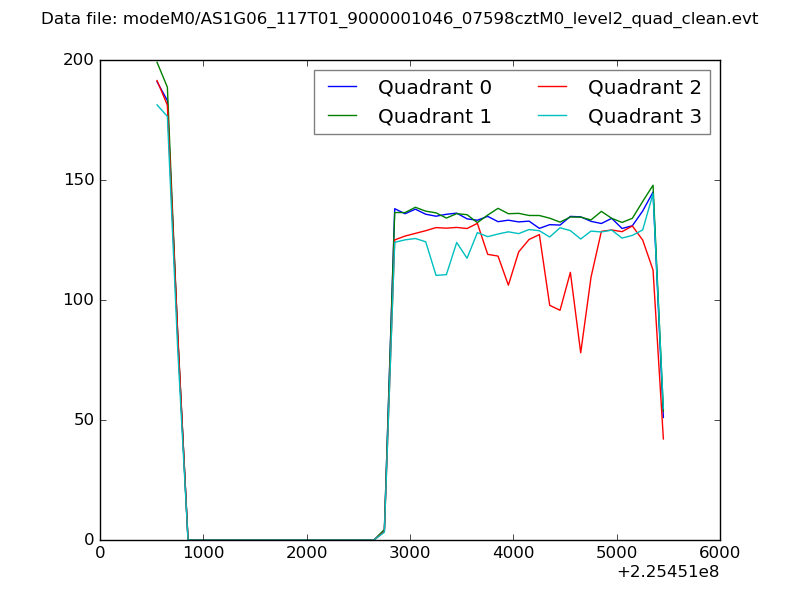 |
|
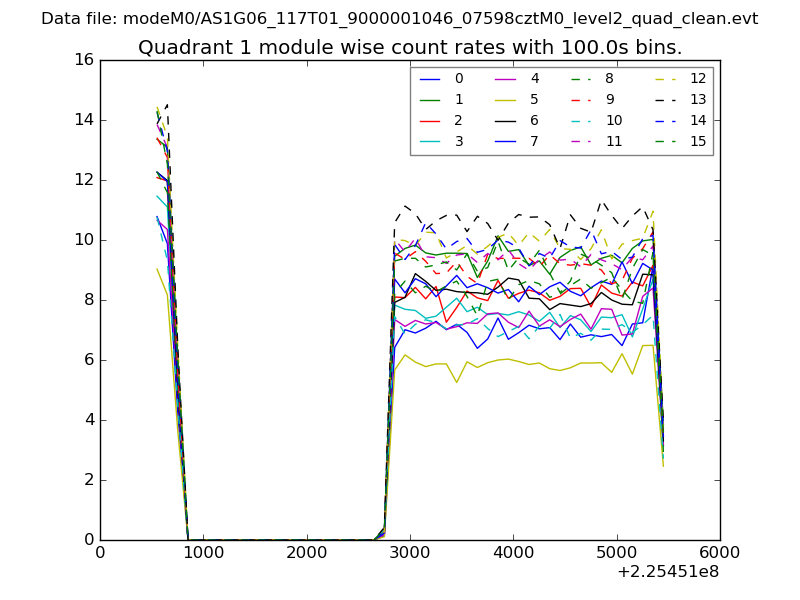
| Module-wise count rates for Quadrant A Data is divided into 100 sec bins |
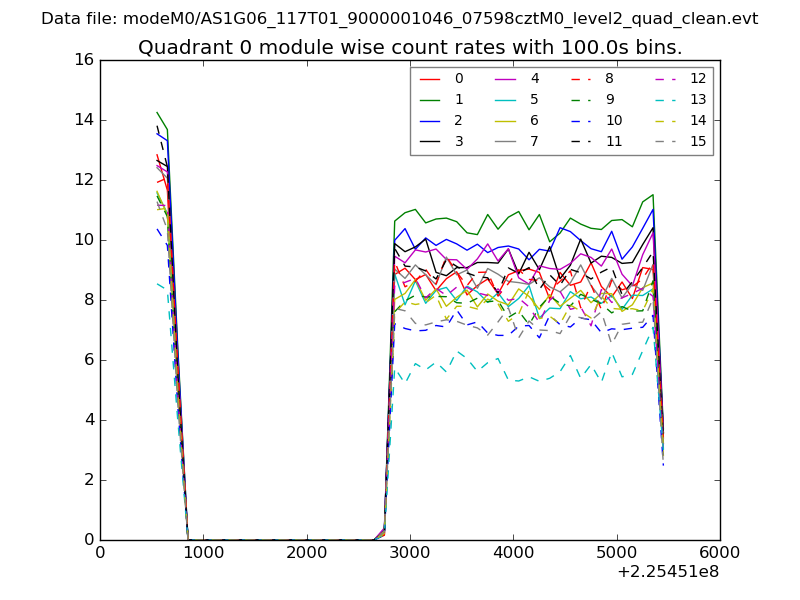 |
 |
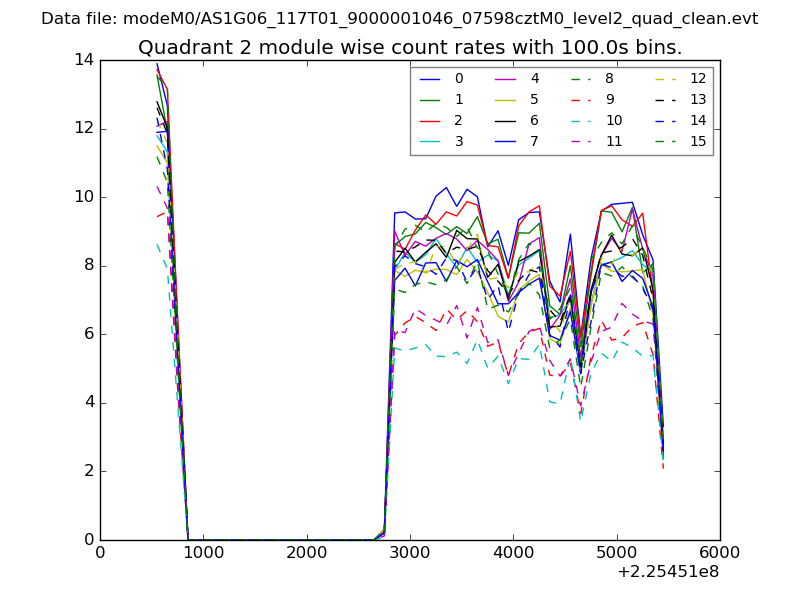
| Module-wise count rates for Quadrant B Data is divided into 100 sec bins |
 |
 |
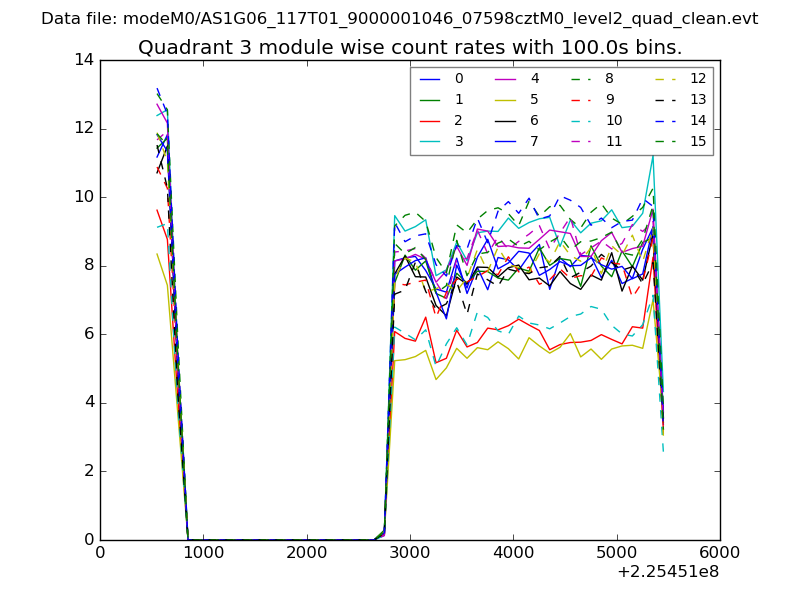
| Module-wise count rates for Quadrant C Data is divided into 100 sec bins |
 |
 |
| Module-wise count rates for Quadrant D Data is divided into 100 sec bins |
 |
 |
| Parameter | Plot |
|---|---|
| CZT HV Monitor | 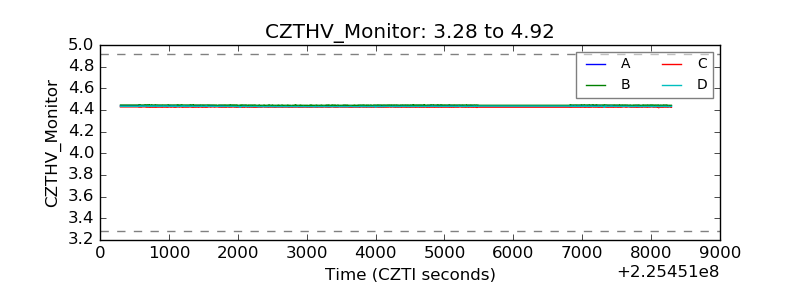 |
| D_VDD | 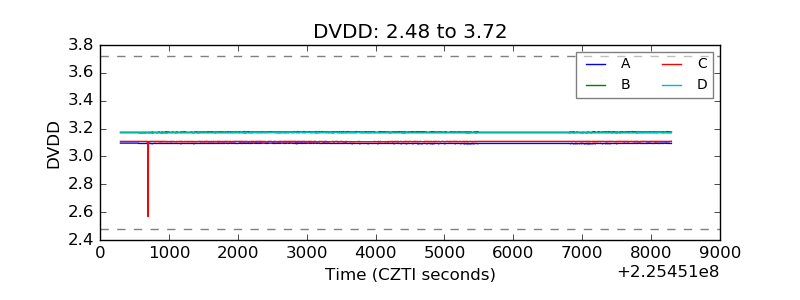 |
| Temperature 1 | 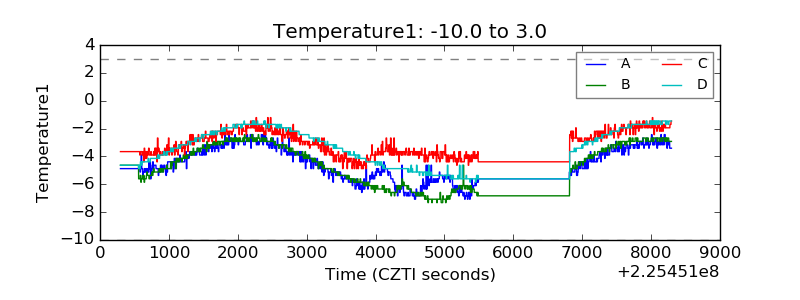 |
| Veto HV Monitor | 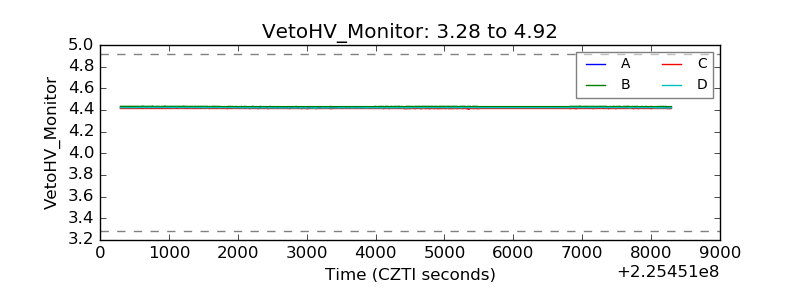 |
| Veto LLD | 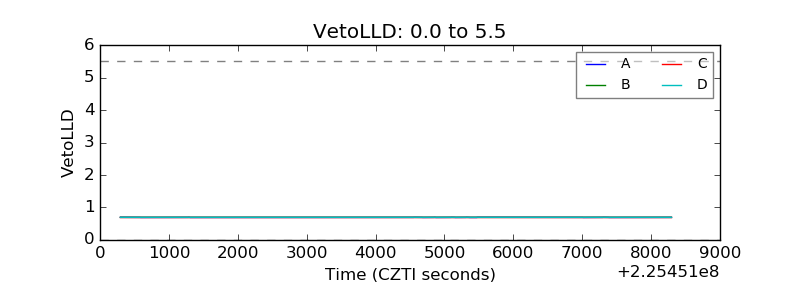 |
| Alpha Counter | 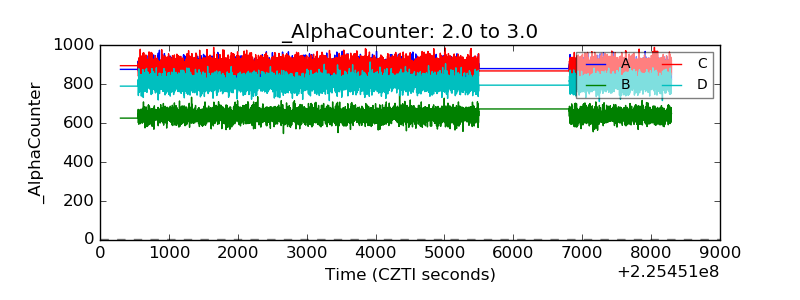 |
| _CPM_Rate | 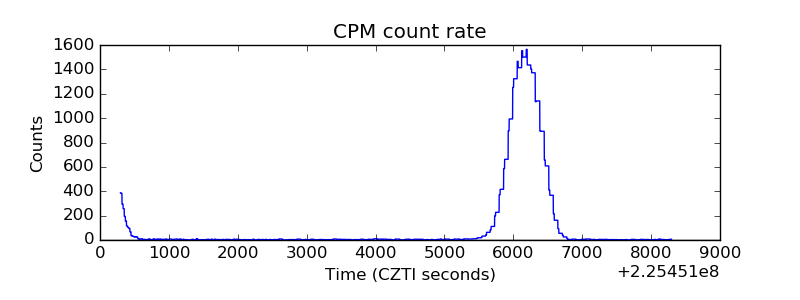 |
| CZT Counter | 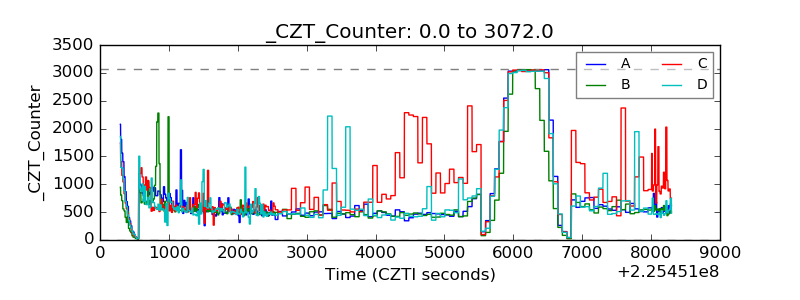 |
| +2.5 Volts monitor |  |
| +5 Volts monitor |  |
| _ROLL_ROT | 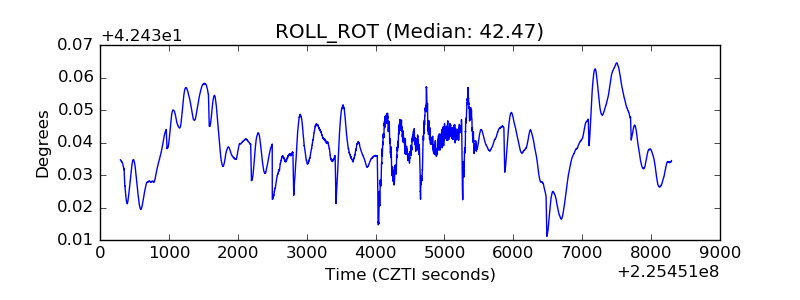 |
| _Roll_DEC | 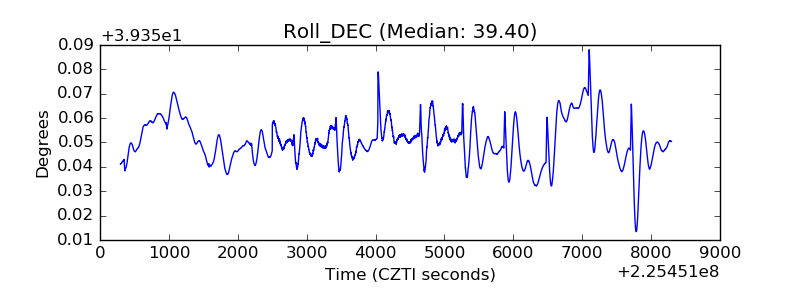 |
| _Roll_RA | 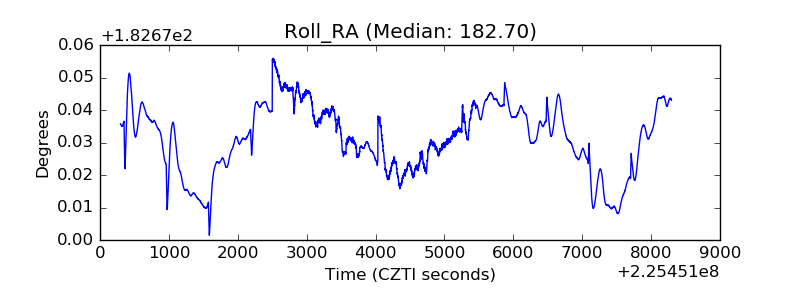 |
| Veto Counter | 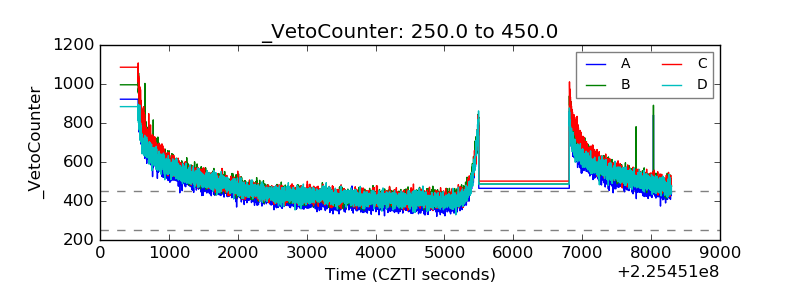 |