| Param | Original file | Final file |
|---|---|---|
| Filename | modeM0/AS1G06_117T01_9000001046_07599cztM0_level2.evt | modeM0/AS1G06_117T01_9000001046_07599cztM0_level2_quad_clean.evt |
| Size (bytes) | 642,147,840 | 68,918,400 |
| Size | 612.4 MB | 65.7 MB |
| Events in quadrant A | 3,473,440 | 424,110 |
| Events in quadrant B | 3,411,555 | 428,604 |
| Events in quadrant C | 8,267,357 | 375,329 |
| Events in quadrant D | 3,853,962 | 403,517 |
| Mode SS | |||
|---|---|---|---|
| Quadrant | BADHDUFLAG | Total packets | Discarded packets |
| A | 0 | 132 | 0 |
| B | 0 | 132 | 0 |
| C | 0 | 132 | 0 |
| D | 0 | 132 | 0 |
| Mode M0 | |||
|---|---|---|---|
| Quadrant | BADHDUFLAG | Total packets | Discarded packets |
| A | 0 | 14332 | 3 |
| B | 0 | 14098 | 2 |
| C | 0 | 29229 | 2 |
| D | 0 | 15684 | 2 |
| Mode M9 | |||
|---|---|---|---|
| Quadrant | BADHDUFLAG | Total packets | Discarded packets |
| A | 0 | 23 | 0 |
| B | 0 | 23 | 0 |
| C | 0 | 23 | 0 |
| D | 0 | 24 | 0 |
| Quadrant | Total seconds | Saturated seconds | Saturation percentage |
|---|---|---|---|
| A | 6522 | 132 | 2.023919% |
| B | 6522 | 118 | 1.809261% |
| C | 6522 | 1433 | 21.971788% |
| D | 6522 | 157 | 2.407237% |
Noise dominated data is calculated using 1-second bins in cleaned event files. If a bin has >2000 counts, and if more than 50% of those come from <1% of pixels, then it is considered to be noise-dominated and hence unusable.
| Quadrant | # 1 sec bins | Bins with >0 counts | Bins with >2000 counts | High rate bins dominated by noise | Noise dominated (total time) | Noise dominated (detector-on time) | Marked lightcurve |
|---|---|---|---|---|---|---|---|
| A | 7812 | 6522 | 0 | 0 | 0.00% | 0.00% | 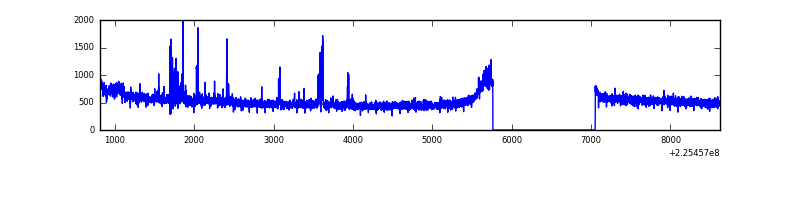 |
| B | 7812 | 6522 | 0 | 0 | 0.00% | 0.00% | 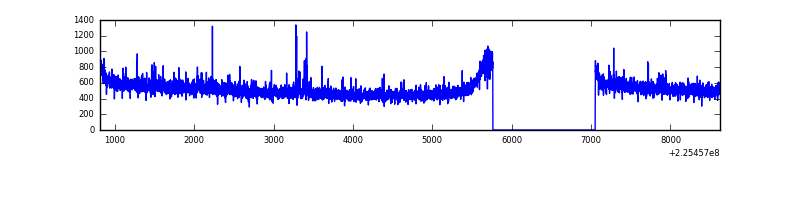 |
| C | 7812 | 6522 | 889 | 889 | 11.38% | 13.63% | 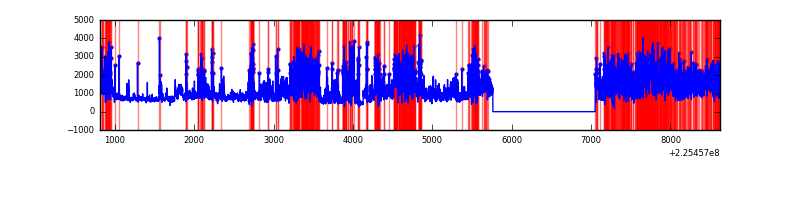 |
| D | 7812 | 6522 | 51 | 51 | 0.65% | 0.78% | 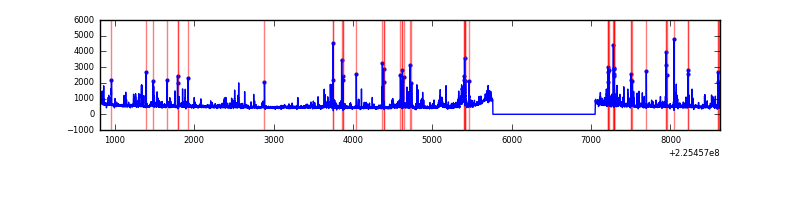 |
Top three noisy pixels from each quadrant. If the there are fewer than three noisy pixels in the level2.evt file, extra rows are filled as -1
| Pixel properties | Quadrant properties | ||||||
|---|---|---|---|---|---|---|---|
| Quadrant | DetID | PixID | Counts | Sigma | Mean | Median | Sigma |
| A | 15 | 239 | 160884 | 932.73 | 861 | 845 | 171.6 |
| A | 0 | 226 | 8071 | 42.11 | 861 | 845 | 171.6 |
| A | 12 | 194 | 7431 | 38.38 | 861 | 845 | 171.6 |
| B | 0 | 214 | 28293 | 171.5 | 860 | 840 | 160.1 |
| B | 4 | 173 | 27126 | 164.21 | 860 | 840 | 160.1 |
| B | 12 | 111 | 16312 | 96.65 | 860 | 840 | 160.1 |
| C | 9 | 68 | 4151110 | 23496.49 | 775 | 778 | 176.6 |
| C | 4 | 254 | 892642 | 5049.16 | 775 | 778 | 176.6 |
| C | 8 | 229 | 147107 | 828.42 | 775 | 778 | 176.6 |
| D | 5 | 233 | 246932 | 1215.53 | 834 | 808 | 202.5 |
| D | 1 | 52 | 154845 | 760.74 | 834 | 808 | 202.5 |
| D | 2 | 14 | 97384 | 476.96 | 834 | 808 | 202.5 |
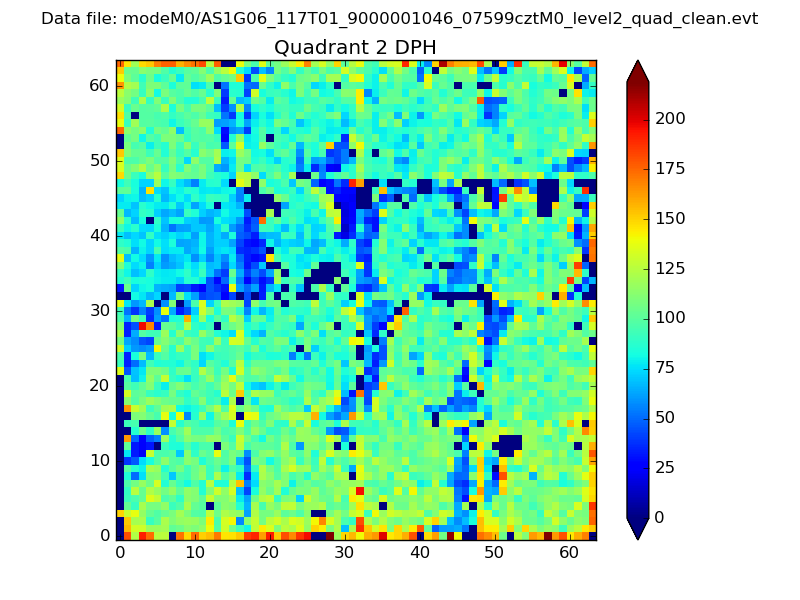
Histogram calculated using DETX and DETY for each event in the final _common_clean file
| Quadrant A | 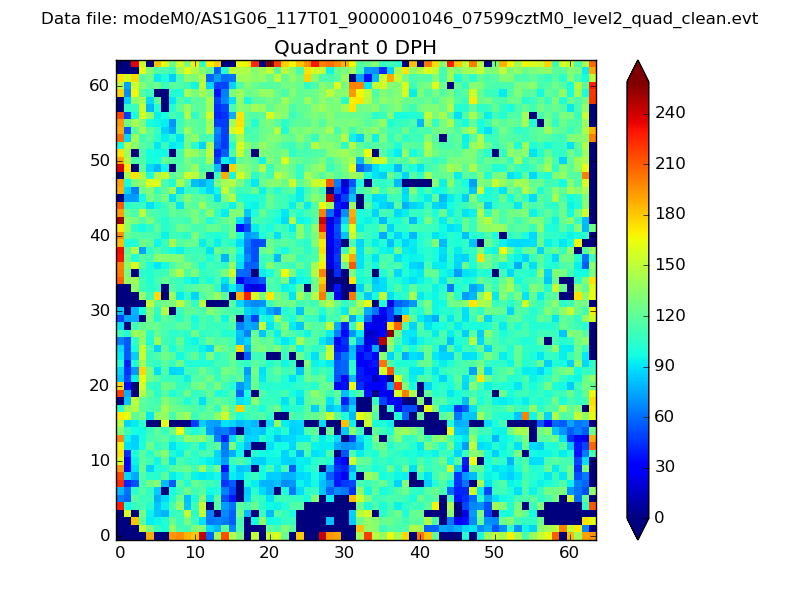 |
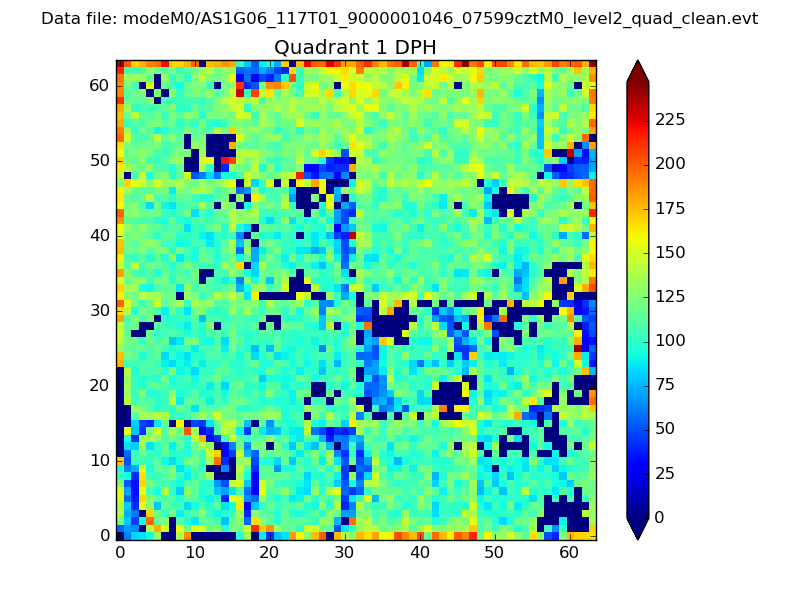 |
Quadrant B |
|---|---|---|---|
| Quadrant D | 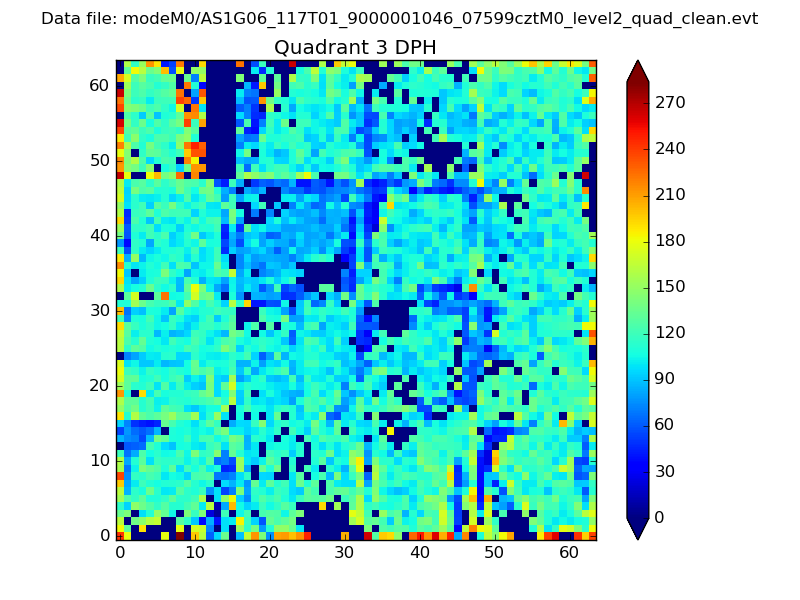 |
 |
Quadrant C |
| Plot type | Count rate plots | Images |
|---|---|---|
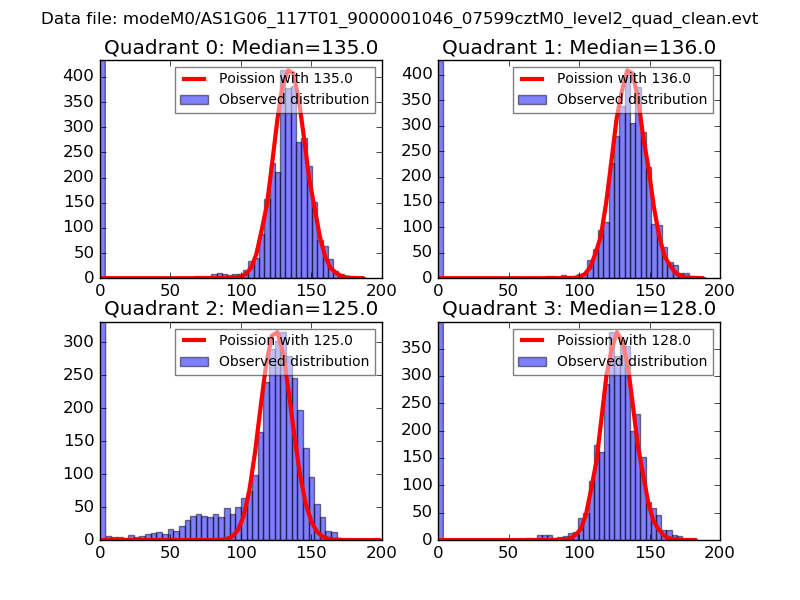
| Comparison with Poisson distribution Blue bars denote a histogram of data divided into 1 sec bins. Red curve is a Poisson curve with rate = median count rate of data. |
 |
 |
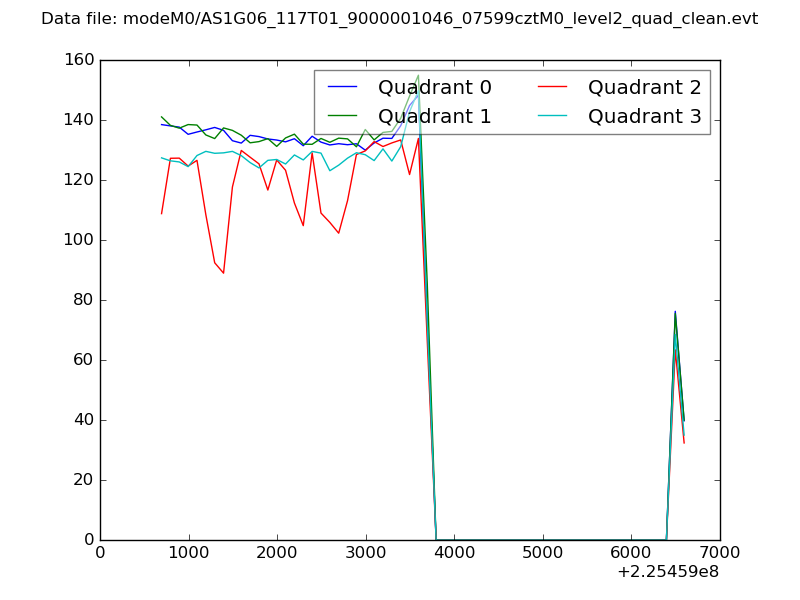
| Quadrant-wise count rates Data is divided into 100 sec bins |
 |
|
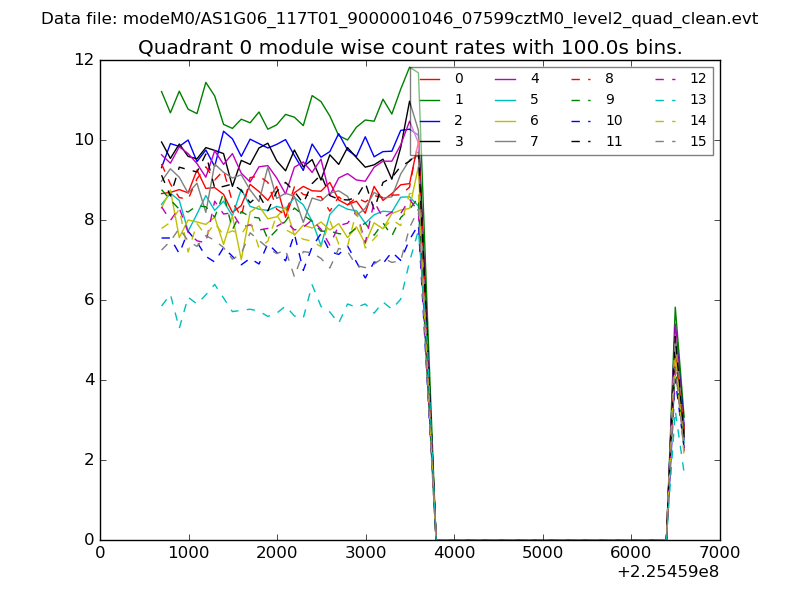
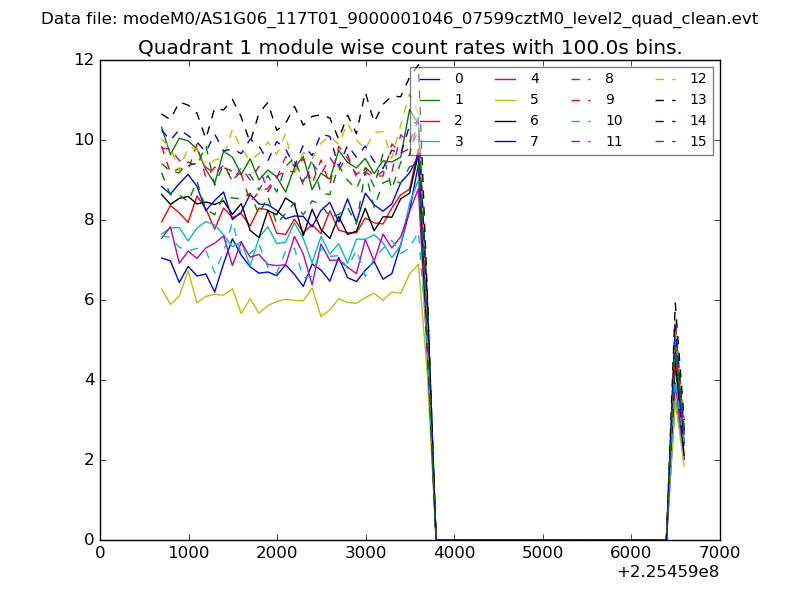
| Module-wise count rates for Quadrant A Data is divided into 100 sec bins |
 |
 |
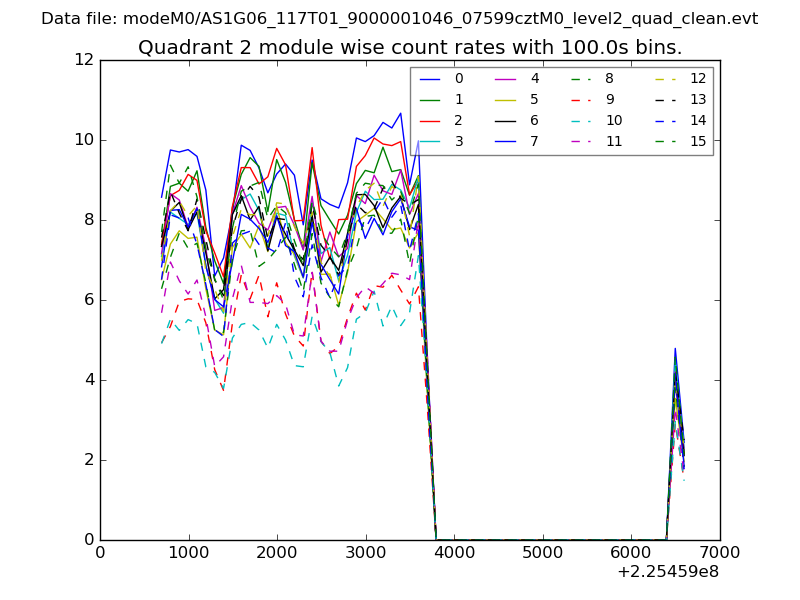
| Module-wise count rates for Quadrant B Data is divided into 100 sec bins |
 |
 |
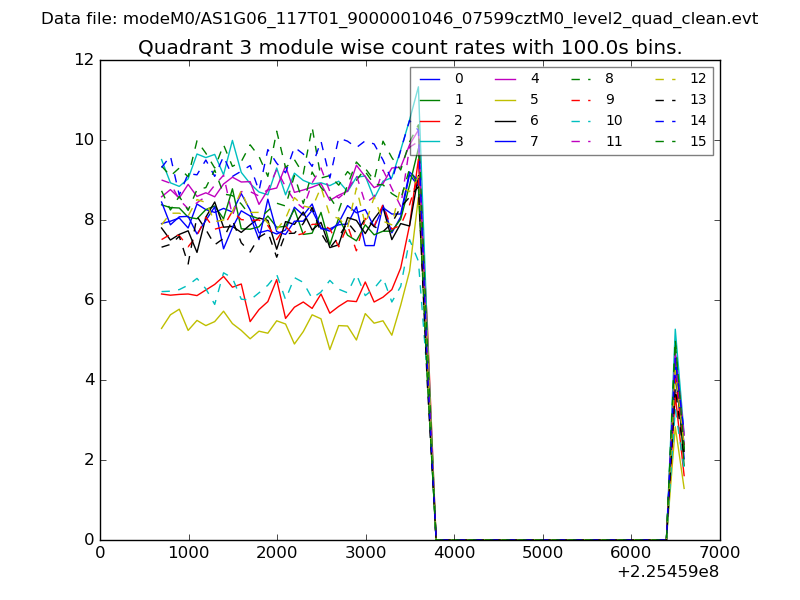
| Module-wise count rates for Quadrant C Data is divided into 100 sec bins |
 |
 |
| Module-wise count rates for Quadrant D Data is divided into 100 sec bins |
 |
 |
| Parameter | Plot |
|---|---|
| CZT HV Monitor | 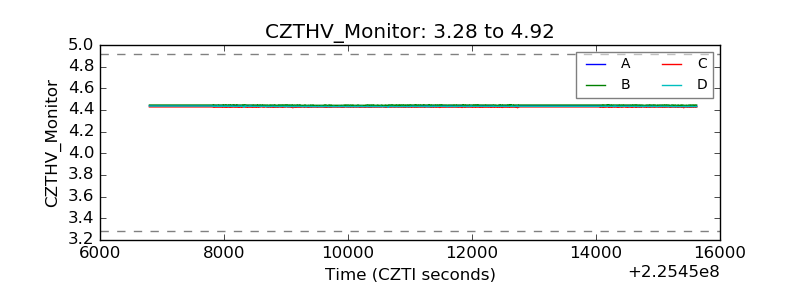 |
| D_VDD | 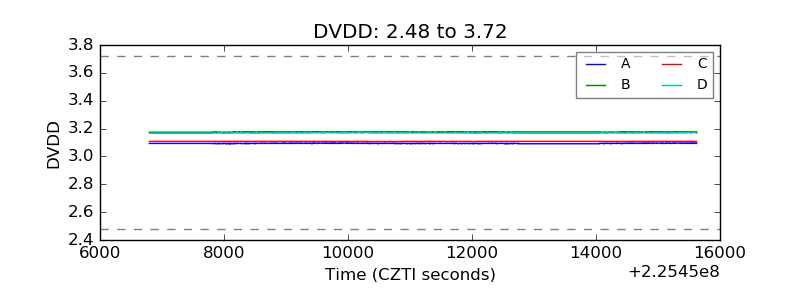 |
| Temperature 1 | 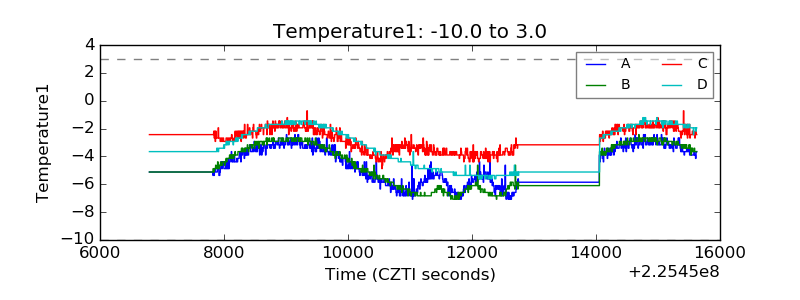 |
| Veto HV Monitor | 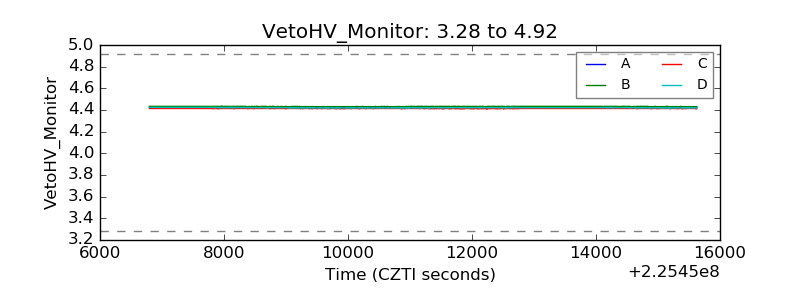 |
| Veto LLD | 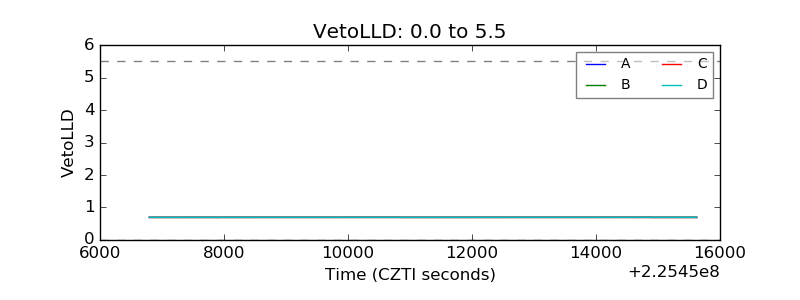 |
| Alpha Counter | 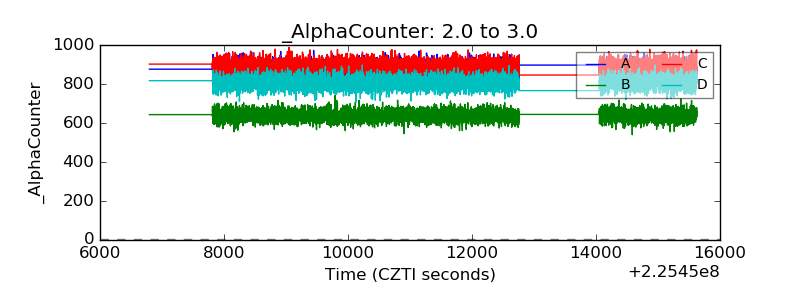 |
| _CPM_Rate | 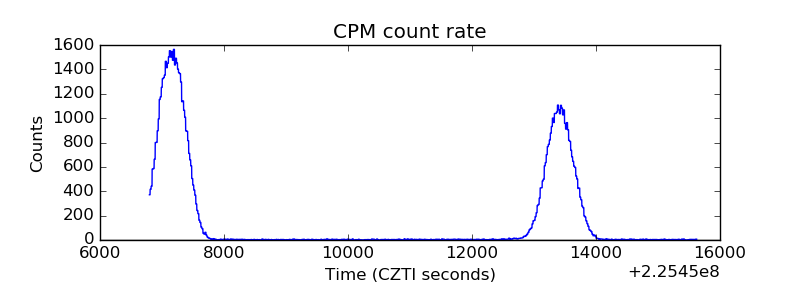 |
| CZT Counter | 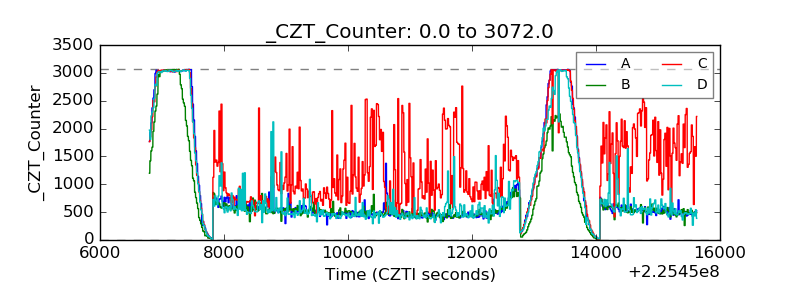 |
| +2.5 Volts monitor |  |
| +5 Volts monitor |  |
| _ROLL_ROT | 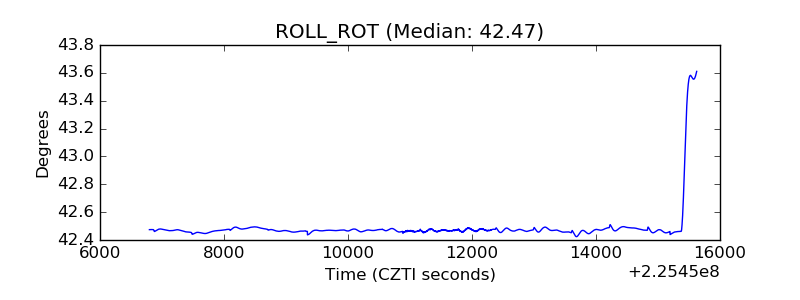 |
| _Roll_DEC |  |
| _Roll_RA | 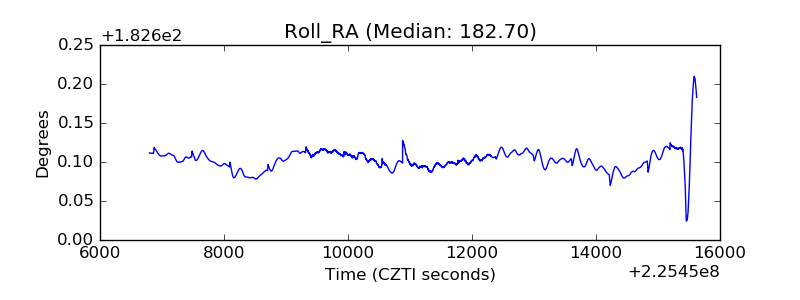 |
| Veto Counter | 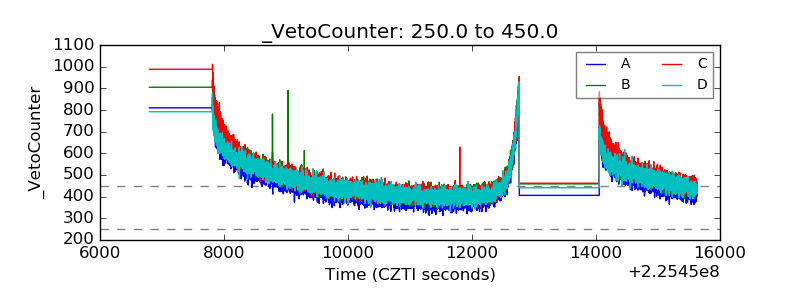 |