| Param | Original file | Final file |
|---|---|---|
| Filename | modeM0/AS1G06_117T01_9000001046_07601cztM0_level2.evt | modeM0/AS1G06_117T01_9000001046_07601cztM0_level2_quad_clean.evt |
| Size (bytes) | 546,269,760 | 88,168,320 |
| Size | 521.0 MB | 84.1 MB |
| Events in quadrant A | 3,068,384 | 559,274 |
| Events in quadrant B | 3,151,424 | 566,899 |
| Events in quadrant C | 5,959,679 | 545,901 |
| Events in quadrant D | 3,915,488 | 535,881 |
| Mode SS | |||
|---|---|---|---|
| Quadrant | BADHDUFLAG | Total packets | Discarded packets |
| A | 0 | 136 | 0 |
| B | 0 | 136 | 0 |
| C | 0 | 136 | 0 |
| D | 0 | 136 | 0 |
| Mode M0 | |||
|---|---|---|---|
| Quadrant | BADHDUFLAG | Total packets | Discarded packets |
| A | 0 | 13539 | 2 |
| B | 0 | 13672 | 1 |
| C | 0 | 22549 | 1 |
| D | 0 | 16140 | 1 |
| Mode M9 | |||
|---|---|---|---|
| Quadrant | BADHDUFLAG | Total packets | Discarded packets |
| A | 0 | 9 | 0 |
| B | 0 | 9 | 0 |
| C | 0 | 9 | 0 |
| D | 0 | 9 | 0 |
| Quadrant | Total seconds | Saturated seconds | Saturation percentage |
|---|---|---|---|
| A | 6628 | 85 | 1.282438% |
| B | 6628 | 98 | 1.478576% |
| C | 6628 | 278 | 4.194327% |
| D | 6628 | 173 | 2.610139% |
Noise dominated data is calculated using 1-second bins in cleaned event files. If a bin has >2000 counts, and if more than 50% of those come from <1% of pixels, then it is considered to be noise-dominated and hence unusable.
| Quadrant | # 1 sec bins | Bins with >0 counts | Bins with >2000 counts | High rate bins dominated by noise | Noise dominated (total time) | Noise dominated (detector-on time) | Marked lightcurve |
|---|---|---|---|---|---|---|---|
| A | 7538 | 6630 | 0 | 0 | 0.00% | 0.00% | 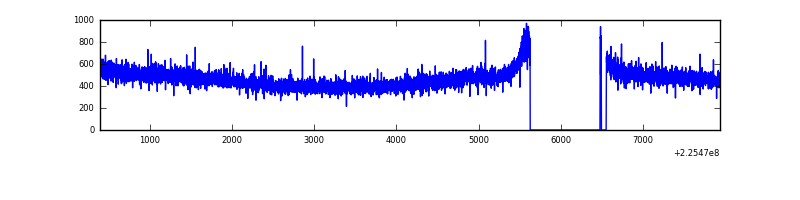 |
| B | 7538 | 6629 | 0 | 0 | 0.00% | 0.00% | 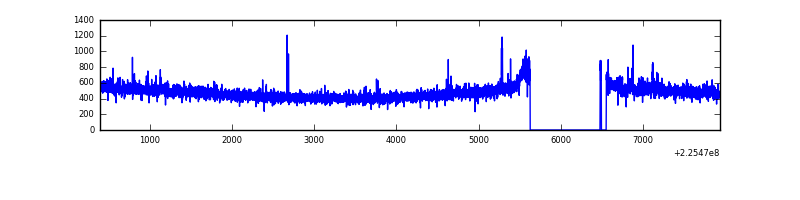 |
| C | 7538 | 6630 | 103 | 103 | 1.37% | 1.55% |  |
| D | 7538 | 6630 | 85 | 85 | 1.13% | 1.28% |  |
Top three noisy pixels from each quadrant. If the there are fewer than three noisy pixels in the level2.evt file, extra rows are filled as -1
| Pixel properties | Quadrant properties | ||||||
|---|---|---|---|---|---|---|---|
| Quadrant | DetID | PixID | Counts | Sigma | Mean | Median | Sigma |
| A | 12 | 194 | 7400 | 40.65 | 796 | 779 | 162.9 |
| A | 0 | 226 | 7338 | 40.27 | 796 | 779 | 162.9 |
| A | 3 | 1 | 4894 | 25.26 | 796 | 779 | 162.9 |
| B | 0 | 214 | 16807 | 104.6 | 801 | 781 | 153.2 |
| B | 12 | 111 | 16100 | 99.98 | 801 | 781 | 153.2 |
| B | 4 | 173 | 13588 | 83.59 | 801 | 781 | 153.2 |
| C | 9 | 68 | 2681143 | 15076.13 | 769 | 772 | 177.8 |
| C | 4 | 254 | 188832 | 1057.77 | 769 | 772 | 177.8 |
| C | 7 | 87 | 70030 | 389.55 | 769 | 772 | 177.8 |
| D | 5 | 233 | 444541 | 2340.45 | 775 | 752 | 189.6 |
| D | 1 | 52 | 146130 | 766.69 | 775 | 752 | 189.6 |
| D | 2 | 152 | 144651 | 758.89 | 775 | 752 | 189.6 |
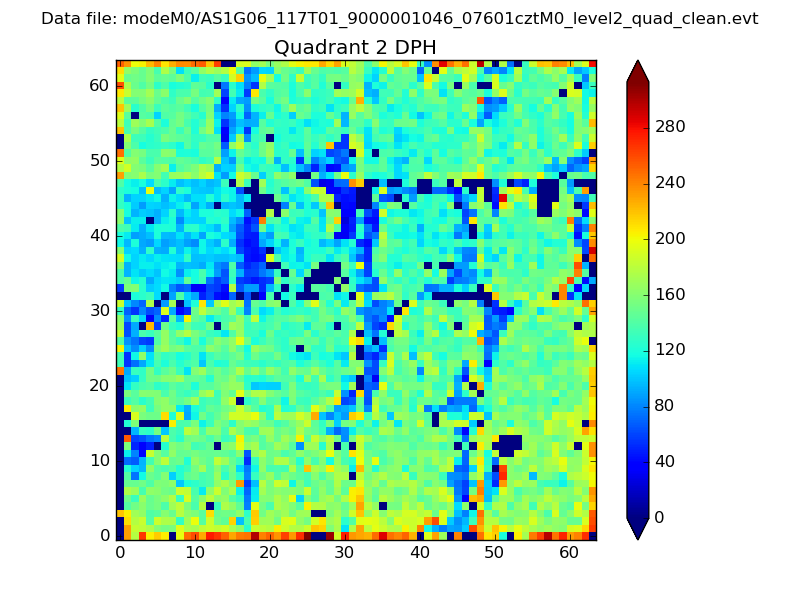
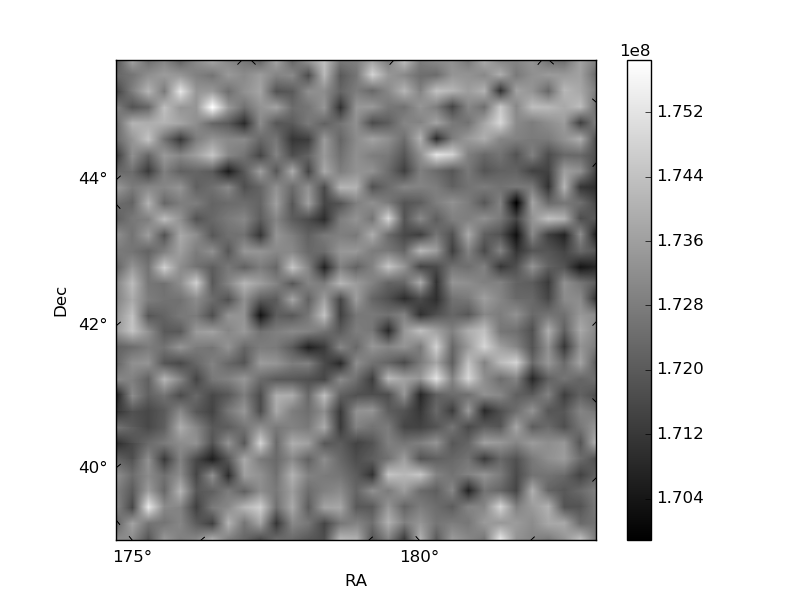
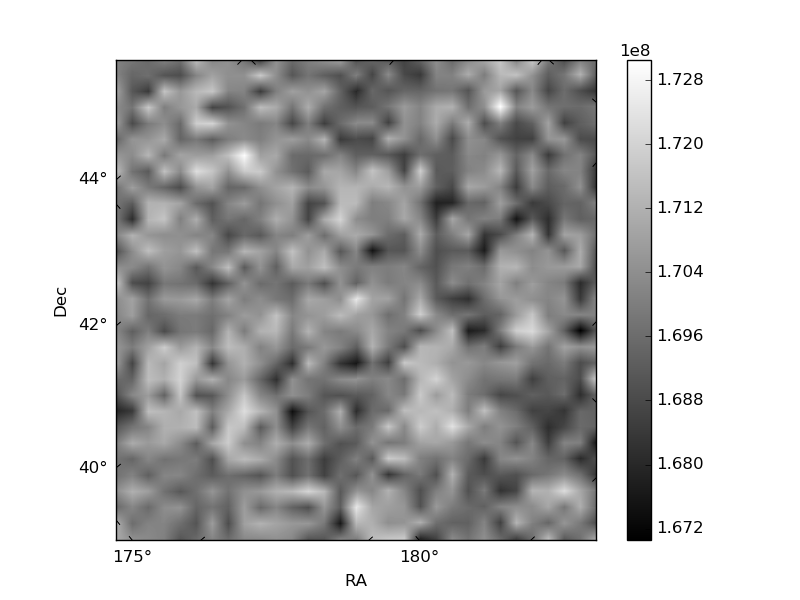
Histogram calculated using DETX and DETY for each event in the final _common_clean file
| Quadrant A | 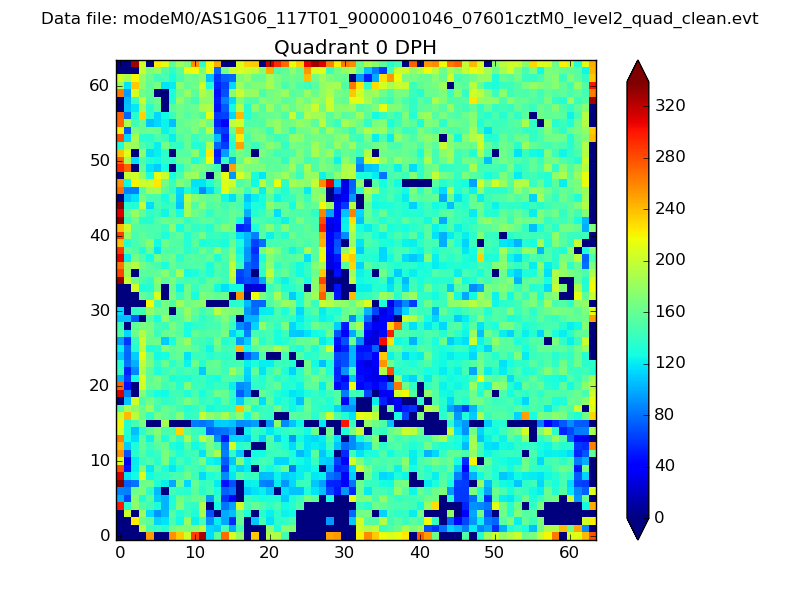 |
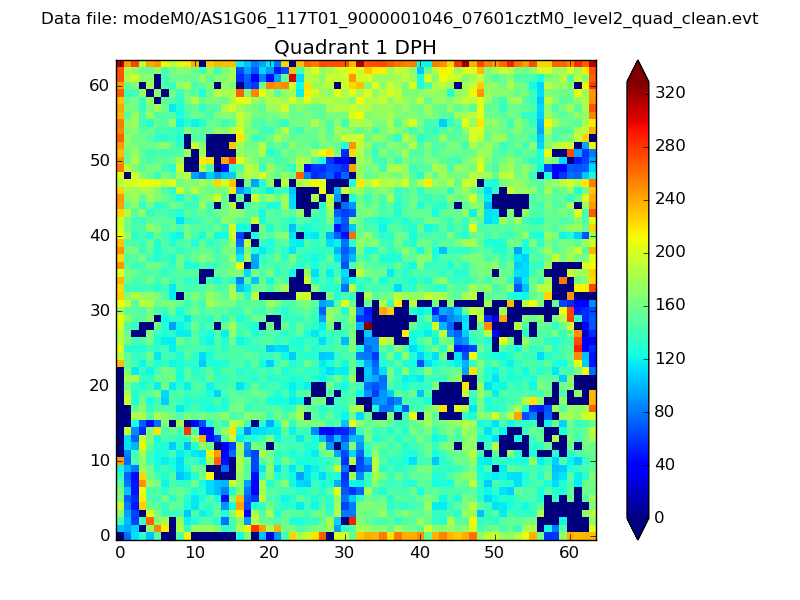 |
Quadrant B |
|---|---|---|---|
| Quadrant D | 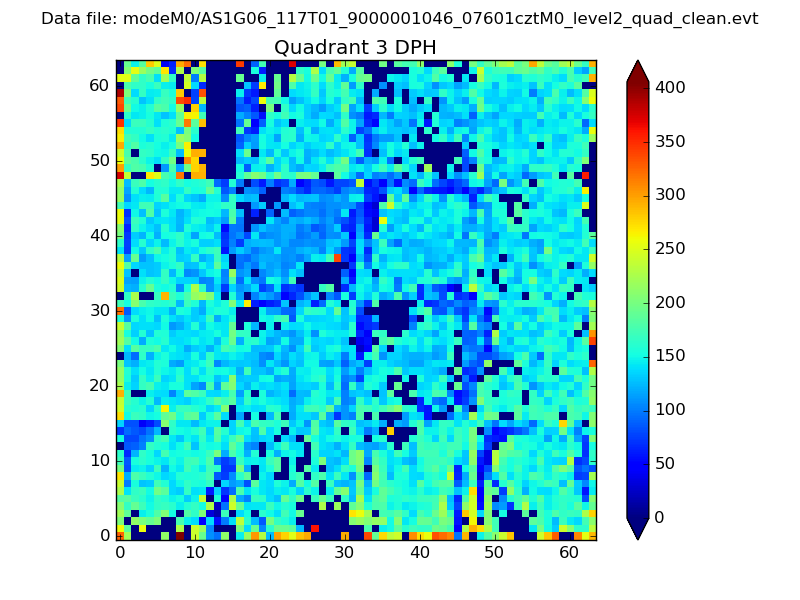 |
 |
Quadrant C |
| Plot type | Count rate plots | Images |
|---|---|---|
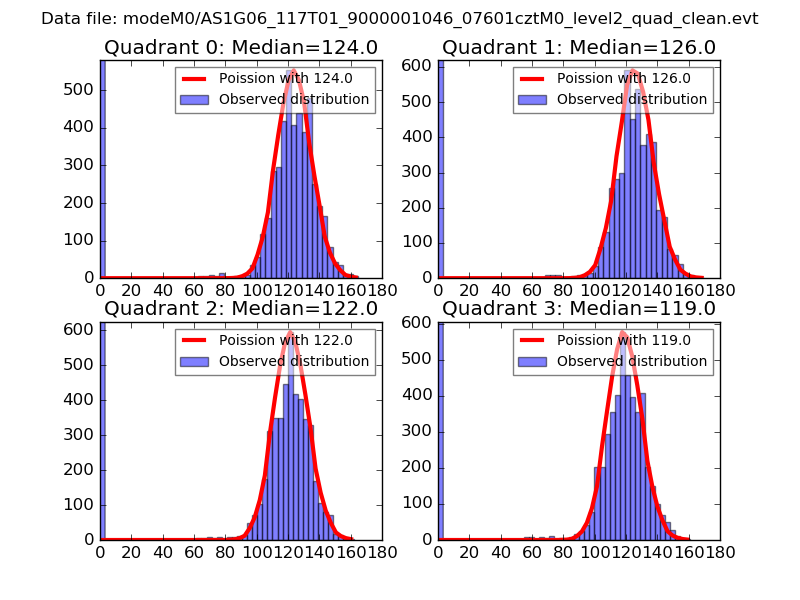
| Comparison with Poisson distribution Blue bars denote a histogram of data divided into 1 sec bins. Red curve is a Poisson curve with rate = median count rate of data. |
 |
 |
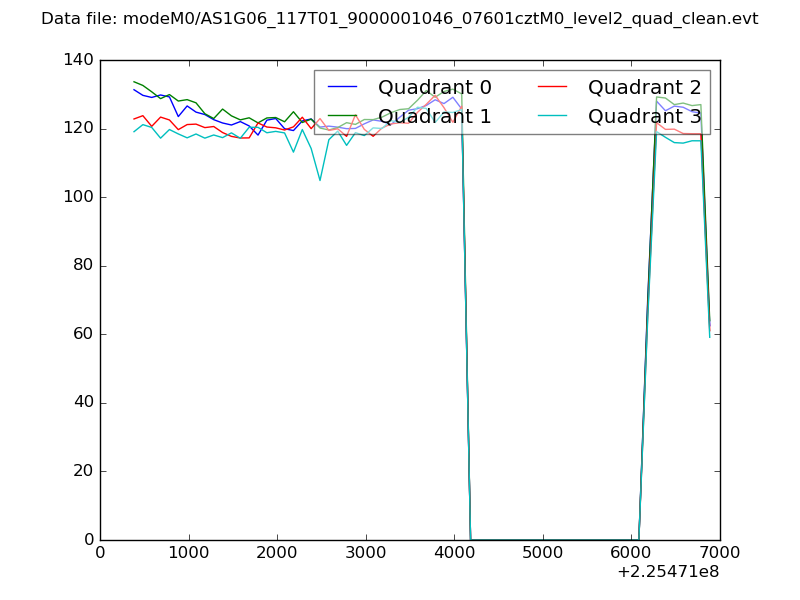
| Quadrant-wise count rates Data is divided into 100 sec bins |
 |
|
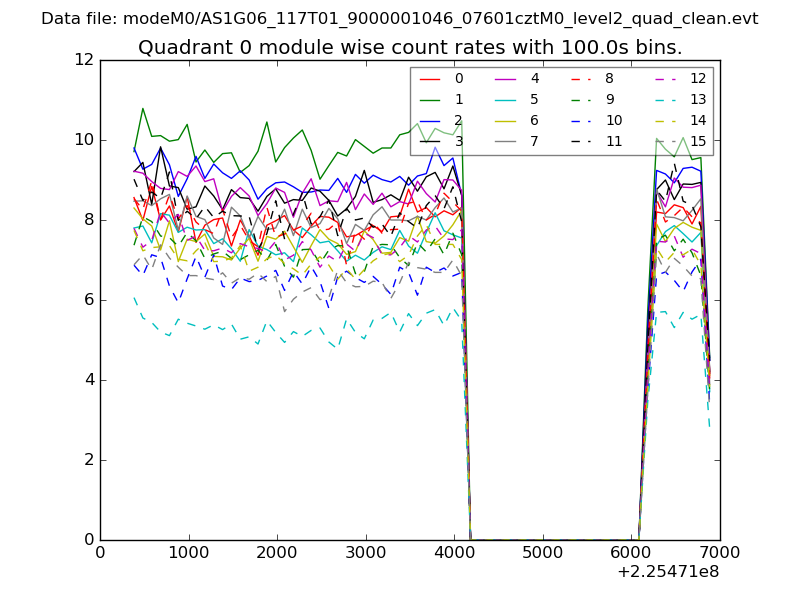
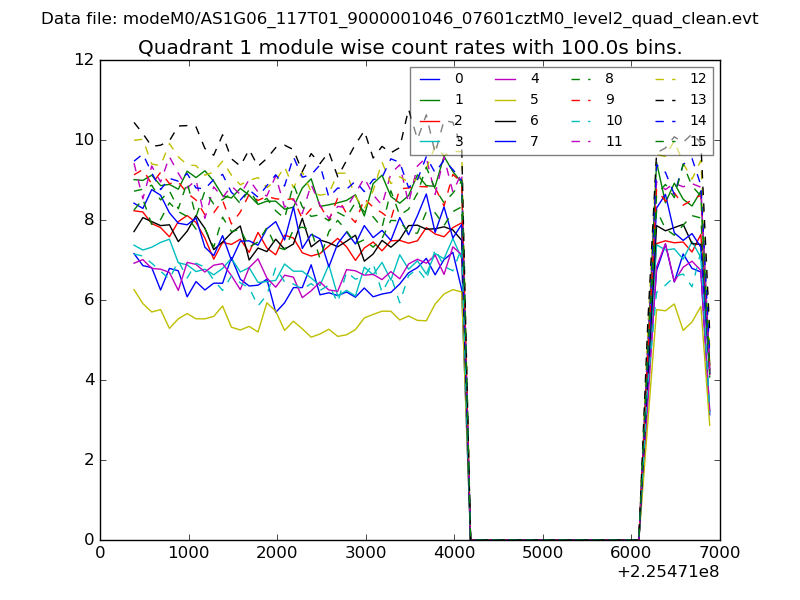
| Module-wise count rates for Quadrant A Data is divided into 100 sec bins |
 |
 |
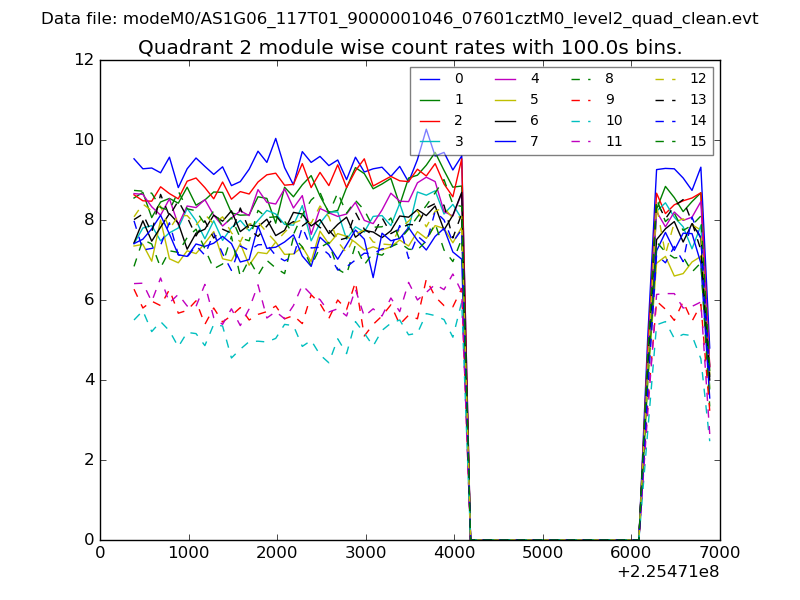
| Module-wise count rates for Quadrant B Data is divided into 100 sec bins |
 |
 |
| Module-wise count rates for Quadrant C Data is divided into 100 sec bins |
 |
 |
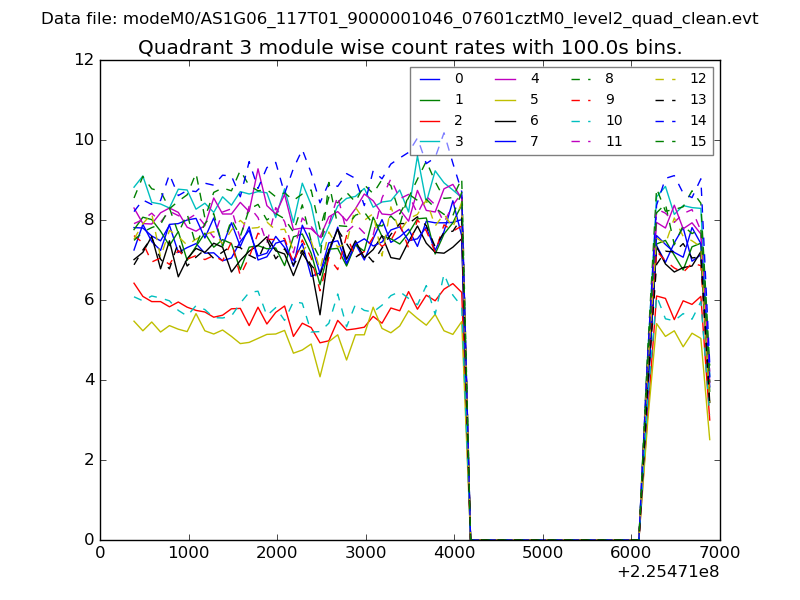
| Module-wise count rates for Quadrant D Data is divided into 100 sec bins |
 |
 |
| Parameter | Plot |
|---|---|
| CZT HV Monitor | 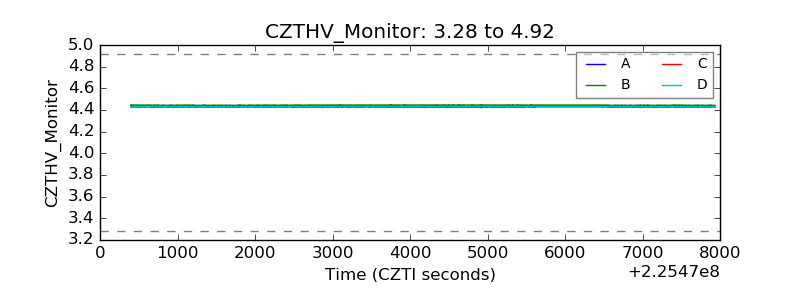 |
| D_VDD | 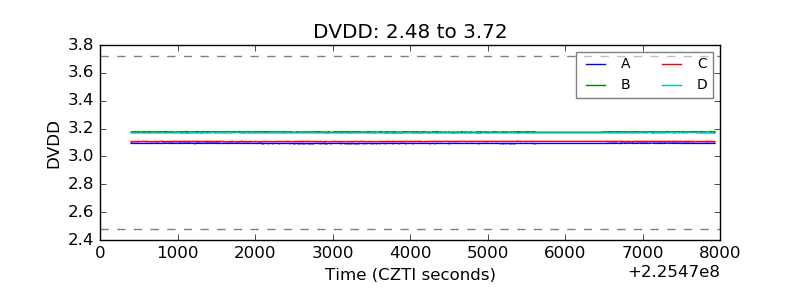 |
| Temperature 1 | 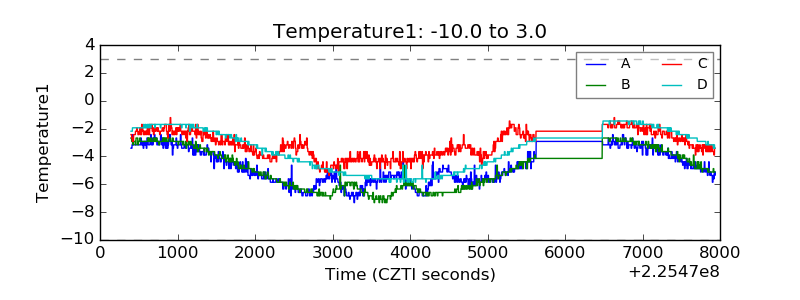 |
| Veto HV Monitor | 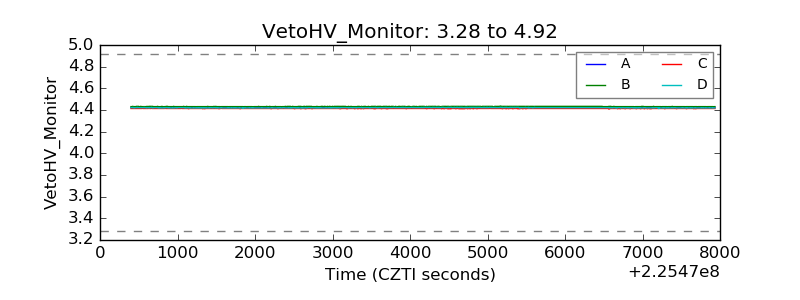 |
| Veto LLD | 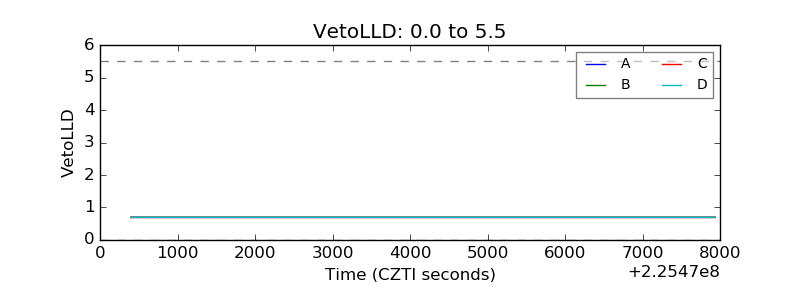 |
| Alpha Counter | 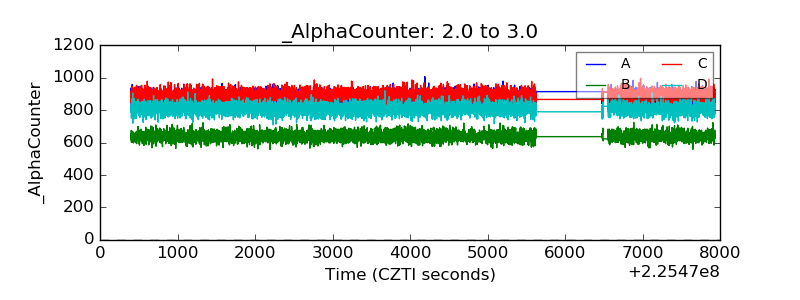 |
| _CPM_Rate | 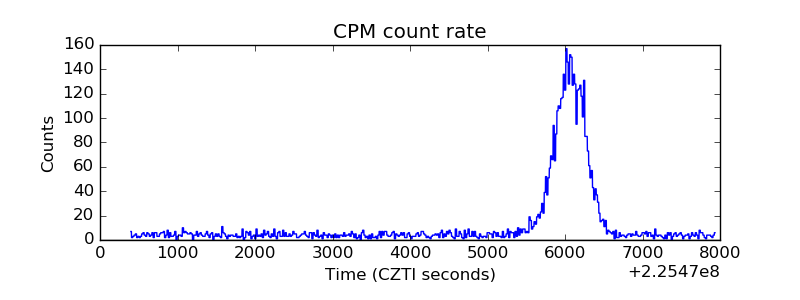 |
| CZT Counter | 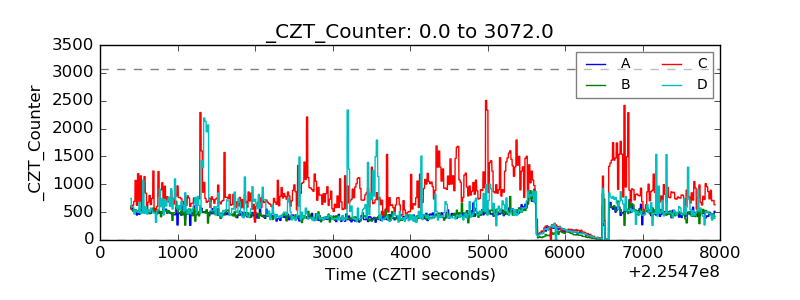 |
| +2.5 Volts monitor |  |
| +5 Volts monitor | 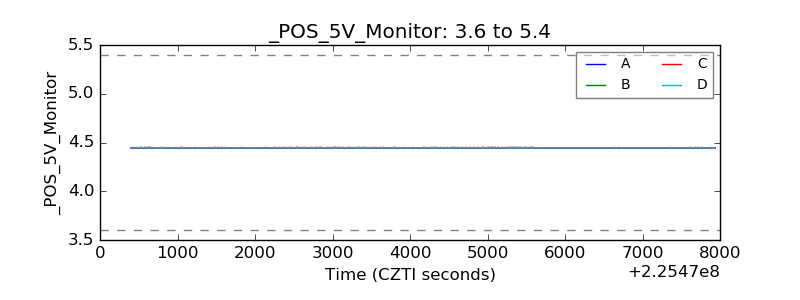 |
| _ROLL_ROT | 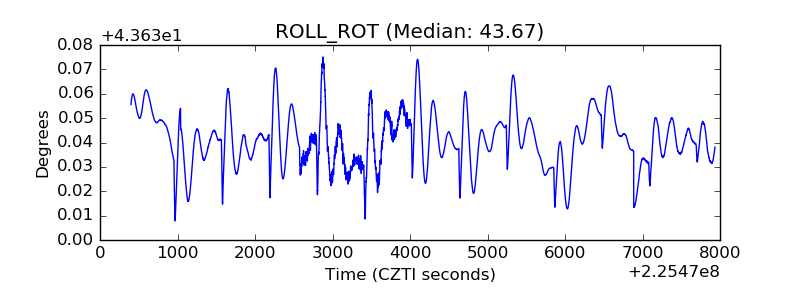 |
| _Roll_DEC | 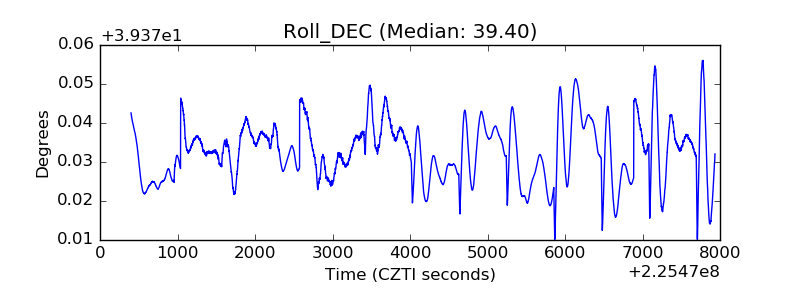 |
| _Roll_RA | 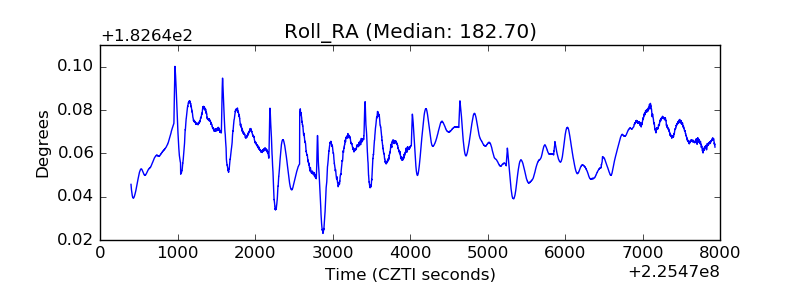 |
| Veto Counter | 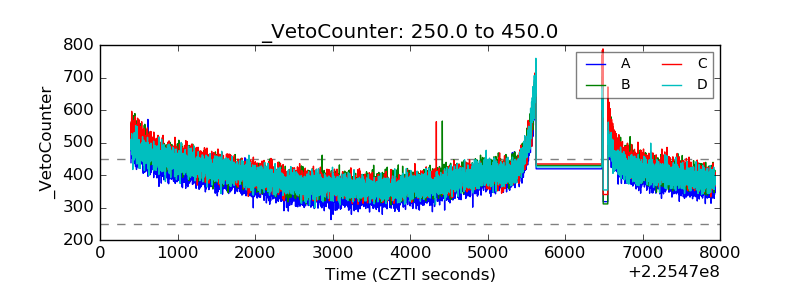 |