| Param | Original file | Final file |
|---|---|---|
| Filename | modeM0/AS1G06_117T01_9000001046_07602cztM0_level2.evt | modeM0/AS1G06_117T01_9000001046_07602cztM0_level2_quad_clean.evt |
| Size (bytes) | 628,945,920 | 93,309,120 |
| Size | 599.8 MB | 89.0 MB |
| Events in quadrant A | 3,476,017 | 588,882 |
| Events in quadrant B | 3,571,372 | 595,578 |
| Events in quadrant C | 6,954,521 | 561,120 |
| Events in quadrant D | 4,541,650 | 562,054 |
| Mode SS | |||
|---|---|---|---|
| Quadrant | BADHDUFLAG | Total packets | Discarded packets |
| A | 0 | 154 | 0 |
| B | 0 | 154 | 0 |
| C | 0 | 154 | 0 |
| D | 0 | 154 | 0 |
| Mode M0 | |||
|---|---|---|---|
| Quadrant | BADHDUFLAG | Total packets | Discarded packets |
| A | 0 | 15437 | 3 |
| B | 0 | 15585 | 2 |
| C | 0 | 25994 | 2 |
| D | 0 | 18586 | 2 |
| Mode M9 | |||
|---|---|---|---|
| Quadrant | BADHDUFLAG | Total packets | Discarded packets |
| A | 0 | 14 | 0 |
| B | 0 | 14 | 0 |
| C | 0 | 14 | 0 |
| D | 0 | 14 | 0 |
| Quadrant | Total seconds | Saturated seconds | Saturation percentage |
|---|---|---|---|
| A | 7446 | 102 | 1.369863% |
| B | 7446 | 123 | 1.651894% |
| C | 7446 | 657 | 8.823529% |
| D | 7446 | 327 | 4.391620% |
Noise dominated data is calculated using 1-second bins in cleaned event files. If a bin has >2000 counts, and if more than 50% of those come from <1% of pixels, then it is considered to be noise-dominated and hence unusable.
| Quadrant | # 1 sec bins | Bins with >0 counts | Bins with >2000 counts | High rate bins dominated by noise | Noise dominated (total time) | Noise dominated (detector-on time) | Marked lightcurve |
|---|---|---|---|---|---|---|---|
| A | 8851 | 7449 | 0 | 0 | 0.00% | 0.00% | 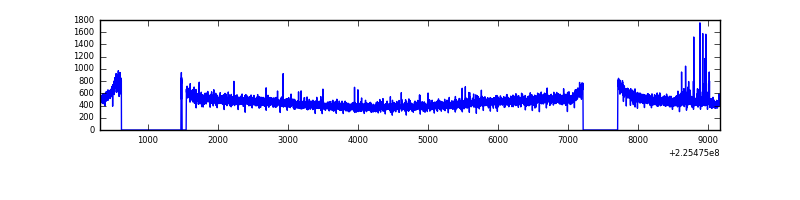 |
| B | 8851 | 7448 | 0 | 0 | 0.00% | 0.00% | 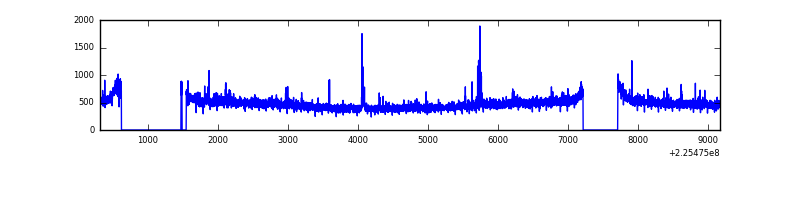 |
| C | 8851 | 7449 | 385 | 385 | 4.35% | 5.17% | 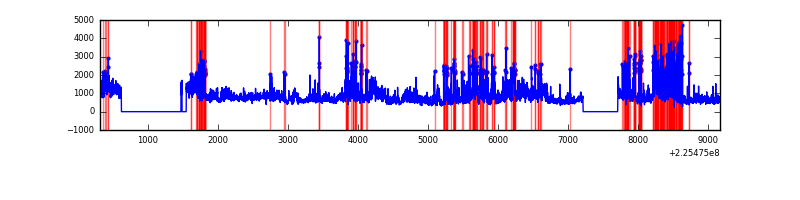 |
| D | 8851 | 7449 | 179 | 179 | 2.02% | 2.40% | 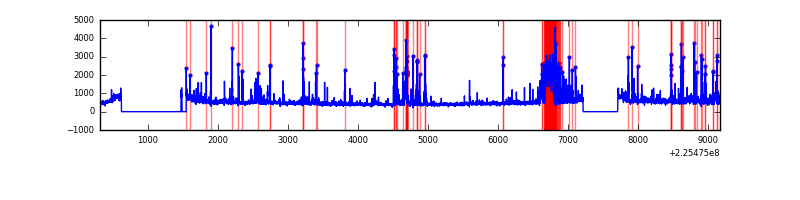 |
Top three noisy pixels from each quadrant. If the there are fewer than three noisy pixels in the level2.evt file, extra rows are filled as -1
| Pixel properties | Quadrant properties | ||||||
|---|---|---|---|---|---|---|---|
| Quadrant | DetID | PixID | Counts | Sigma | Mean | Median | Sigma |
| A | 15 | 239 | 29415 | 156.41 | 895 | 875 | 182.5 |
| A | 0 | 226 | 8392 | 41.2 | 895 | 875 | 182.5 |
| A | 12 | 194 | 8100 | 39.59 | 895 | 875 | 182.5 |
| B | 4 | 80 | 34326 | 193.42 | 900 | 876 | 172.9 |
| B | 4 | 173 | 22899 | 127.34 | 900 | 876 | 172.9 |
| B | 12 | 111 | 18493 | 101.87 | 900 | 876 | 172.9 |
| C | 9 | 68 | 2553226 | 12864.35 | 847 | 850 | 198.4 |
| C | 4 | 254 | 1018668 | 5129.95 | 847 | 850 | 198.4 |
| C | 7 | 87 | 70479 | 350.94 | 847 | 850 | 198.4 |
| D | 2 | 152 | 489380 | 2331.41 | 861 | 833 | 209.5 |
| D | 1 | 52 | 215249 | 1023.22 | 861 | 833 | 209.5 |
| D | 12 | 233 | 173358 | 823.31 | 861 | 833 | 209.5 |
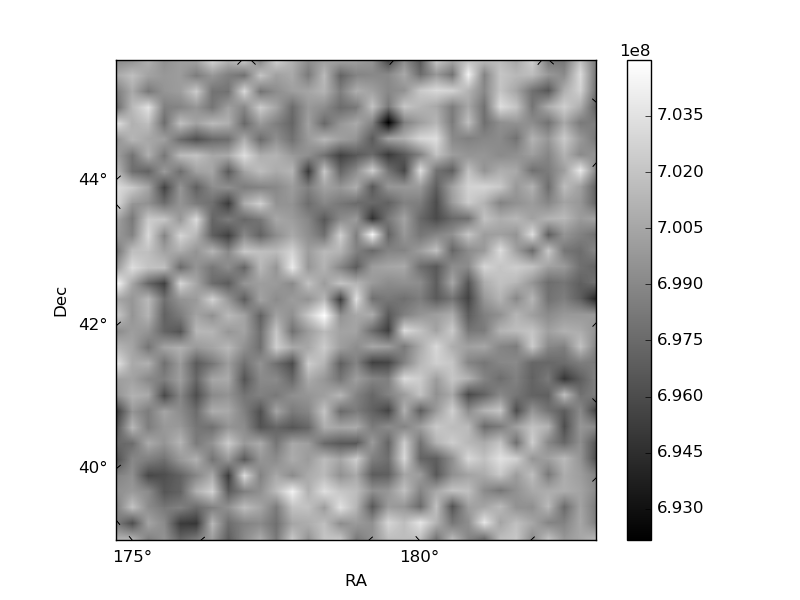
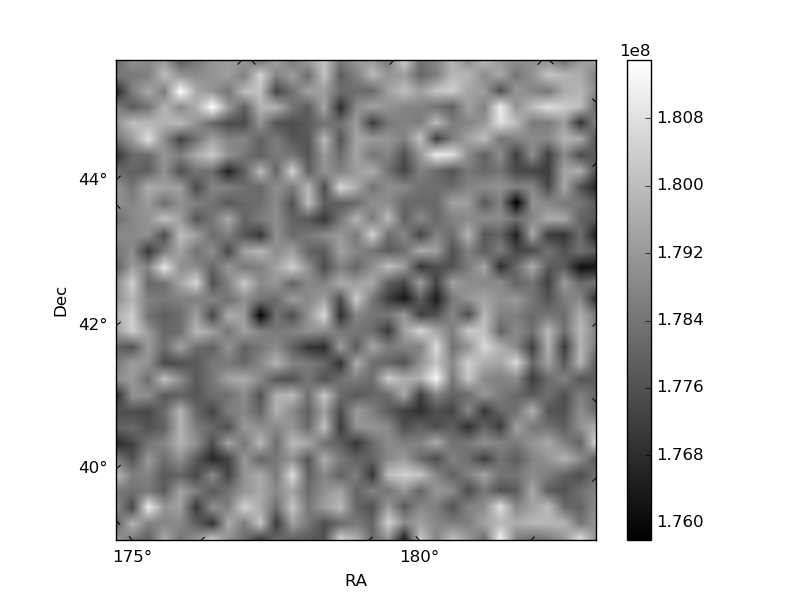
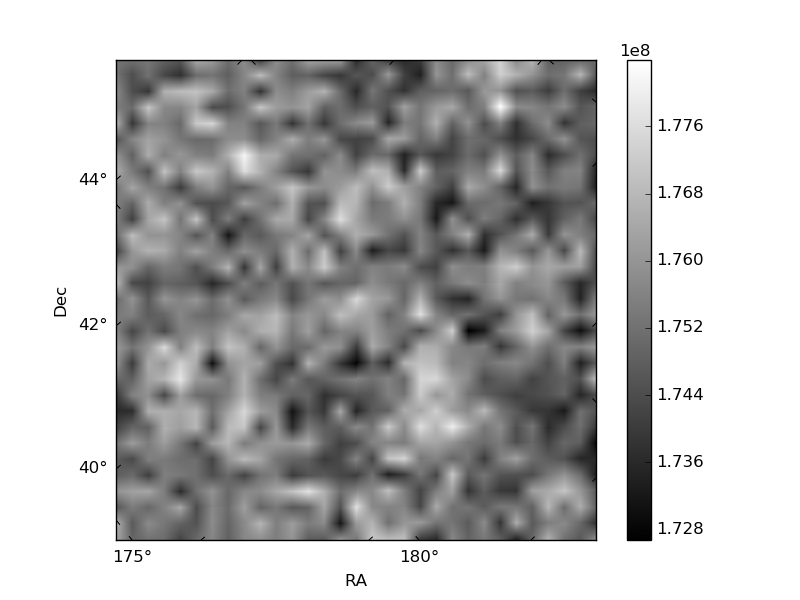
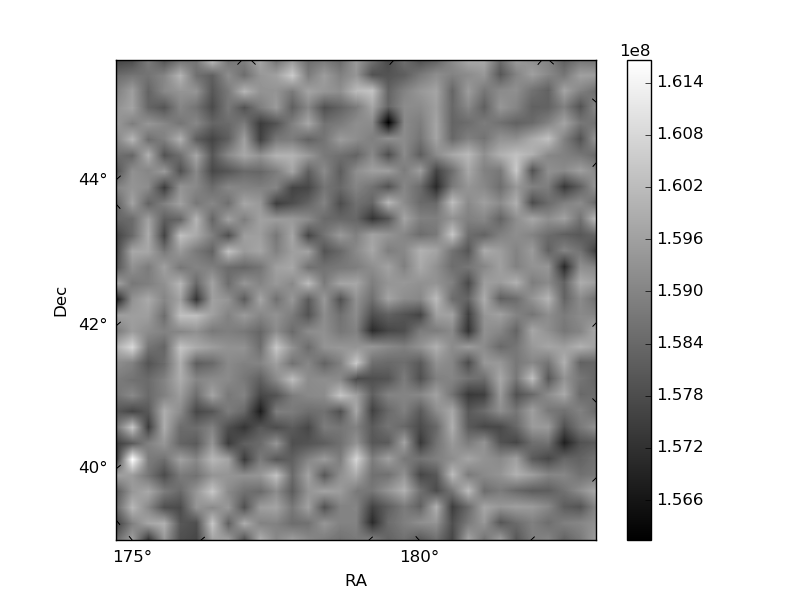
Histogram calculated using DETX and DETY for each event in the final _common_clean file
| Quadrant A | 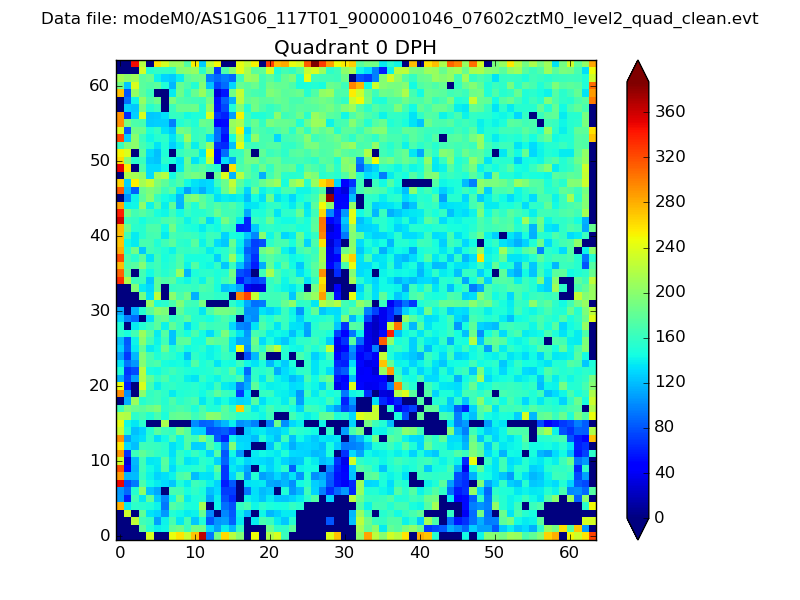 |
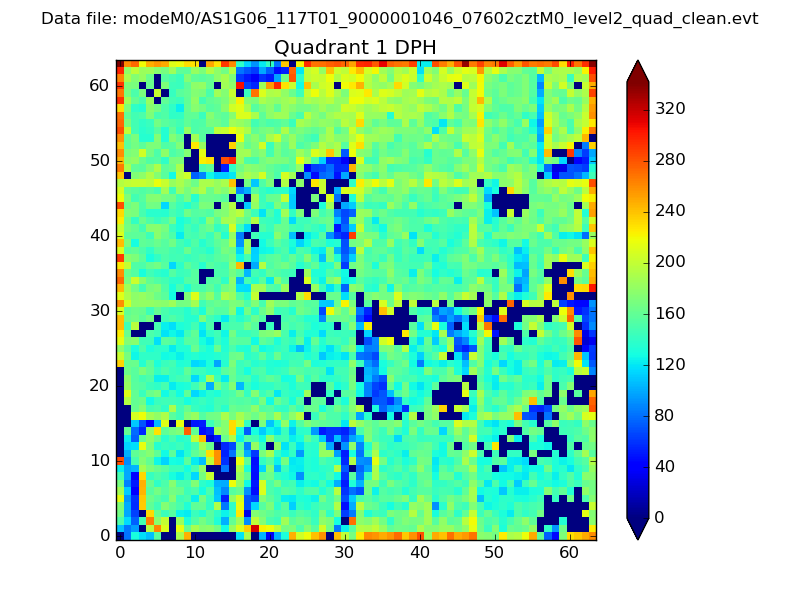 |
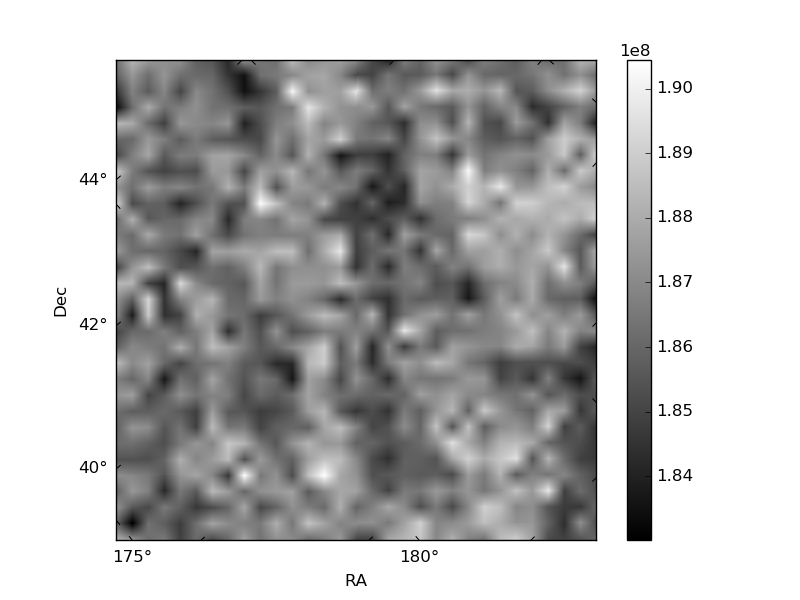
Quadrant B |
|---|---|---|---|
| Quadrant D | 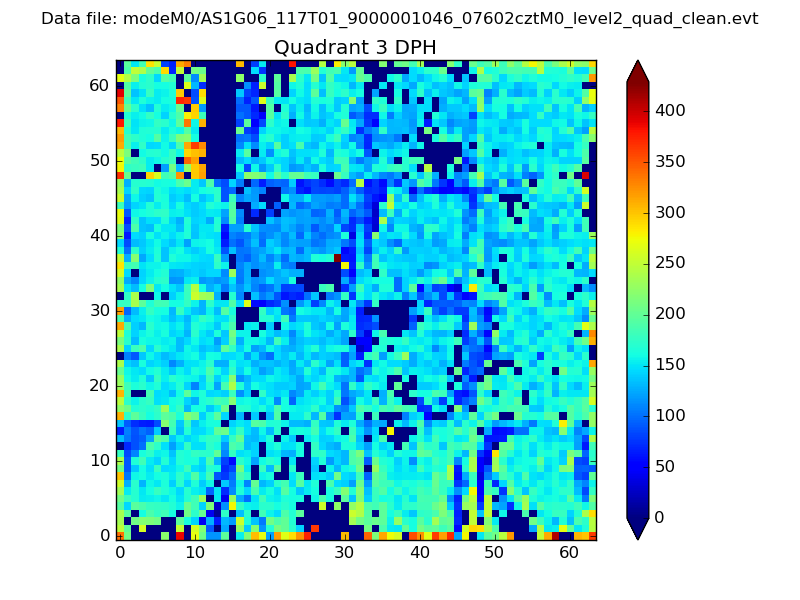 |
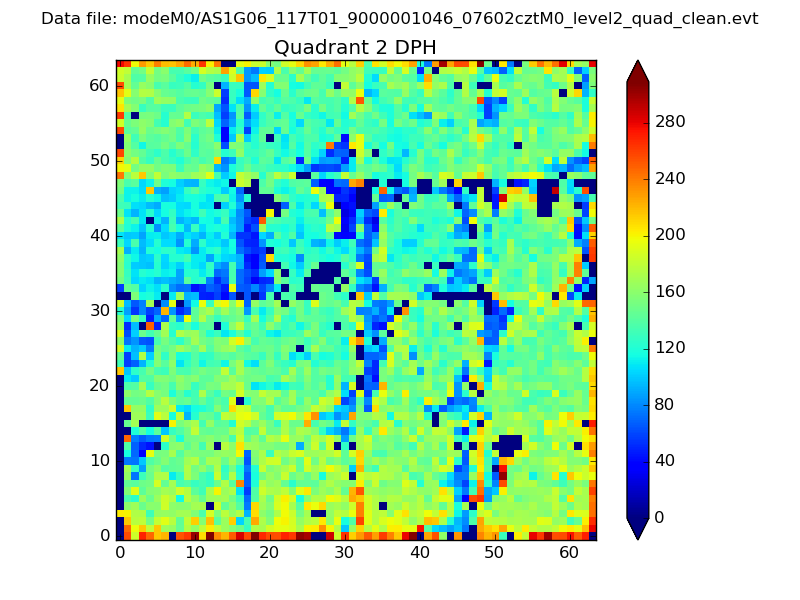 |
Quadrant C |
| Plot type | Count rate plots | Images |
|---|---|---|
| Comparison with Poisson distribution Blue bars denote a histogram of data divided into 1 sec bins. Red curve is a Poisson curve with rate = median count rate of data. |
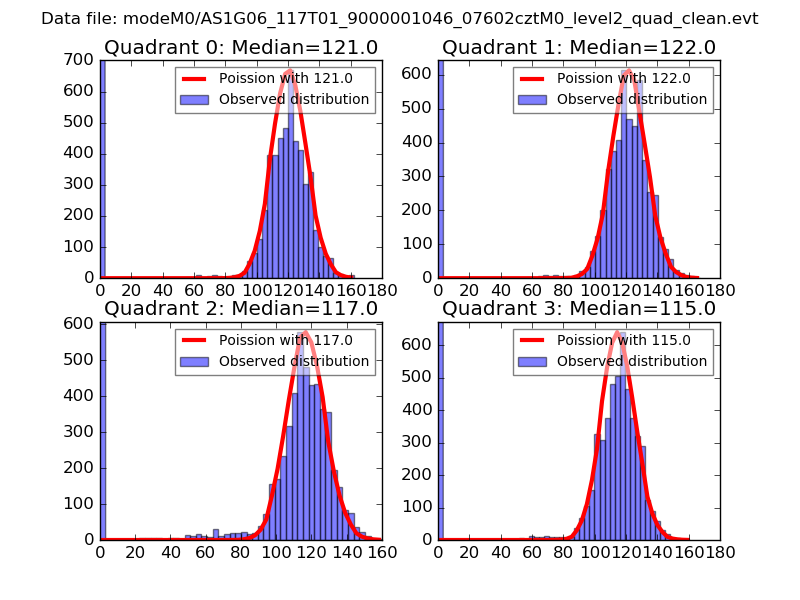 |
 |
| Quadrant-wise count rates Data is divided into 100 sec bins |
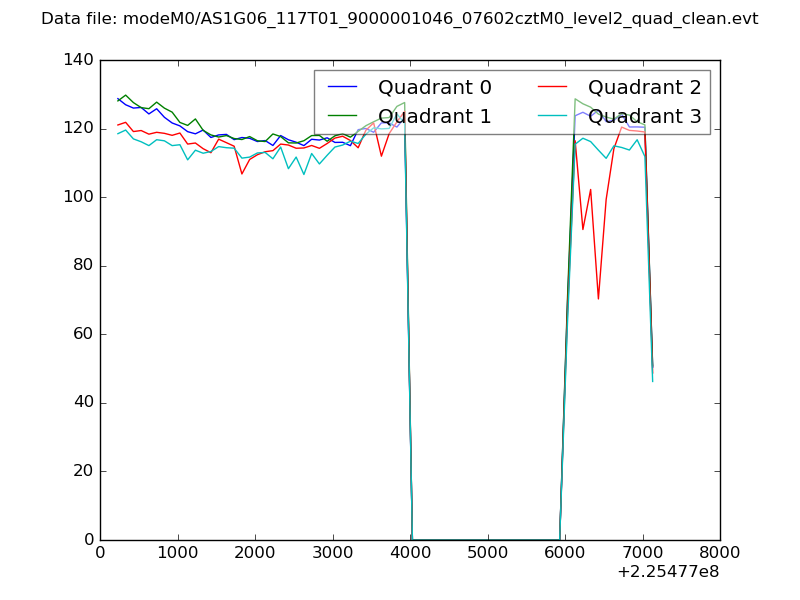 |
|
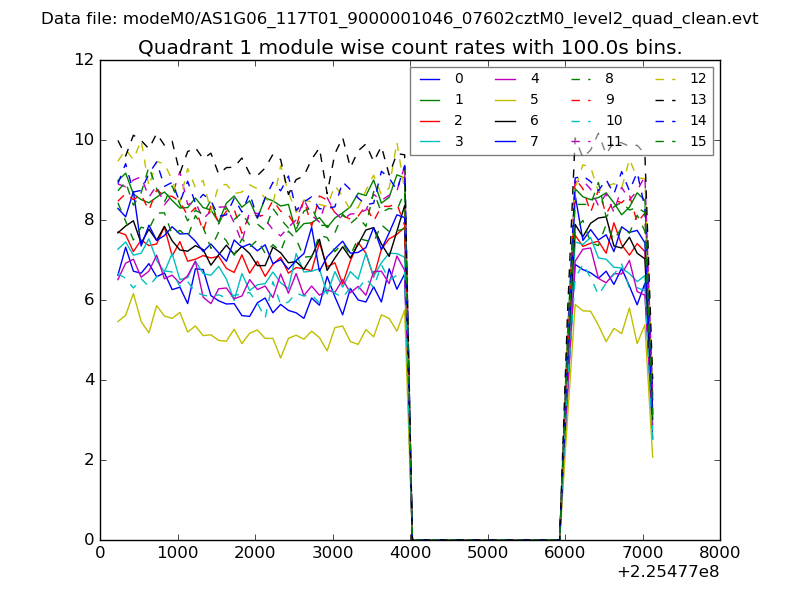
| Module-wise count rates for Quadrant A Data is divided into 100 sec bins |
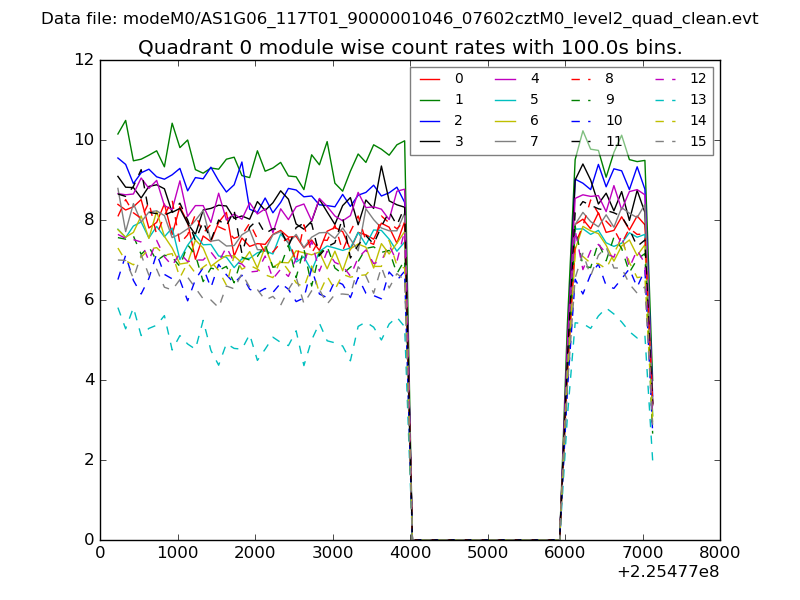 |
 |
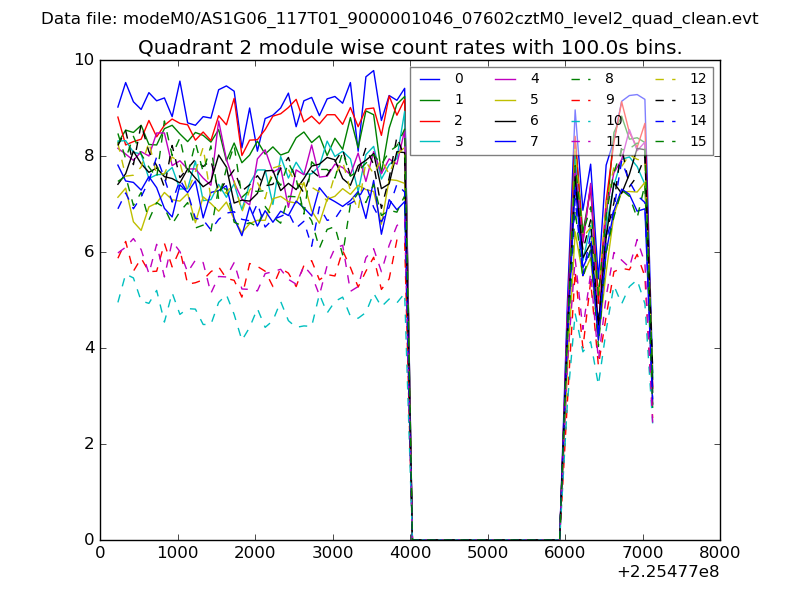
| Module-wise count rates for Quadrant B Data is divided into 100 sec bins |
 |
 |
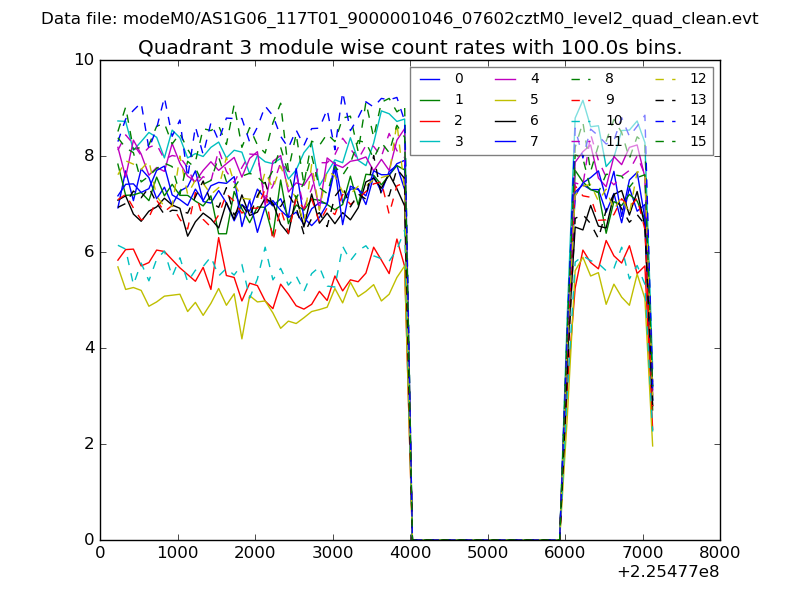
| Module-wise count rates for Quadrant C Data is divided into 100 sec bins |
 |
 |
| Module-wise count rates for Quadrant D Data is divided into 100 sec bins |
 |
 |
| Parameter | Plot |
|---|---|
| CZT HV Monitor | 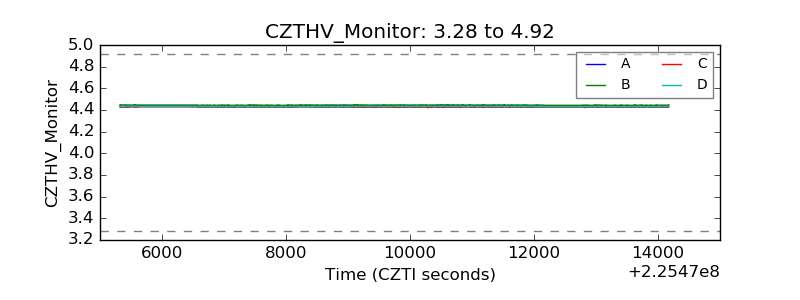 |
| D_VDD | 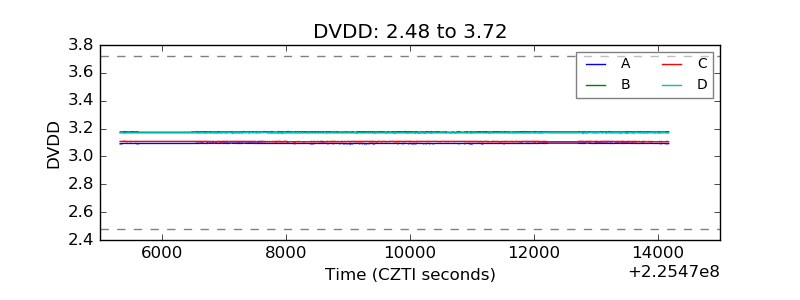 |
| Temperature 1 |  |
| Veto HV Monitor | 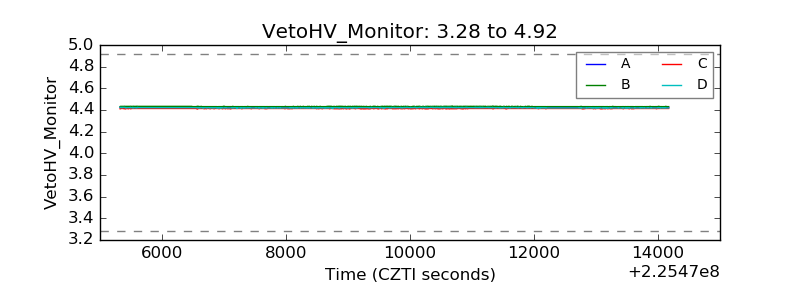 |
| Veto LLD | 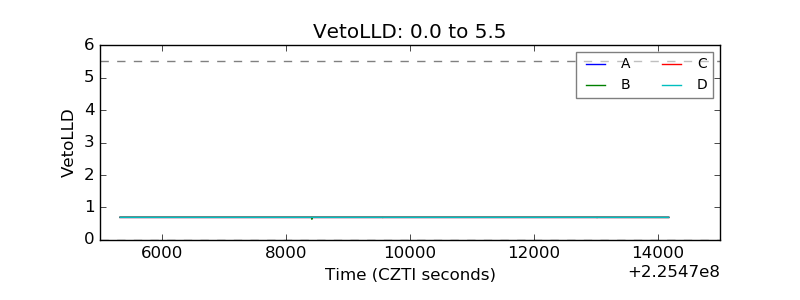 |
| Alpha Counter | 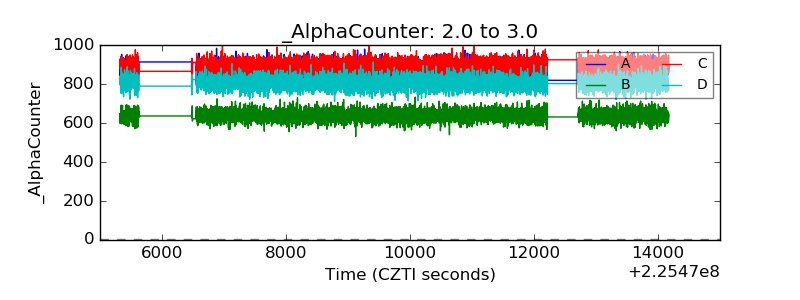 |
| _CPM_Rate | 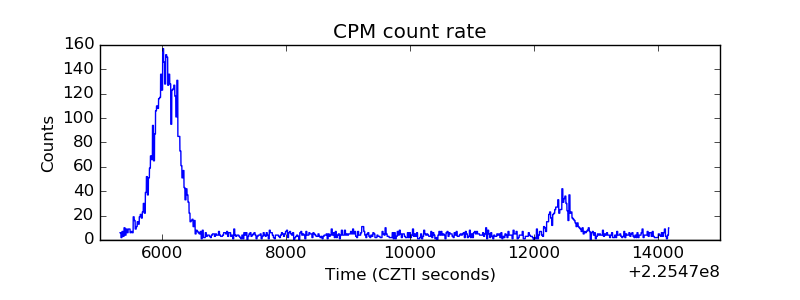 |
| CZT Counter | 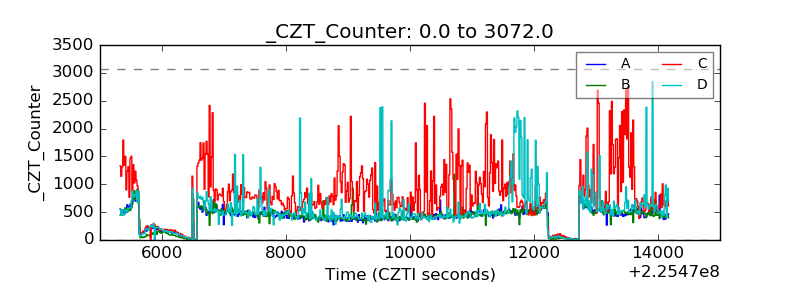 |
| +2.5 Volts monitor |  |
| +5 Volts monitor |  |
| _ROLL_ROT | 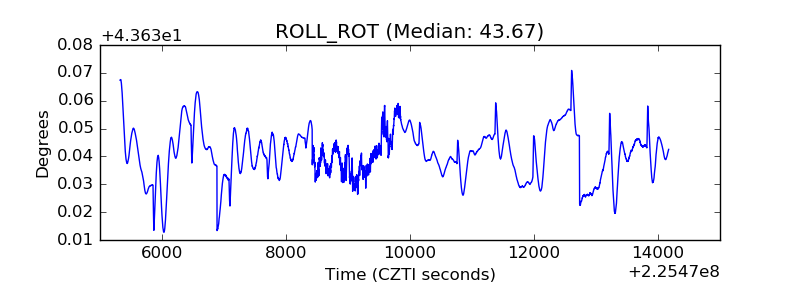 |
| _Roll_DEC |  |
| _Roll_RA | 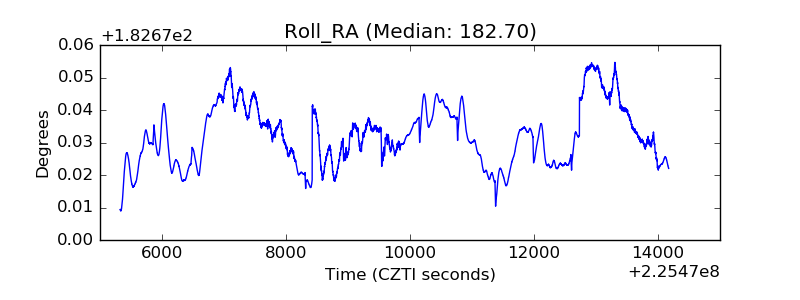 |
| Veto Counter | 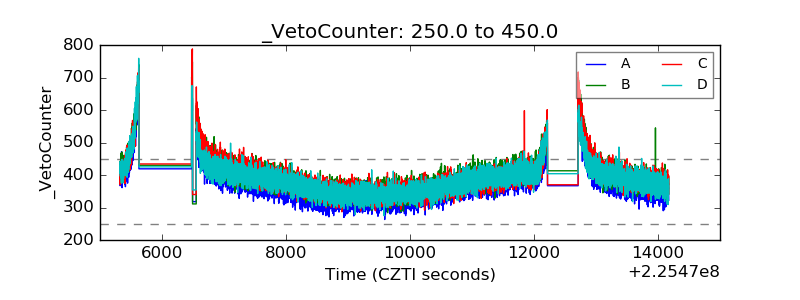 |