| Param | Original file | Final file |
|---|---|---|
| Filename | modeM0/AS1G06_117T01_9000001046_07603cztM0_level2.evt | modeM0/AS1G06_117T01_9000001046_07603cztM0_level2_quad_clean.evt |
| Size (bytes) | 616,196,160 | 99,817,920 |
| Size | 587.7 MB | 95.2 MB |
| Events in quadrant A | 4,432,151 | 627,322 |
| Events in quadrant B | 3,550,493 | 647,142 |
| Events in quadrant C | 5,714,592 | 616,678 |
| Events in quadrant D | 4,454,599 | 607,919 |
| Mode SS | |||
|---|---|---|---|
| Quadrant | BADHDUFLAG | Total packets | Discarded packets |
| A | 0 | 154 | 0 |
| B | 0 | 154 | 0 |
| C | 0 | 154 | 0 |
| D | 0 | 154 | 0 |
| Mode M0 | |||
|---|---|---|---|
| Quadrant | BADHDUFLAG | Total packets | Discarded packets |
| A | 0 | 18360 | 3 |
| B | 0 | 15681 | 2 |
| C | 0 | 22006 | 2 |
| D | 0 | 18512 | 2 |
| Mode M9 | |||
|---|---|---|---|
| Quadrant | BADHDUFLAG | Total packets | Discarded packets |
| A | 0 | 2 | 0 |
| B | 0 | 2 | 0 |
| C | 0 | 2 | 0 |
| D | 0 | 2 | 0 |
| Quadrant | Total seconds | Saturated seconds | Saturation percentage |
|---|---|---|---|
| A | 7520 | 248 | 3.297872% |
| B | 7520 | 27 | 0.359043% |
| C | 7520 | 402 | 5.345745% |
| D | 7520 | 155 | 2.061170% |
Noise dominated data is calculated using 1-second bins in cleaned event files. If a bin has >2000 counts, and if more than 50% of those come from <1% of pixels, then it is considered to be noise-dominated and hence unusable.
| Quadrant | # 1 sec bins | Bins with >0 counts | Bins with >2000 counts | High rate bins dominated by noise | Noise dominated (total time) | Noise dominated (detector-on time) | Marked lightcurve |
|---|---|---|---|---|---|---|---|
| A | 7760 | 7522 | 190 | 190 | 2.45% | 2.53% | 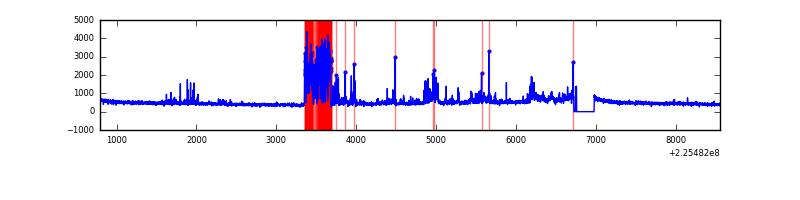 |
| B | 7760 | 7522 | 0 | 0 | 0.00% | 0.00% | 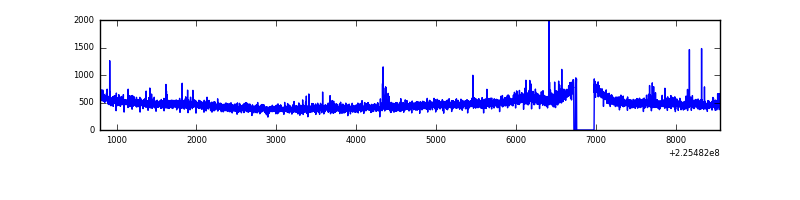 |
| C | 7760 | 7522 | 285 | 285 | 3.67% | 3.79% | 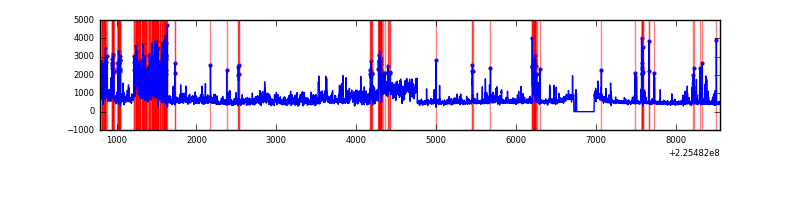 |
| D | 7760 | 7522 | 92 | 92 | 1.19% | 1.22% | 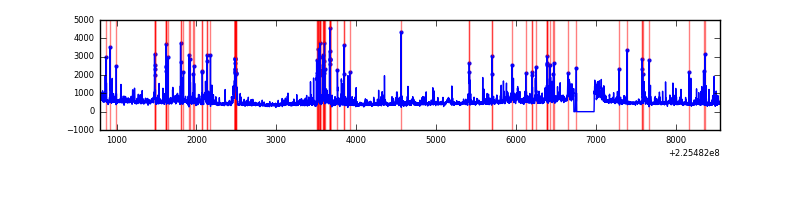 |
Top three noisy pixels from each quadrant. If the there are fewer than three noisy pixels in the level2.evt file, extra rows are filled as -1
| Pixel properties | Quadrant properties | ||||||
|---|---|---|---|---|---|---|---|
| Quadrant | DetID | PixID | Counts | Sigma | Mean | Median | Sigma |
| A | 15 | 239 | 1060552 | 5977.54 | 874 | 853 | 177.3 |
| A | 0 | 226 | 8174 | 41.29 | 874 | 853 | 177.3 |
| A | 12 | 194 | 7879 | 39.63 | 874 | 853 | 177.3 |
| B | 0 | 214 | 43881 | 251.52 | 891 | 871 | 171.0 |
| B | 0 | 219 | 21537 | 120.85 | 891 | 871 | 171.0 |
| B | 12 | 111 | 18196 | 101.31 | 891 | 871 | 171.0 |
| C | 9 | 68 | 1283619 | 6497.01 | 846 | 849 | 197.4 |
| C | 4 | 254 | 1101405 | 5574.13 | 846 | 849 | 197.4 |
| C | 8 | 229 | 21499 | 104.59 | 846 | 849 | 197.4 |
| D | 5 | 233 | 245751 | 1170.66 | 854 | 827 | 209.2 |
| D | 2 | 152 | 237135 | 1129.47 | 854 | 827 | 209.2 |
| D | 13 | 104 | 196698 | 936.2 | 854 | 827 | 209.2 |
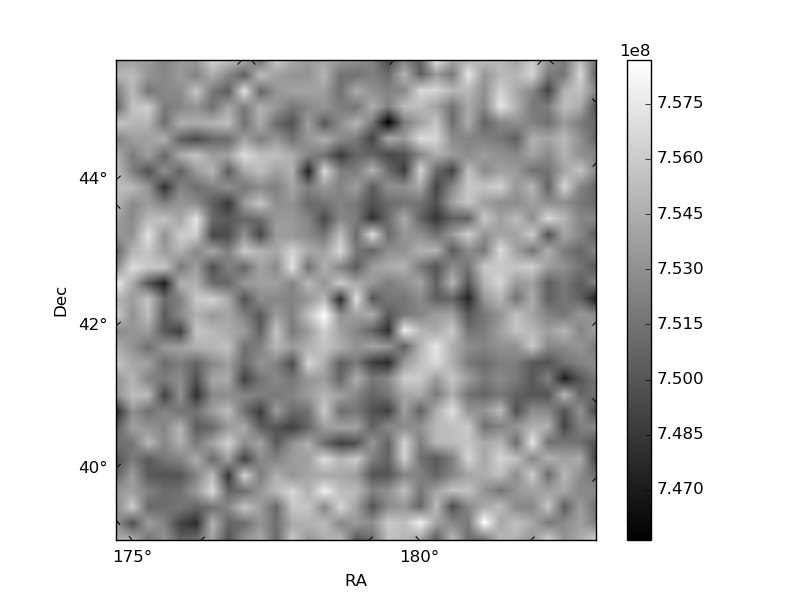
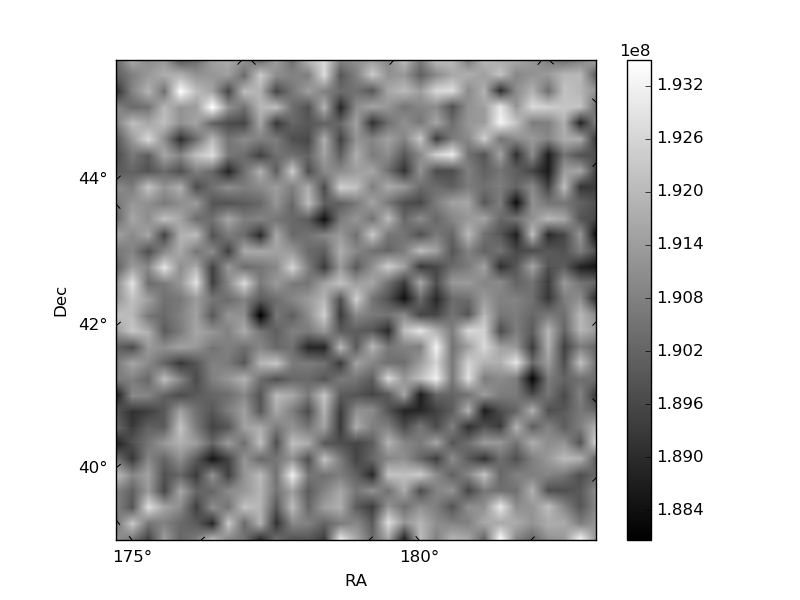
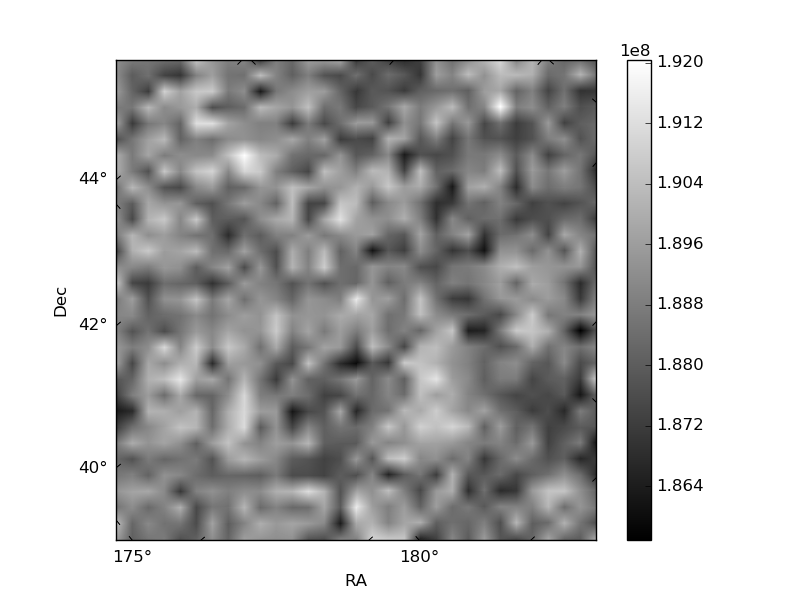
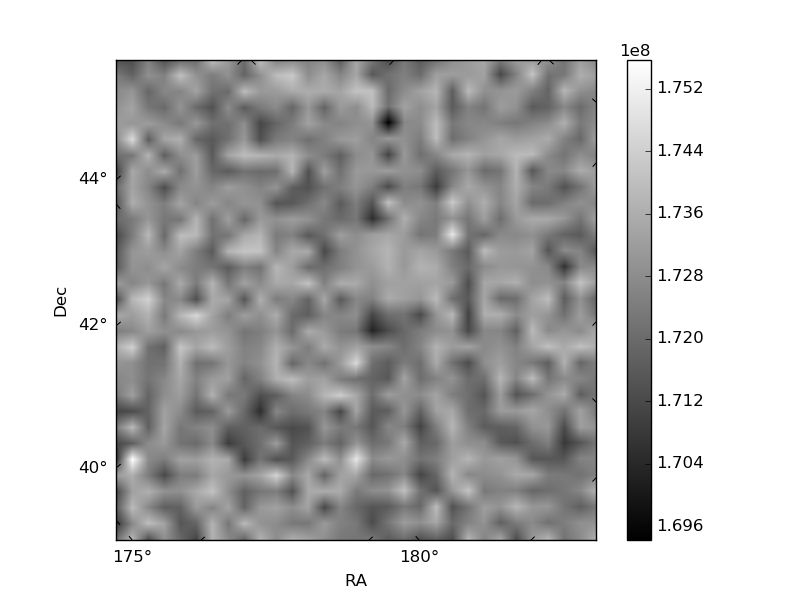
Histogram calculated using DETX and DETY for each event in the final _common_clean file
| Quadrant A | 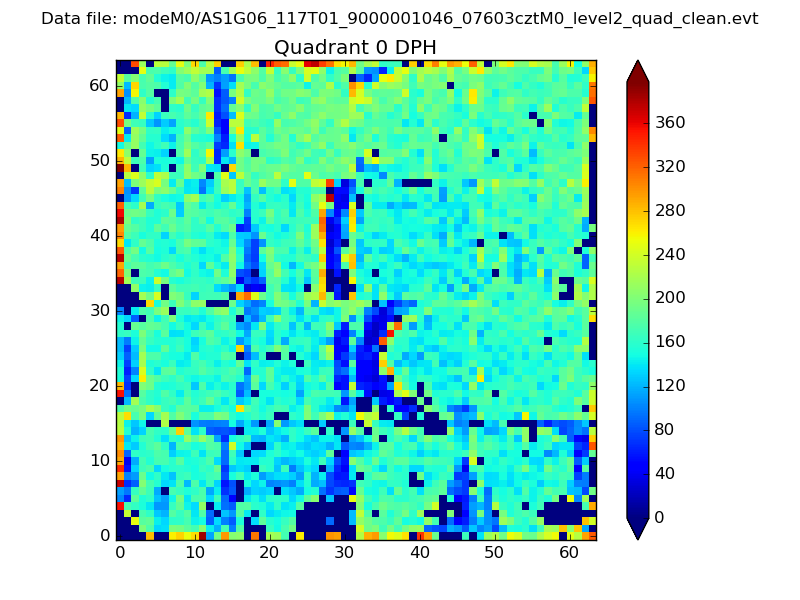 |
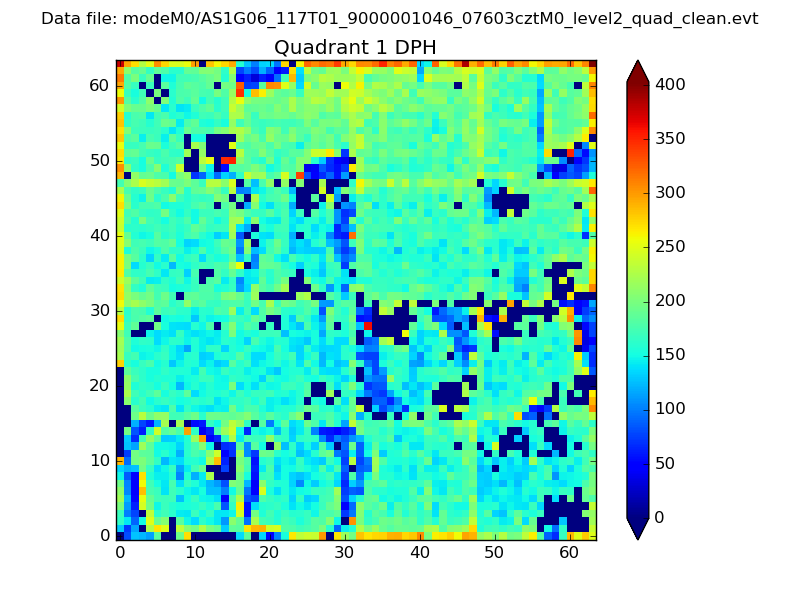 |
Quadrant B |
|---|---|---|---|
| Quadrant D | 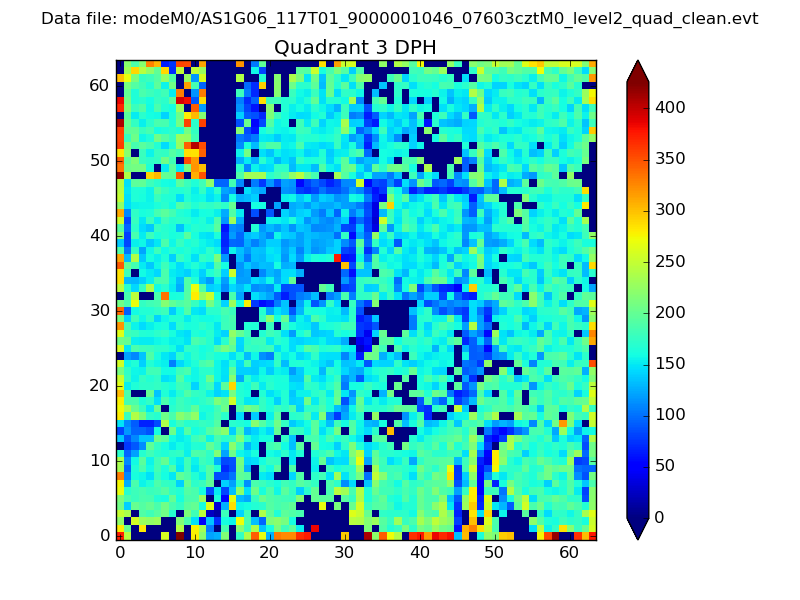 |
 |
Quadrant C |
| Plot type | Count rate plots | Images |
|---|---|---|
| Comparison with Poisson distribution Blue bars denote a histogram of data divided into 1 sec bins. Red curve is a Poisson curve with rate = median count rate of data. |
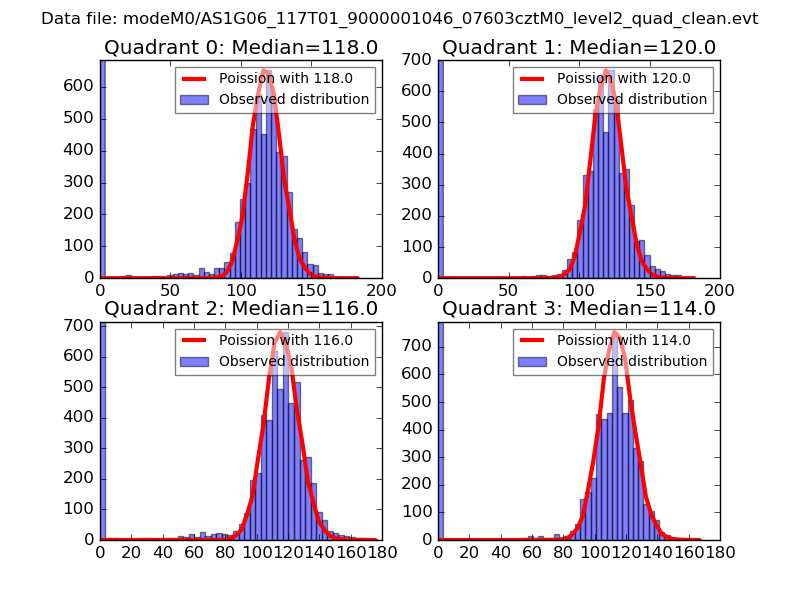 |
 |
| Quadrant-wise count rates Data is divided into 100 sec bins |
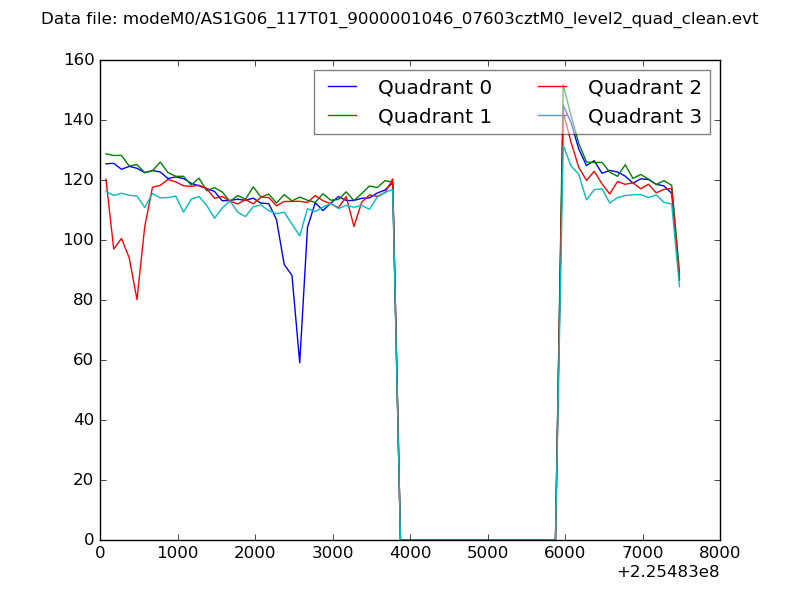 |
|
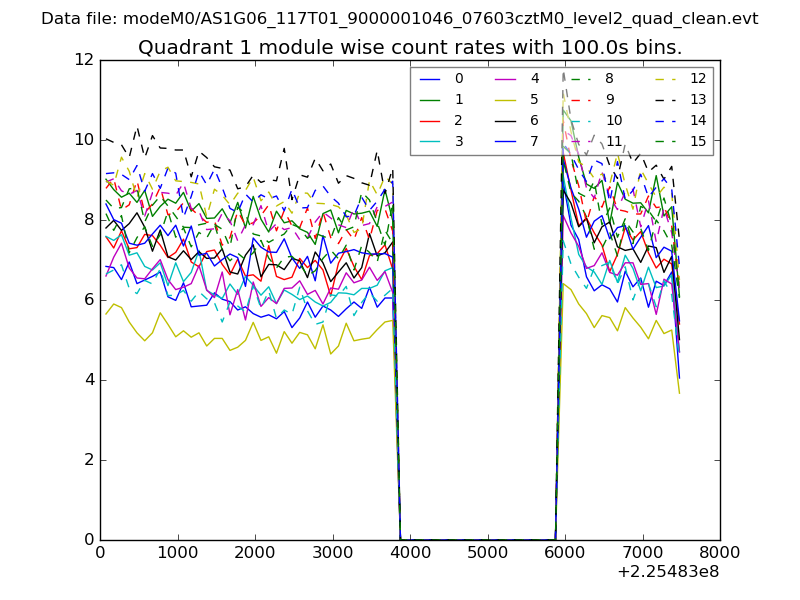
| Module-wise count rates for Quadrant A Data is divided into 100 sec bins |
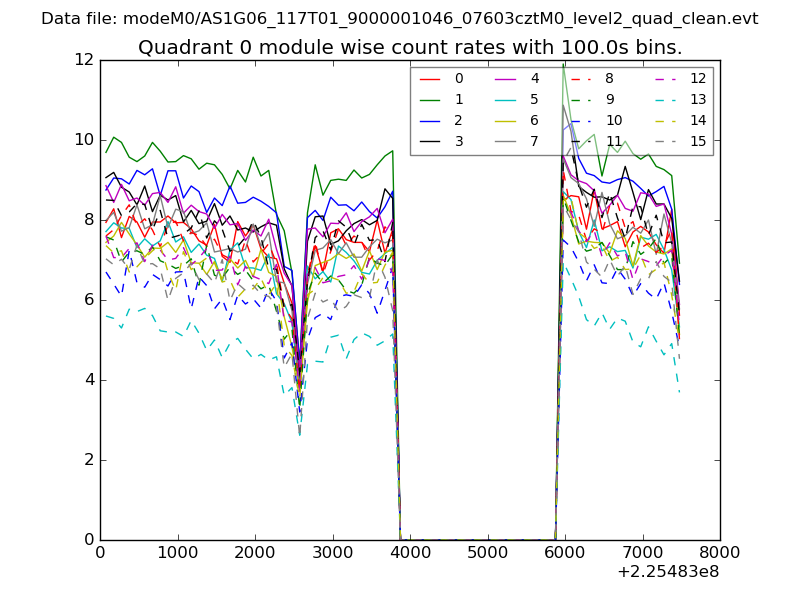 |
 |
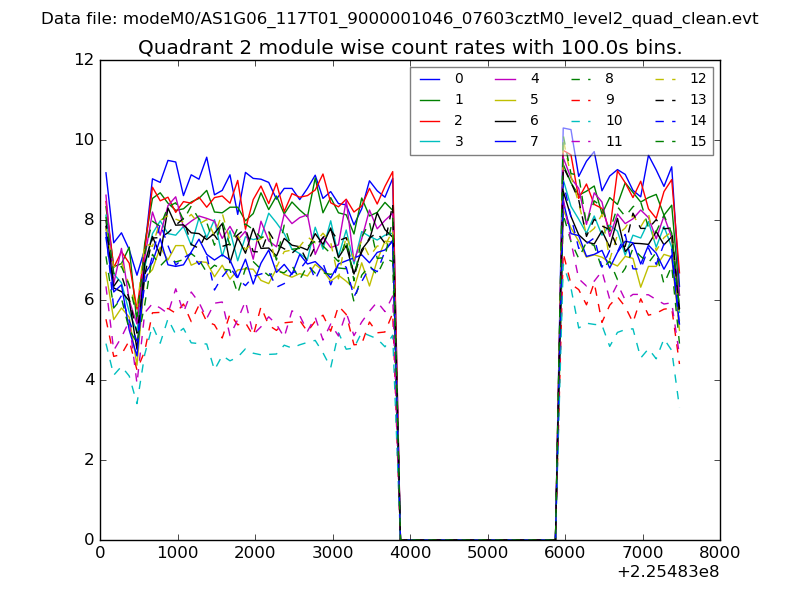
| Module-wise count rates for Quadrant B Data is divided into 100 sec bins |
 |
 |
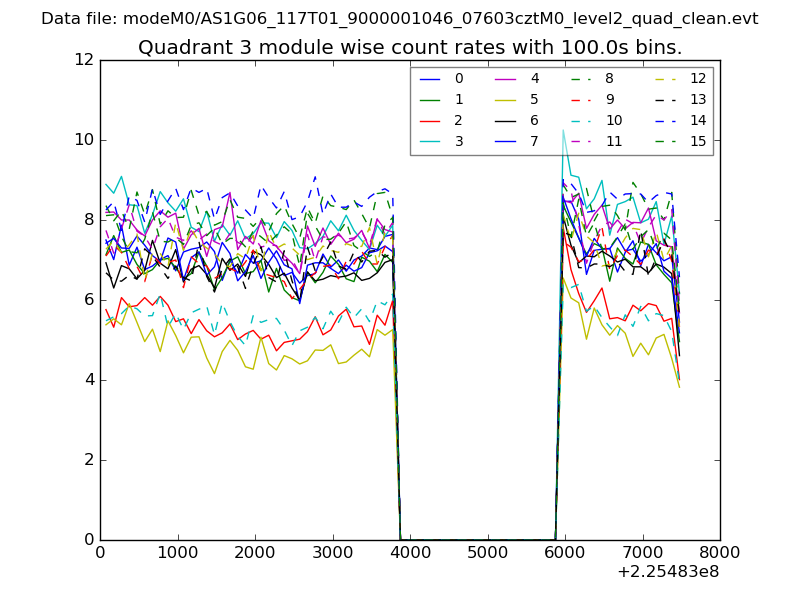
| Module-wise count rates for Quadrant C Data is divided into 100 sec bins |
 |
 |
| Module-wise count rates for Quadrant D Data is divided into 100 sec bins |
 |
 |
| Parameter | Plot |
|---|---|
| CZT HV Monitor | 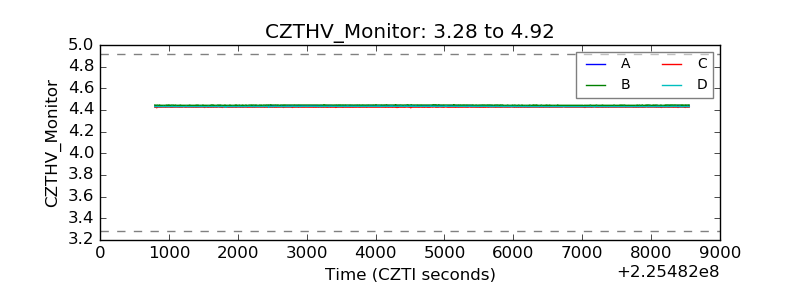 |
| D_VDD | 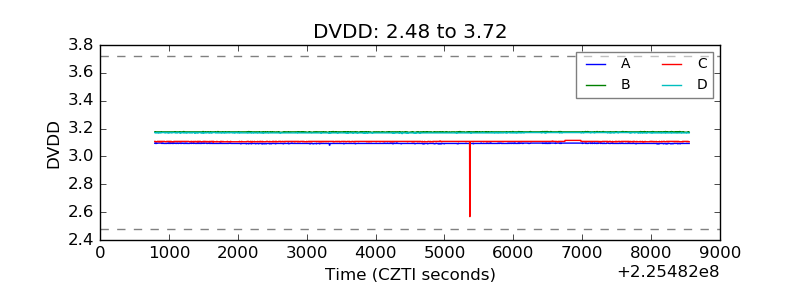 |
| Temperature 1 | 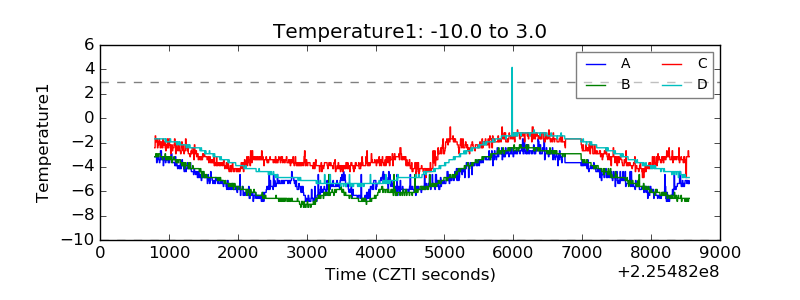 |
| Veto HV Monitor | 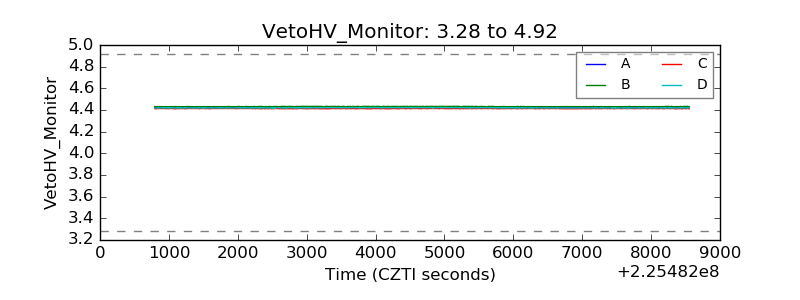 |
| Veto LLD | 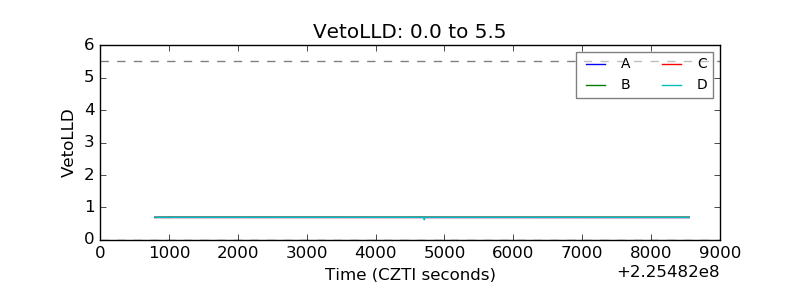 |
| Alpha Counter | 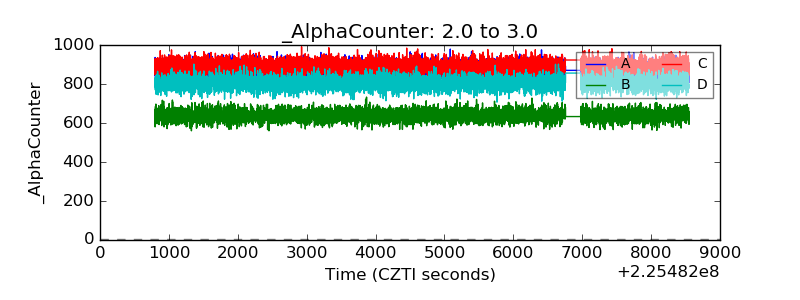 |
| _CPM_Rate | 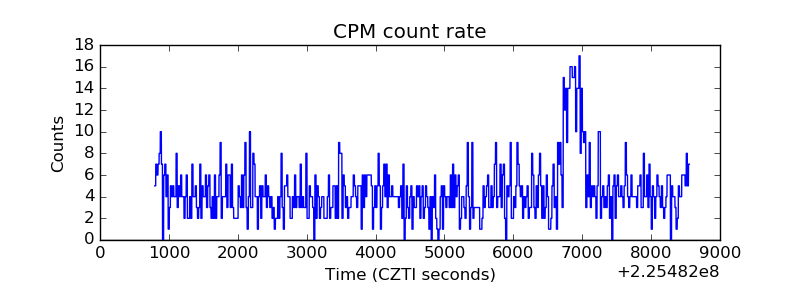 |
| CZT Counter |  |
| +2.5 Volts monitor |  |
| +5 Volts monitor |  |
| _ROLL_ROT | 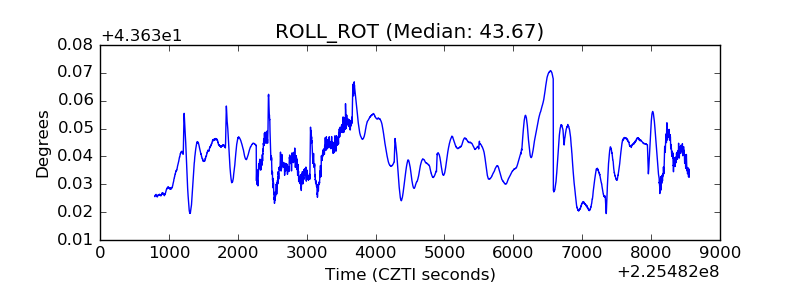 |
| _Roll_DEC | 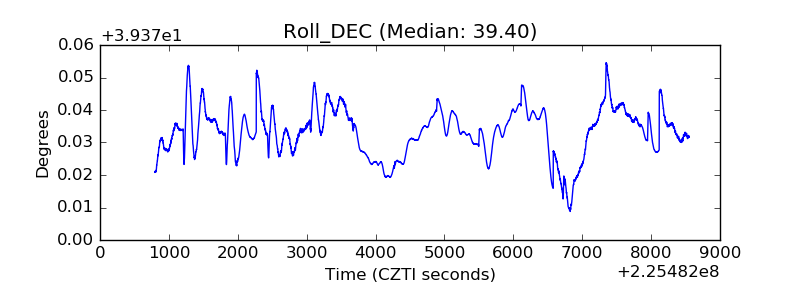 |
| _Roll_RA | 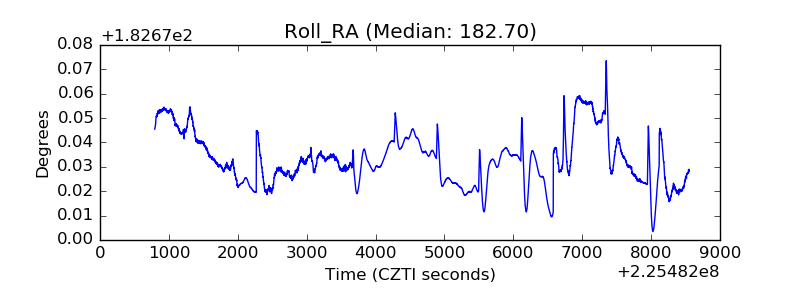 |
| Veto Counter | 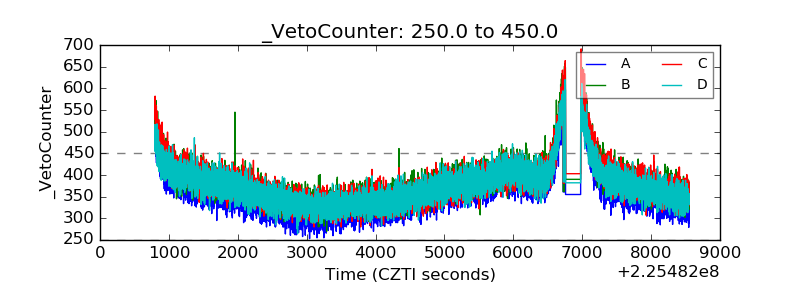 |