| Param | Original file | Final file |
|---|---|---|
| Filename | modeM0/AS1G06_117T01_9000001046_07604cztM0_level2.evt | modeM0/AS1G06_117T01_9000001046_07604cztM0_level2_quad_clean.evt |
| Size (bytes) | 628,274,880 | 108,691,200 |
| Size | 599.2 MB | 103.7 MB |
| Events in quadrant A | 4,344,803 | 675,112 |
| Events in quadrant B | 4,350,929 | 684,731 |
| Events in quadrant C | 4,650,128 | 675,324 |
| Events in quadrant D | 5,085,938 | 646,736 |
| Mode SS | |||
|---|---|---|---|
| Quadrant | BADHDUFLAG | Total packets | Discarded packets |
| A | 0 | 182 | 0 |
| B | 0 | 182 | 0 |
| C | 0 | 182 | 0 |
| D | 0 | 182 | 0 |
| Mode M0 | |||
|---|---|---|---|
| Quadrant | BADHDUFLAG | Total packets | Discarded packets |
| A | 0 | 19085 | 3 |
| B | 0 | 18851 | 2 |
| C | 0 | 19655 | 2 |
| D | 0 | 21396 | 2 |
| Mode M9 | |||
|---|---|---|---|
| Quadrant | BADHDUFLAG | Total packets | Discarded packets |
| A | 0 | 5 | 0 |
| B | 0 | 5 | 0 |
| C | 0 | 5 | 0 |
| D | 0 | 5 | 0 |
| Quadrant | Total seconds | Saturated seconds | Saturation percentage |
|---|---|---|---|
| A | 8783 | 71 | 0.808380% |
| B | 8783 | 100 | 1.138563% |
| C | 8783 | 138 | 1.571217% |
| D | 8783 | 184 | 2.094956% |
Noise dominated data is calculated using 1-second bins in cleaned event files. If a bin has >2000 counts, and if more than 50% of those come from <1% of pixels, then it is considered to be noise-dominated and hence unusable.
| Quadrant | # 1 sec bins | Bins with >0 counts | Bins with >2000 counts | High rate bins dominated by noise | Noise dominated (total time) | Noise dominated (detector-on time) | Marked lightcurve |
|---|---|---|---|---|---|---|---|
| A | 9293 | 8787 | 4 | 4 | 0.04% | 0.05% | 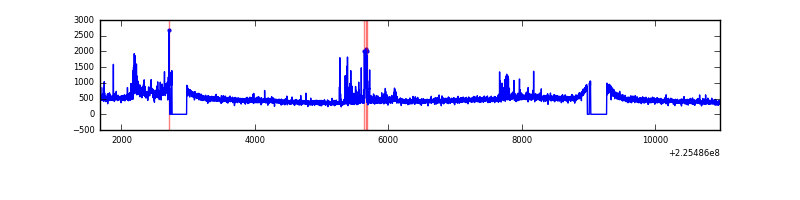 |
| B | 9293 | 8787 | 13 | 13 | 0.14% | 0.15% | 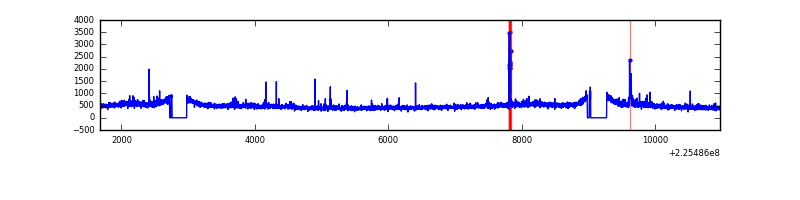 |
| C | 9293 | 8787 | 54 | 54 | 0.58% | 0.61% | 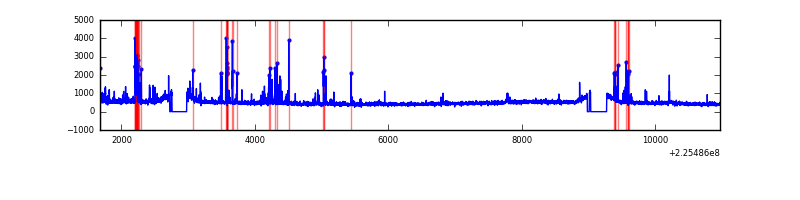 |
| D | 9293 | 8787 | 80 | 80 | 0.86% | 0.91% | 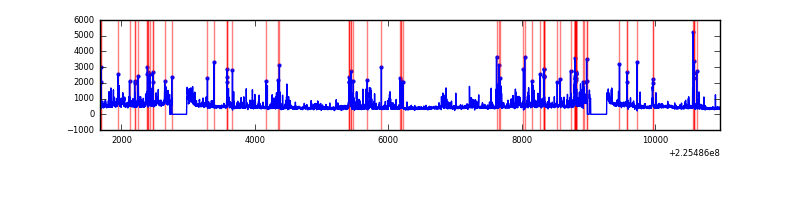 |
Top three noisy pixels from each quadrant. If the there are fewer than three noisy pixels in the level2.evt file, extra rows are filled as -1
| Pixel properties | Quadrant properties | ||||||
|---|---|---|---|---|---|---|---|
| Quadrant | DetID | PixID | Counts | Sigma | Mean | Median | Sigma |
| A | 15 | 239 | 301924 | 1410.49 | 1050 | 1027 | 213.3 |
| A | 0 | 226 | 9821 | 41.22 | 1050 | 1027 | 213.3 |
| A | 12 | 194 | 9313 | 38.84 | 1050 | 1027 | 213.3 |
| B | 0 | 214 | 76250 | 370.09 | 1060 | 1032 | 203.2 |
| B | 0 | 219 | 54137 | 261.29 | 1060 | 1032 | 203.2 |
| B | 2 | 246 | 28385 | 134.58 | 1060 | 1032 | 203.2 |
| C | 4 | 254 | 310649 | 1294.84 | 1026 | 1030 | 239.1 |
| C | 9 | 68 | 247559 | 1031.0 | 1026 | 1030 | 239.1 |
| C | 1 | 16 | 45035 | 184.03 | 1026 | 1030 | 239.1 |
| D | 2 | 152 | 403884 | 1612.96 | 1019 | 988 | 249.8 |
| D | 5 | 233 | 183868 | 732.14 | 1019 | 988 | 249.8 |
| D | 13 | 104 | 176825 | 703.95 | 1019 | 988 | 249.8 |
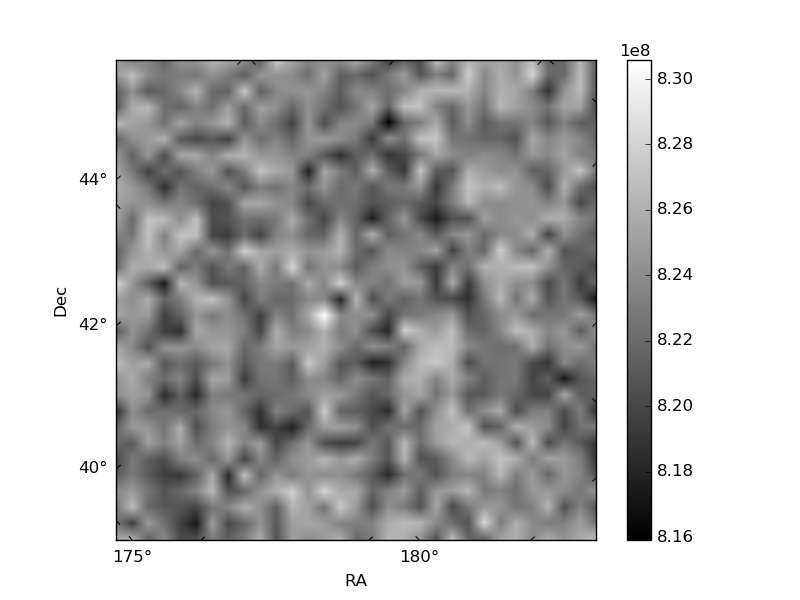
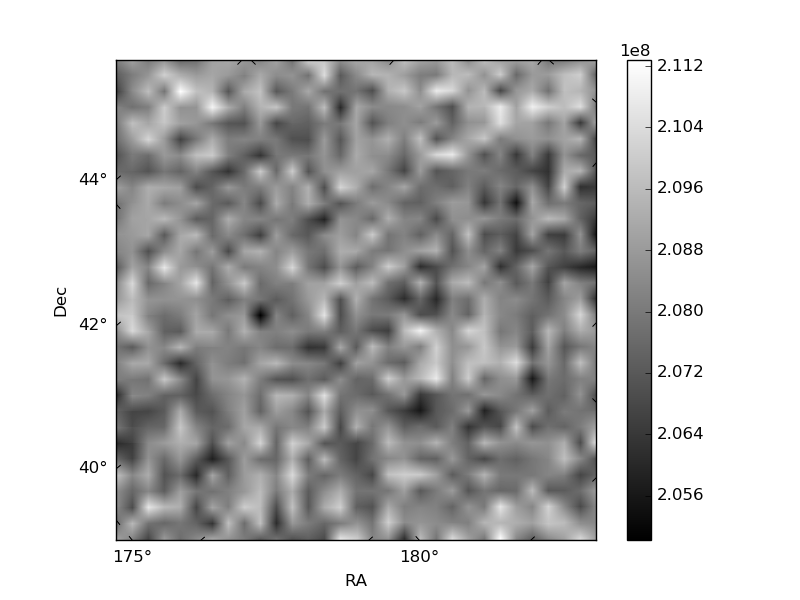
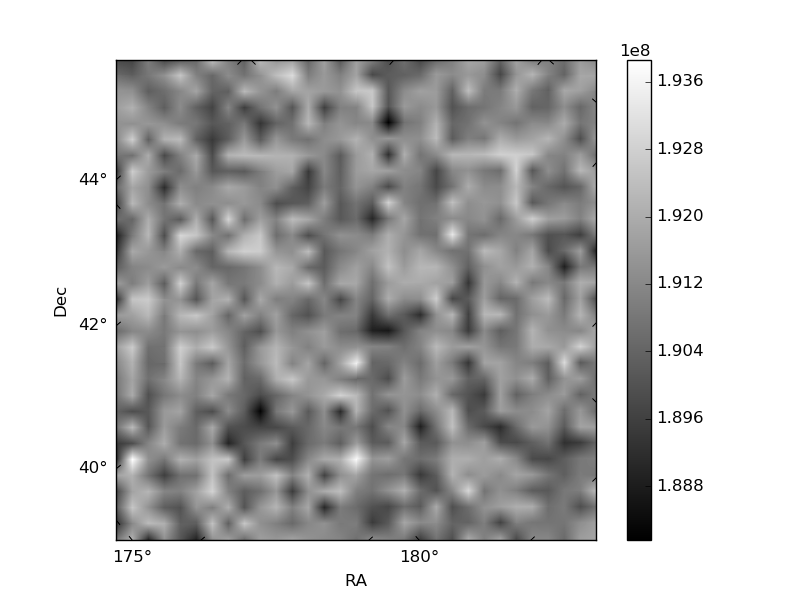
Histogram calculated using DETX and DETY for each event in the final _common_clean file
| Quadrant A | 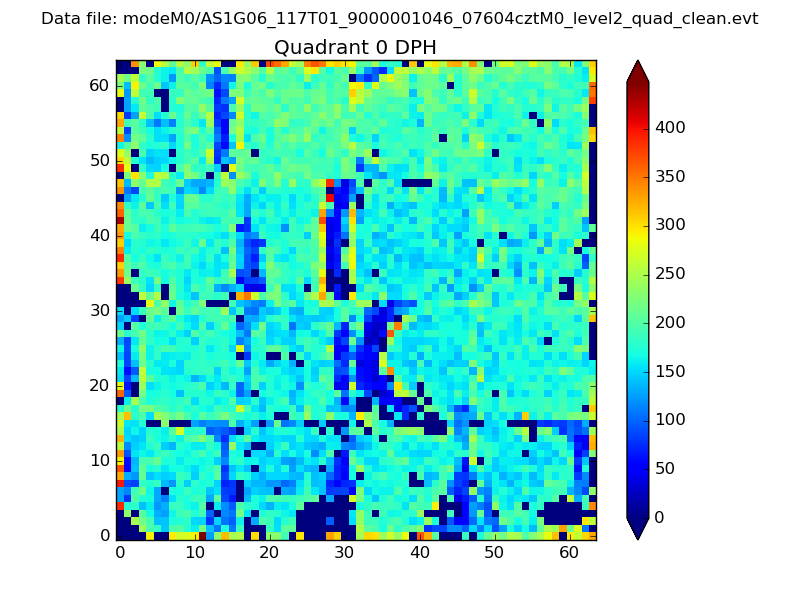 |
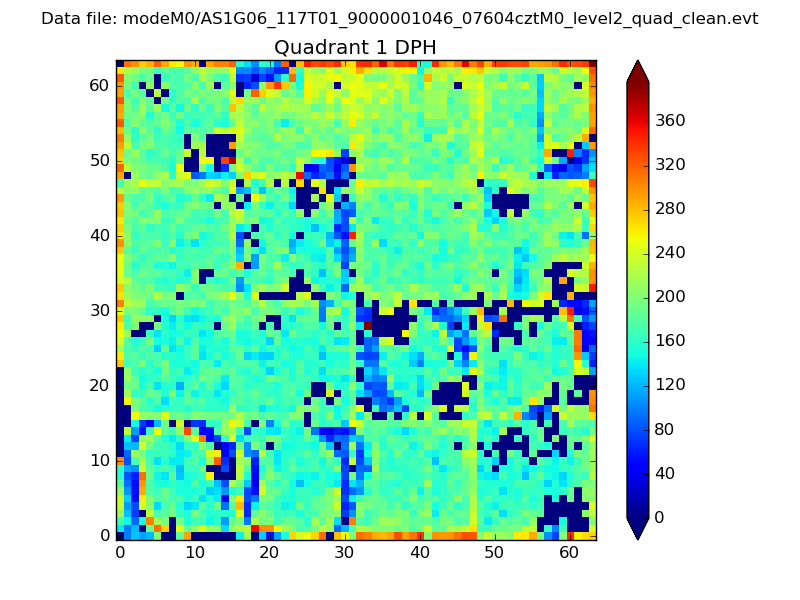 |
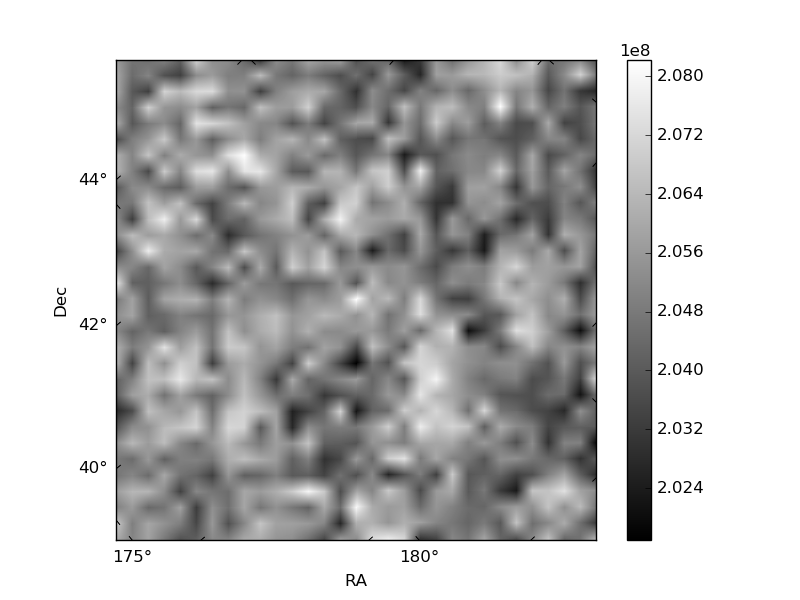
Quadrant B |
|---|---|---|---|
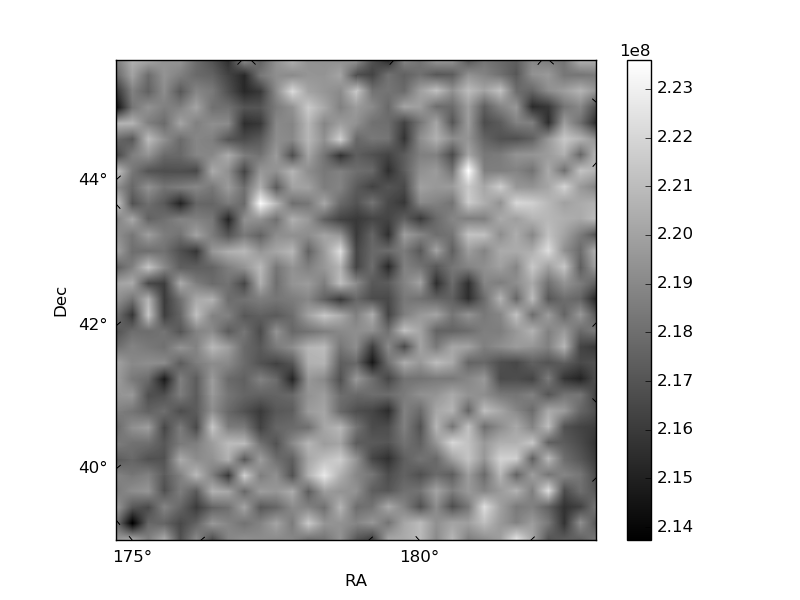
| Quadrant D | 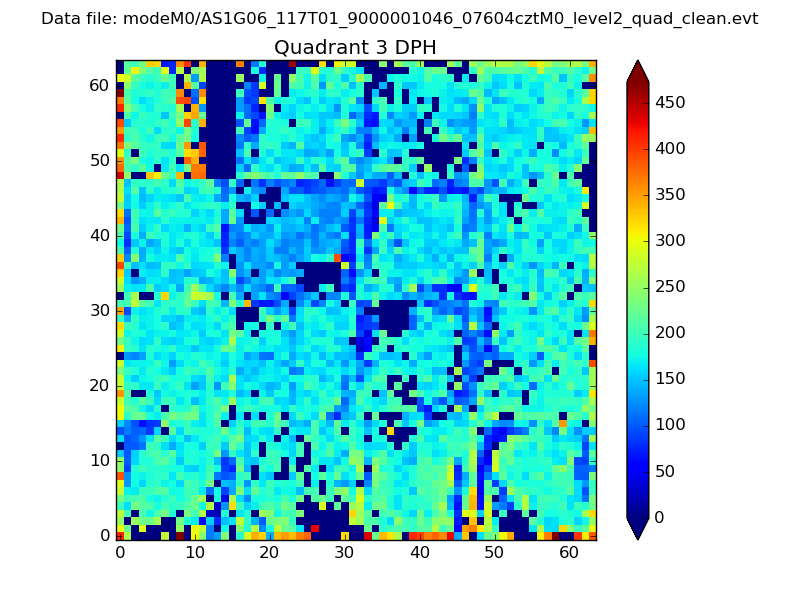 |
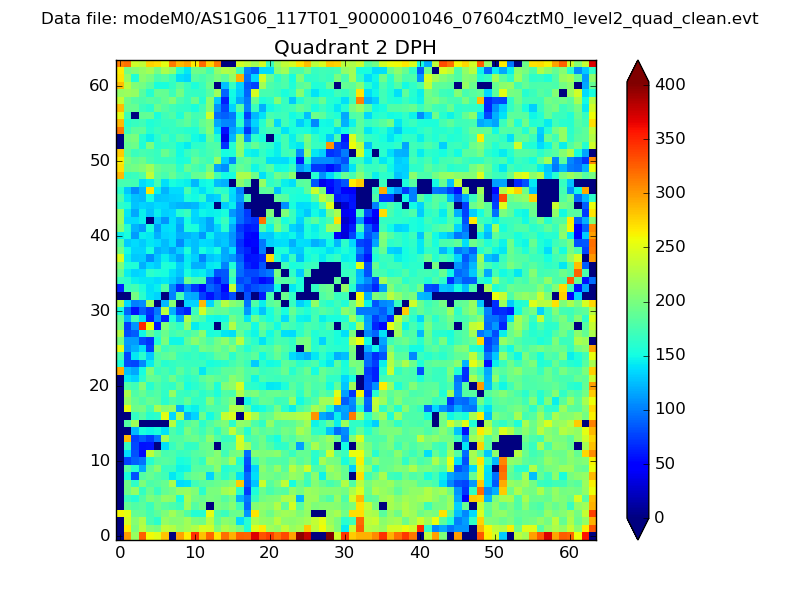 |
Quadrant C |
| Plot type | Count rate plots | Images |
|---|---|---|
| Comparison with Poisson distribution Blue bars denote a histogram of data divided into 1 sec bins. Red curve is a Poisson curve with rate = median count rate of data. |
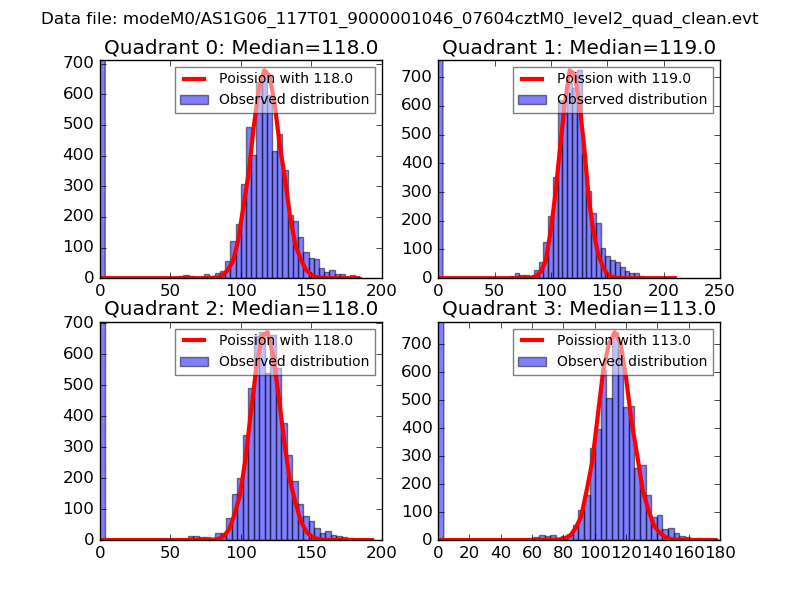 |
 |
| Quadrant-wise count rates Data is divided into 100 sec bins |
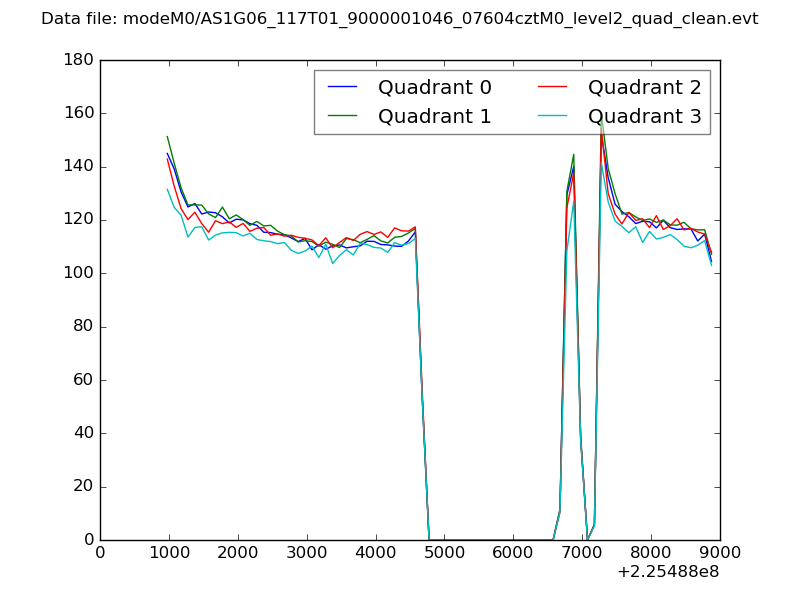 |
|
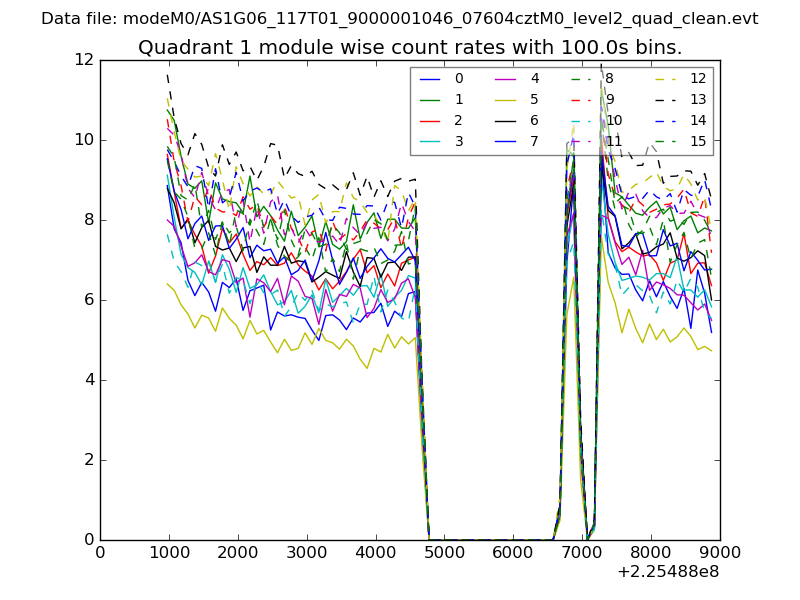
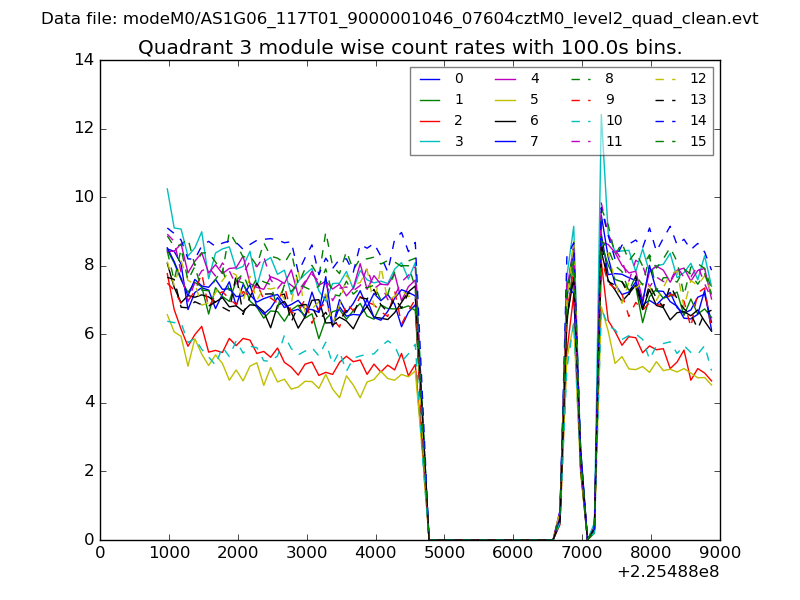
| Module-wise count rates for Quadrant A Data is divided into 100 sec bins |
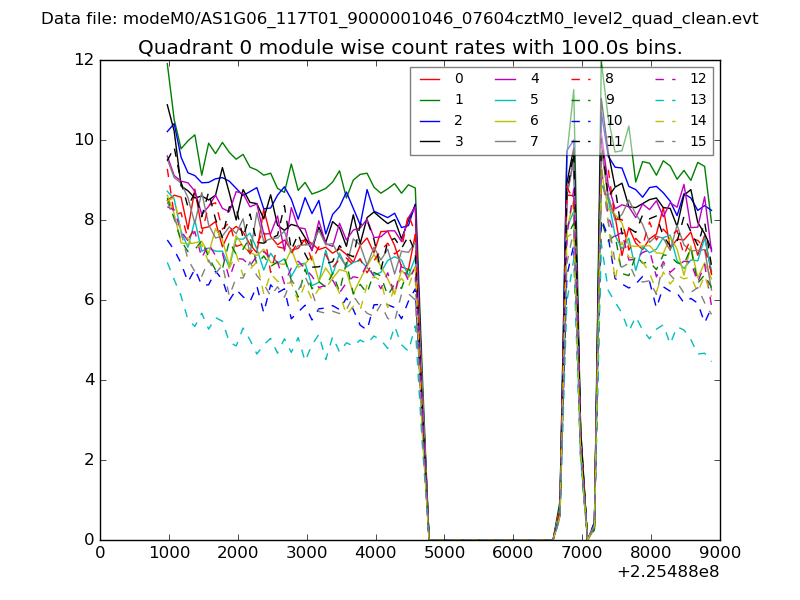 |
 |
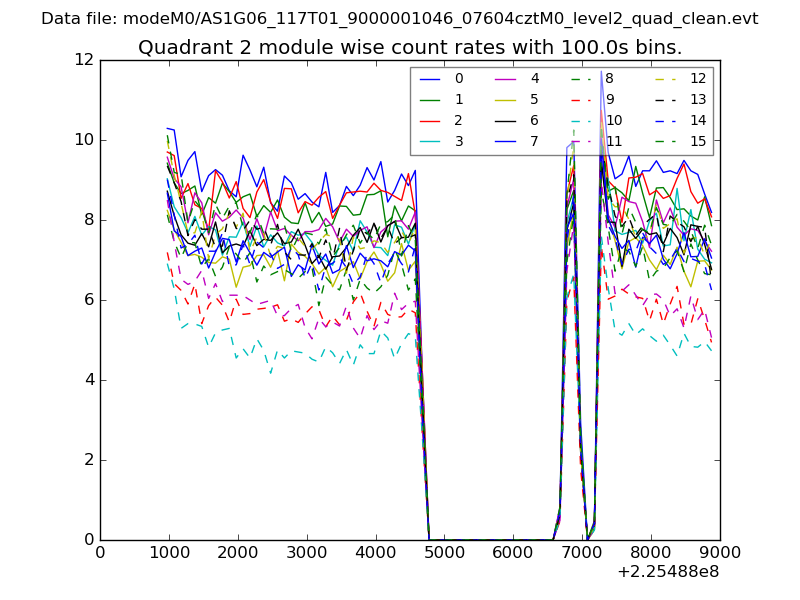
| Module-wise count rates for Quadrant B Data is divided into 100 sec bins |
 |
 |
| Module-wise count rates for Quadrant C Data is divided into 100 sec bins |
 |
 |
| Module-wise count rates for Quadrant D Data is divided into 100 sec bins |
 |
 |
| Parameter | Plot |
|---|---|
| CZT HV Monitor | 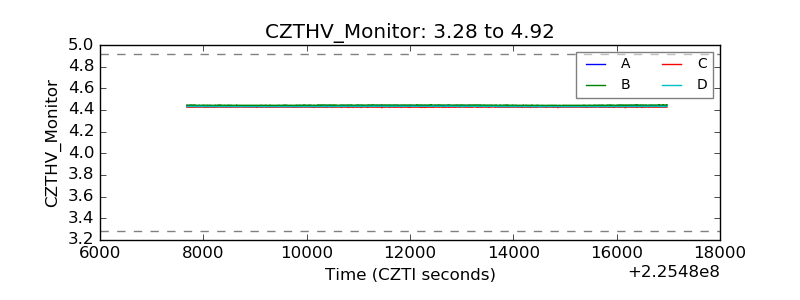 |
| D_VDD | 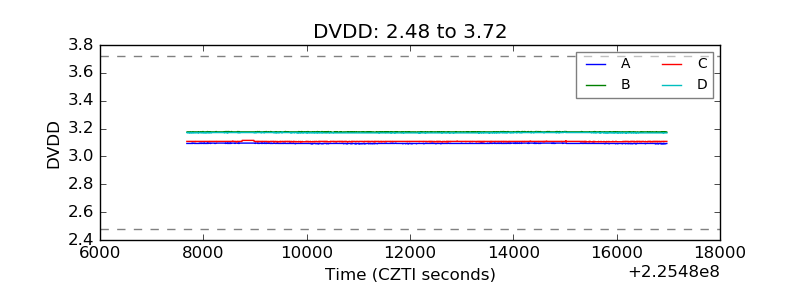 |
| Temperature 1 | 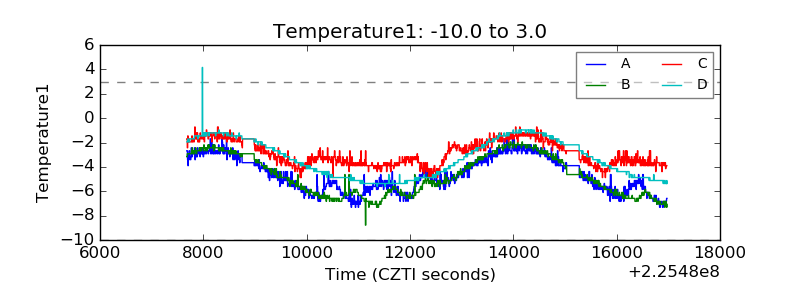 |
| Veto HV Monitor | 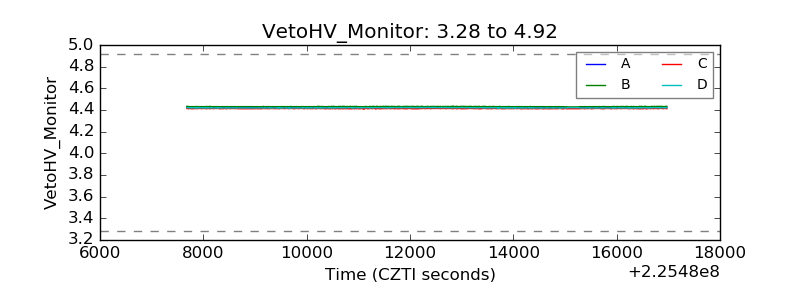 |
| Veto LLD | 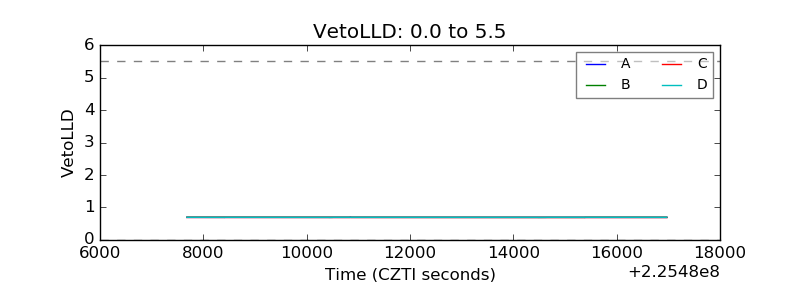 |
| Alpha Counter | 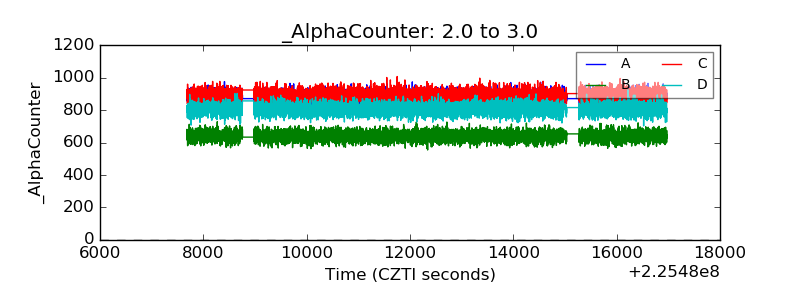 |
| _CPM_Rate | 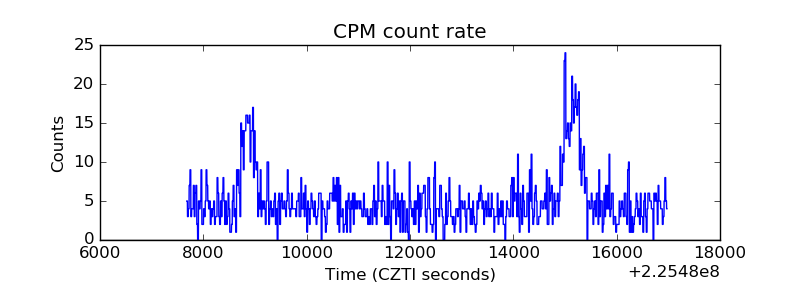 |
| CZT Counter | 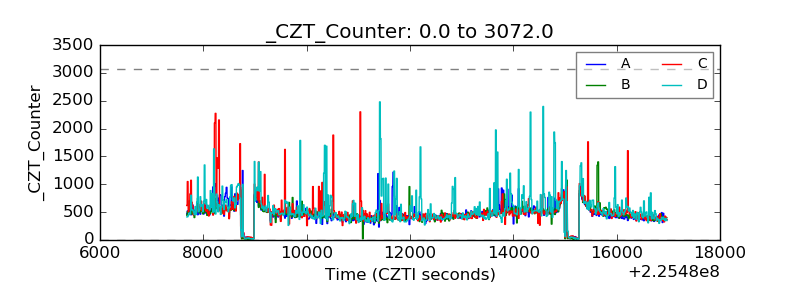 |
| +2.5 Volts monitor |  |
| +5 Volts monitor |  |
| _ROLL_ROT | 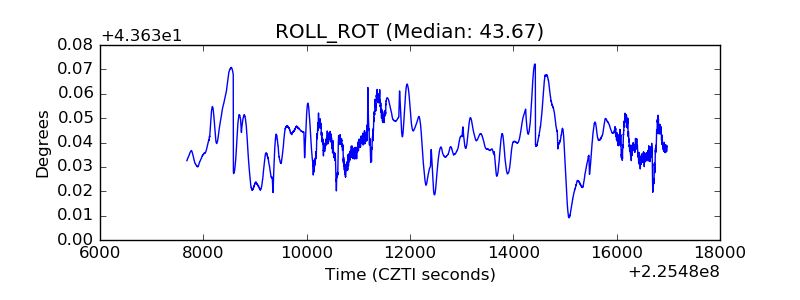 |
| _Roll_DEC | 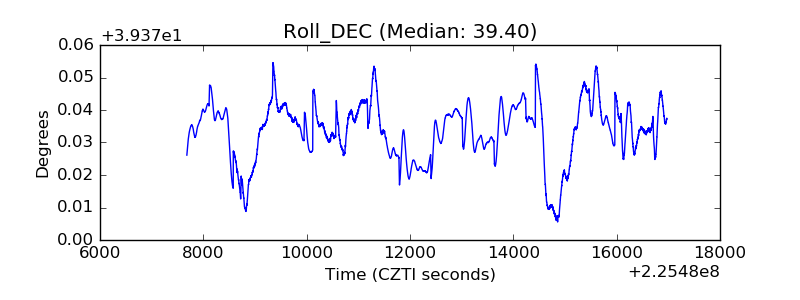 |
| _Roll_RA | 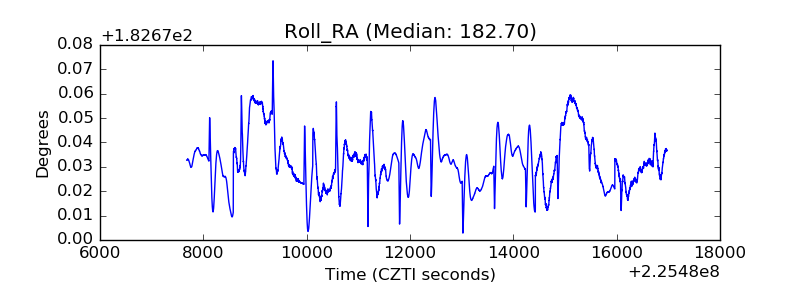 |
| Veto Counter | 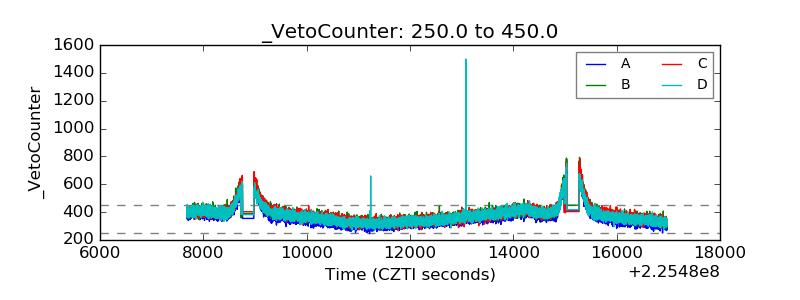 |